. 2022 Mar 21;17(3):e0265432.
doi: 10.1371/journal.pone.0265432. eCollection 2022.

Variation in CFTR-dependent 'β-sweating' among healthy adults

Affiliations

Variation in CFTR-dependent 'β-sweating' among healthy adults

Lesje DeRose et al. PLoS One. .

Abstract

The genetic disease cystic fibrosis (CF) results when mutations in the gene for the anion channel CFTR reduce CFTR's activity below a critical level. CFTR activity = N·PO·γ (number of channels x open probability x channel conductance). Small molecules are now available that partially restore CFTR function with dramatic improvements in health of CF subjects. Continued evaluation of these and other compounds in development will be aided by accurate assessments of CFTR function. However, measuring CFTR activity in vivo is challenging and estimates vary widely. The most accurate known measure of CFTR activity in vivo is the 'β/M' ratio of sweat rates, which is produced by stimulation with a β-adrenergic agonist cocktail referenced to the same individual's methacholine-stimulated sweat rate. The most meaningful metric of CFTR activity is to express it as a percent of normal function, so it is critical to establish β/M carefully in a population of healthy control subjects. Here, we analyze β/M from a sample of 50 healthy adults in which sweat rates to cholinergic and β-adrenergic agonists were measured repeatedly (3 times) in multiple, (~50) identified sweat glands from each individual (giving ~20,000 measurements). The results show an approximately 7-fold range, 26-187% of the WT average set to 100%. These provide a benchmark against which other measures of CFTR activity can be compared. Factors contributing to β/M variation in healthy controls are discussed.


Conflict of interest statement

The authors have declared that no competing interests exist.

Figures

Fig 1
Fig 1. Inheritance probabilities for a monogenetic disease.
A. Traditional diagram of inheritance probabilities for a monogenetic disease like CF in a family where both parents are carriers. Each child has an equal chance of getting the CF allele, so on average half the children are carriers, ¼ are not carriers, and ¼ have the CF phenotype. This works for phenotypic traits that are not rate-limited by the gene product, so that the carrier phenotype is unaffected, giving on average ¼ affected offspring. B. Ranges of phenotypic traits that are rate-limited by the gene that causes disease when both alleles are mutated. Unaffected individual show a range of function and carriers have half of that. For simplicity, a single range of function is shown. White is full function, black is zero function, gradient is intermediate function. CF is a recessive disease in which some traits are rate-limited by the gene product and are therefore ‘semi-dominant’. So far, very few physiological measures are known to be rate-limited by CFTR; these include β-sweat secretion and bicarbonate secretion in the airways.
Fig 2
Fig 2. Within-subject sweat rates.
Within-subject variation of β-adrenergic/cholinergic sweat rate ratios from each of 52 identified glands in a single subject, S-38, plotted against the cholinergic rate. For each gland, the average across all 3 tests was determined for M and C sweat rates, which was used to compute the Cav/Mav ratio for that gland. The ratio was plotted against the Mav for that gland to give the distribution shown for all 52 glands; means and SDs are plotted. Star shows the grand mean, obtained by summing the Mav from each of the 52 glands dividing by 52 to give (for this subject) 3.2 nl/min/gland. Similarly, the Cav/Mav ratio for each of the 52 glands were summed and divided by 52 for to give (for this subject), Cav/Mav = 0.23. The grand means were plotted for each of 50 subjects in Fig 3. Inset shows the distribution of βav/Mav ratios.
Fig 3
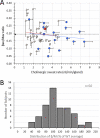
Fig 3. Consistent differences in β-sweating across subjects.
A. Distribution of average β-sweat rate to the average cholinergic sweat rate for 50 subjects. SEMs are shown in one direction for clarity. Except as noted, each point represents averages from 3 tests per subject and corresponds to the star in Fig 2. For each of the three tests an average of 60 ± 19 identified glands were measured. Regression did not differ significantly from zero (r = 0.15, n = 50, p = 0.30) or for sexes considered separately (shown as red and blue lines). Dark dashed arrow indicates the overall β/M average for all 50 subjects; lighter dashed arrows are ± one SD. Pink triangles are female subjects and blue circles are males. Red circle is mean data for subject 38 and corresponds to the star in Fig 2. One subject has only two tests and two subjects had only a single test (see Table 1). B. Each point was normalized to the mean set to 100%, and the distribution plotted.
Fig 4
Fig 4. Distribution of sweat chloride values for 46 control subjects.
A. Distribution of sweat chloride values for 46 control subjects. The distribution does not differ significantly from normal (p = 0.63, Kolmogorov-Smirnov test). B. Sweat chloride values were uncorrelated with β/M values (r = 0.07, n = 46, p = 0.65).
Fig 5
Fig 5. Arm size and sex affect sweat gland M-sweat rates.
A. Arm circumference at the test site was positively correlated with M-sweat rates of individual glands (r = 0.34, n = 34, p < 0.05). B. Arm circumference at the test site was positively correlated with C-sweat rates of individual glands but did not reach significance (r = 0.19, n = 33, n.s). C. In a size-matched sample, M-sweat rates of males (blue circles) were significantly greater than females (pink triangles), 2.53 ± 0.67 vs. male: 4.25 ± 1.52, p < 0.01,*indicates p < 0.01. Means and SD indicated. D. In a size-matched sample, β-sweat rates of males (blue circles) were not significantly greater than females (pink triangles): female 0.47 ± 0.17 vs male 0.75 ± 0.41 p = 0.08, ns). Means and SD indicated.

Similar articles

References

    1. Zlotogora J. Penetrance and expressivity in the molecular age. Genet Med. 2003;5(5):347–52. Epub 2003/09/23. doi: 10.1097/01.gim.0000086478.87623.69 . - DOI - PubMed
    1. Miller AC, Comellas AP, Hornick DB, Stoltz DA, Cavanaugh JE, Gerke AK, et al.. Cystic fibrosis carriers are at increased risk for a wide range of cystic fibrosis-related conditions. Proc Natl Acad Sci U S A. 2020;117(3):1621–7. Epub 2019/12/29. doi: 10.1073/pnas.1914912117 ; PubMed Central PMCID: PMC6983448. - DOI - PMC - PubMed
    1. Rosen BH, Evans TIA, Moll SR, Gray JS, Liang B, Sun X, et al.. Infection Is Not Required for Mucoinflammatory Lung Disease in CFTR-Knockout Ferrets. Am J Respir Crit Care Med. 2018;197(10):1308–18. doi: 10.1164/rccm.201708-1616OC ; PubMed Central PMCID: PMC5955060. - DOI - PMC - PubMed
    1. Wine JJ. How to live a long and healthy life with cystic fibrosis: Lessons from the CF ferret. J Cyst Fibros. 2019;18(1):8–9. Epub 2018/10/27. doi: 10.1016/j.jcf.2018.10.005 . - DOI - PubMed
    1. Collaco JM, Blackman SM, Raraigh KS, Corvol H, Rommens JM, Pace RG, et al.. Sources of Variation in Sweat Chloride Measurements in Cystic Fibrosis. Am J Respir Crit Care Med. 2016;194(11):1375–82. Epub 2016/06/04. doi: 10.1164/rccm.201603-0459OC ; PubMed Central PMCID: PMC5148144. - DOI - PMC - PubMed

Publication types

Substances