. 2022 Mar 21;17(3):e0265735.
doi: 10.1371/journal.pone.0265735. eCollection 2022.

Exploring the evolution of biochemical models at the network level

Affiliations

Exploring the evolution of biochemical models at the network level

Tom Gebhardt et al. PLoS One. .

Abstract

The evolution of biochemical models is difficult to track. At present, it is not possible to inspect the differences between model versions at the network level. Biochemical models are often constructed in a distributed, non-linear process: collaborators create model versions on different branches from novel information, model extensions, during curation and adaption. To discuss and align the versions, it is helpful to abstract the changes to the network level. The differences between two model versions can be detected by the software tool BiVeS. However, it cannot show the structural changes resulting from the differences. Here, we present a method to visualise the differences between model versions effectively. We developed a JSON schema to communicate the differences at the network level and extended BiVeS accordingly. Additionally, we developed DiVil, a web-based tool to represent the model and the differences as a standardised network using D3. It combines an automatic layout with an interactive user interface to improve the visualisation and to inspect the model. The network can be exported in standardised formats as images or markup language. Our method communicates the structural differences between model versions. It facilitates the discussion of changes and thus supports the collaborative and non-linear nature of model development. Availability and implementation: DiVil prototype: https://divil.bio.informatik.uni-rostock.de, Code on GitHub: https://github.com/Gebbi8/DiVil, licensed under Apache License 2.0. Contact: url="tom.gebhardt@uni-rostock.de.


Conflict of interest statement

The authors have declared that no competing interests exist.

Figures

Fig 1
Fig 1. Abstract representation of the development of the Kummer2000 model [2].
Seven versions of the SBML model were published in BioModels between 2011 and 2017. Figure (a) shows the model’s evolution timeline. The slope between two versions represents the number of changes detected by BiVeS. When comparing the fifth and the sixth version a vast amount of changes are falsely detected by the default change detection tool Unix-Diff. The snippet from (b) shows that the Unix-Diff was not able to map species definitions on each other, although the compared species are very similar in both versions. Figure (c) shows a snippet of the BiVeS report for the same species. BiVeS maps both elements and correctly detects the changes in the attributes.
Fig 2
Fig 2. Condensed SBML file.
This exemplary file was reduced to the information relevant to retrieve a standardised network visualisation. The information is encapsulated in the three lists: compartments, species and reactions.
Fig 3
Fig 3. JSON input format for D3.
The basic network level information are encapsulated in the lists nodes and links. Each element can be enriched with additional attributes.
Fig 4
Fig 4. Workflow for the visualisation of differences between two model versions.
BiVeS computes the differences between two model version files and provides several output formats to explore them. Based on BiVeS’ internal structure, we provide an additional output format to visualise the differences in D3. D3 needs several extensions to represent the network and differences in the standardised SBGN PD format. The right-hand side of the figure shows the result obtained from DiVil after comparing the Kummer2000 model versions five and six (see also Fig 1). We simplified the figure by deleting a few nodes to improve the readability. The coloured elements represent the changes detected by BiVeS. Green strokes indicate that the element was added in version six. Red elements occurred in version five but not six and yellow strokes indicate that the element occurred in both versions but attributes or sub nodes have changed.
Fig 5
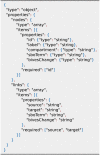
Fig 5. JSON schema to connect BiVeS and D3.
Visualising differences in an SBGN PD network requires several information. D3 expects an array of nodes and links as input, representing the network structure. For nodes the attribute id is mandatory and links are required to have source and targets. These attributes are sufficient to build the network. Due to the default glyph and arc in SBGN, the other attributes are optional. However, we encourage everyone to make full use of the available node and link types to utilise the capabilities of SBGN PD and BiVeS.
Fig 6
Fig 6. Mapping BiVeS’ internal structure to SBGN PD.
Internally, BiVeS describes links as direct interactions between species (a). In SBGN PD, every process requires a process node in which all links of this process start or end (b). Thus, we add an additional node to our list of species and adapt the links accordingly. The translation from (a) to (b) is shown in Figure (c).
Fig 7
Fig 7. Geometric challenges when visualising SBGN PD networks.
(a) Showcase of the arrow head placement for different arrow head and symbol combinations: I Unspecified entity, II Complex, III Simple Chemical and IV Macromolecule. (b) Visualising overlapping information. Showing the differences between two model version often results in several links between two nodes. By bending the link we are avoiding an overlap of the arcs. For each conflicting link the bend direction is altered, as shown on the bottom. Additionally we are increasing the bend for every 2n + 1 link. If the number of affected links is odd, as shown at the top, we are placing one arc as a straight link. The other links are computed as before.
Fig 8
Fig 8. Screenshot of Divil’s output when comparing versions five and six of the Kummer2000 model, after manual layout improvements.
Red strokes mark elements that only appeared in version five, green strokes indicate that the elements only occurred (and were added) in version six and yellow nodes have been updated during the version transition. In this example all reactions have been added, one compartment (ER) and one species (Calcium-ER) was deleted. Another compartment (compartment) was added, while three species where updated.
Fig 9
Fig 9. Change list for a species in DiVil.
When comparing version five and six of the Kummer2000 model and selecting the Calcium species, a list of all relevant changes for this species is shown. Several attributes have changed during the version transition. E.g. the name of the species and its compartment were updated. Additionally attributes, such as initial concentration and constant were added. Changes in the annotations were also detected but not displayed in favour of a clear display.
Fig 10
Fig 10. Change list for a reaction in DiVil.
When comparing version six and seven of the Dupreez model several changes are detected for the reaction ADP + BPGATP + P3G. In version six ADP was a modifier in this reaction, while in version seven it is a reactant. Thus, in DiVil ADP is connected with a red modulation arc and a green consumption arc to the process node. Additionally, several meta ids of the reaction and its sub nodes were updated. The detected changes in annotations are not displayed in favour of a clear display.

Similar articles

References

    1. Scharm M, Wolkenhauer O, Waltemath D. An algorithm to detect and communicate the differences in computational models describing biological systems. Bioinformatics. 2016;32(4):563–570. doi: 10.1093/bioinformatics/btv484 - DOI - PMC - PubMed
    1. Kummer U, Olsen LF, Dixon CJ, Green AK, Bornberg-Bauer E, Baier G. Switching from simple to complex oscillations in calcium signaling. Biophys J. 2000;79(3):1188–1195. doi: 10.1016/S0006-3495(00)76373-9 - DOI - PMC - PubMed
    1. Malik-Sheriff RS, Glont M, Nguyen TVN, Tiwari K, Roberts MG, Xavier A, et al.. BioModels-15 years of sharing computational models in life science. Nucleic Acids Res. 2020;48(D1):D407–D415. doi: 10.1093/nar/gkz1055 - DOI - PMC - PubMed
    1. Keating SM, Waltemath D, König M, Zhang F, Dräger A, Chaouiya C, et al.. SBML Level 3: an extensible format for the exchange and reuse of biological models. Mol Syst Biol. 2020;16(8):e9110. doi: 10.15252/msb.20199110 - DOI - PMC - PubMed
    1. Cuellar A, Hedley W, Nelson M, Lloyd C, Halstead M, Bullivant D, et al.. The CellML 1.1 Specification. J Integr Bioinform. 2015;12(2):259. doi: 10.1515/jib-2015-259 - DOI - PubMed

Publication types