

Hyperosmolality in CHO cell culture: effects on the proteome
- PMID: 35312825
- PMCID: PMC8990941
- DOI: 10.1007/s00253-022-11861-x
Hyperosmolality in CHO cell culture: effects on the proteome
Abstract
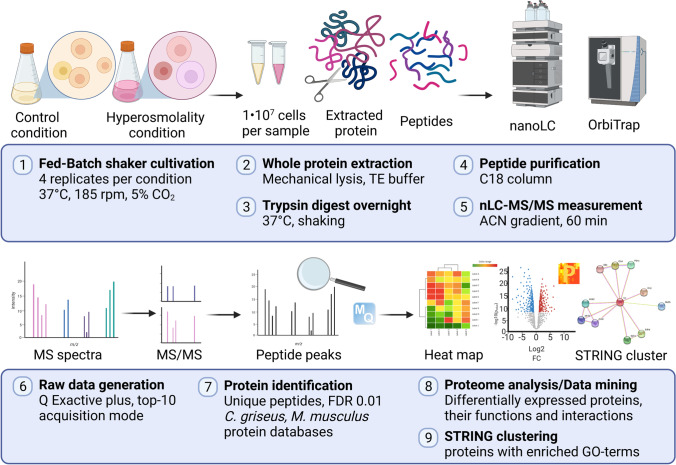
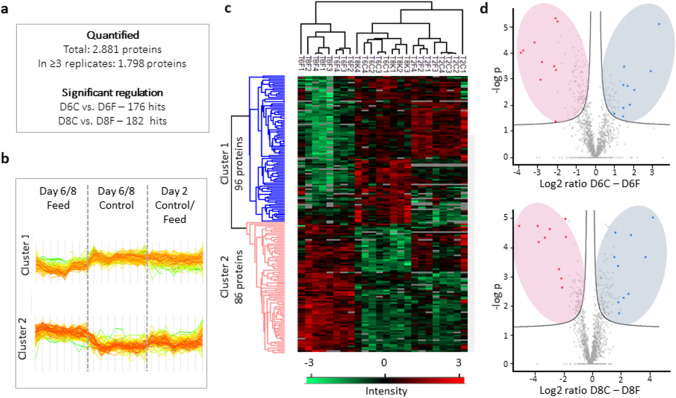
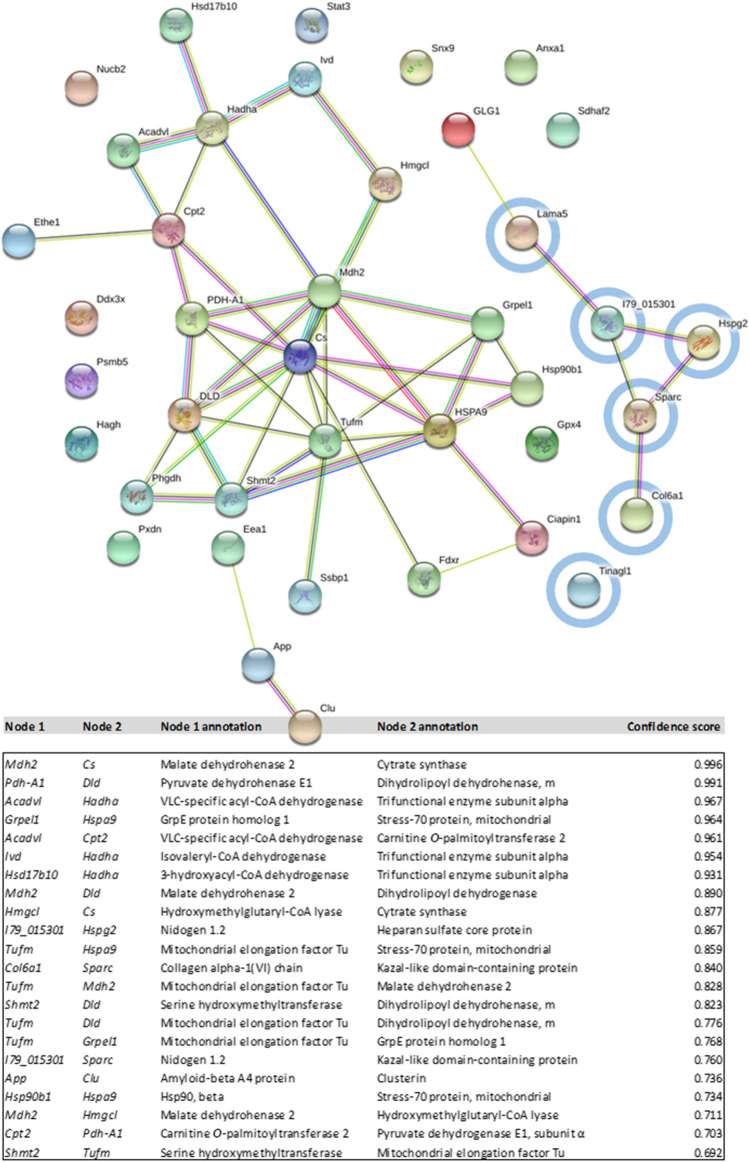
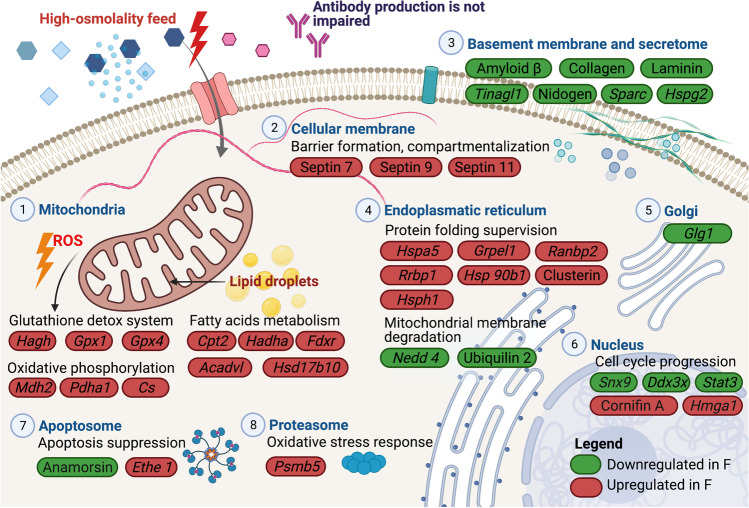
Chinese hamster ovary (CHO) cells are the most commonly used host cell lines for therapeutic protein production. Exposure of these cells to highly concentrated feed solution during fed-batch cultivation can lead to a non-physiological increase in osmolality (> 300 mOsm/kg) that affects cell physiology, morphology, and proteome. As addressed in previous studies (and indeed, as recently addressed in our research), hyperosmolalities of up to 545 mOsm/kg force cells to abort proliferation and gradually increase their volume-almost tripling it. At the same time, CHO cells also show a significant hyperosmolality-dependent increase in mitochondrial activity. To gain deeper insight into the molecular mechanisms that are involved in these processes, as detailed in this paper, we performed a comparative quantitative label-free proteome study of hyperosmolality-exposed CHO cells compared with control cells. Our analysis revealed differentially expressed key proteins that mediate mitochondrial activation, oxidative stress amelioration, and cell cycle progression. Our studies also demonstrate a previously unknown effect: the strong regulation of proteins can alter both cell membrane stiffness and permeability. For example, we observed that three types of septins (filamentous proteins that form diffusion barriers in the cell) became strongly up-regulated in response to hyperosmolality in the experimental setup. Overall, these new observations correlate well with recent CHO-based fluxome and transcriptome studies, and reveal additional unknown proteins involved in the response to hyperosmotic pressure by over-concentrated feed in mammalian cells.Key points• First-time comparative proteome analysis of CHO cells exposed to over-concentrated feed.• Discovery of membrane barrier-forming proteins up-regulation under hyperosmolality.• Description of mitochondrial and protein chaperones activation in treated cells.
Keywords: CHO; Cell size; Fed-batch; Hyperosmolality; LFQ proteomics.
© 2022. The Author(s).
Conflict of interest statement
The authors declare no competing interests.
Figures
Similar articles
-
Single-Cell Analysis of CHO Cells Reveals Clonal Heterogeneity in Hyperosmolality-Induced Stress Response.Cells. 2022 May 27;11(11):1763. doi: 10.3390/cells11111763. Cells. 2022. PMID: 35681457 Free PMC article.
-
Hyperosmolality in CHO culture: Effects on cellular behavior and morphology.Biotechnol Bioeng. 2021 Jun;118(6):2348-2359. doi: 10.1002/bit.27747. Epub 2021 Mar 27. Biotechnol Bioeng. 2021. PMID: 33751545
-
The effect of hyperosmolality application time on production, quality, and biopotency of monoclonal antibodies produced in CHO cell fed-batch and perfusion cultures.Appl Microbiol Biotechnol. 2019 Feb;103(3):1217-1229. doi: 10.1007/s00253-018-9555-7. Epub 2018 Dec 15. Appl Microbiol Biotechnol. 2019. PMID: 30554388
-
Cell engineering and cultivation of chinese hamster ovary (CHO) cells.Curr Pharm Biotechnol. 2010 Apr;11(3):233-40. doi: 10.2174/138920110791111960. Curr Pharm Biotechnol. 2010. PMID: 20210750 Review.
-
The emerging role of cellular post-translational modifications in modulating growth and productivity of recombinant Chinese hamster ovary cells.Biotechnol Adv. 2021 Jul-Aug;49:107757. doi: 10.1016/j.biotechadv.2021.107757. Epub 2021 Apr 22. Biotechnol Adv. 2021. PMID: 33895332 Review.
Cited by
-
Single-Cell Analysis of CHO Cells Reveals Clonal Heterogeneity in Hyperosmolality-Induced Stress Response.Cells. 2022 May 27;11(11):1763. doi: 10.3390/cells11111763. Cells. 2022. PMID: 35681457 Free PMC article.
-
Systems Biology of Recombinant 2G12 and 353/11 mAb Production in CHO-K1 Cell Lines at Phosphoproteome Level.Proteomes. 2025 Feb 10;13(1):9. doi: 10.3390/proteomes13010009. Proteomes. 2025. PMID: 39982319 Free PMC article.
-
Effects of process intensification on homogeneity of an IgG1:κ monoclonal antibody during perfusion culture.Appl Microbiol Biotechnol. 2024 Mar 26;108(1):274. doi: 10.1007/s00253-024-13110-9. Appl Microbiol Biotechnol. 2024. PMID: 38530495 Free PMC article.
-
Quantitative proteomics reveals cellular responses to individual mAb expression and tunicamycin in CHO cells.Appl Microbiol Biotechnol. 2024 Jun 19;108(1):381. doi: 10.1007/s00253-024-13223-1. Appl Microbiol Biotechnol. 2024. PMID: 38896138 Free PMC article.
-
Recombinant therapeutic proteins degradation and overcoming strategies in CHO cells.Appl Microbiol Biotechnol. 2024 Jan 29;108(1):182. doi: 10.1007/s00253-024-13008-6. Appl Microbiol Biotechnol. 2024. PMID: 38285115 Free PMC article. Review.
References
-
- Baycin-Hizal D, Tabb DL, Chaerkady R, Chen L, Lewis NE, Nagarajan H, Sarkaria V, Kumar A, Wolozny D, Colao J, Jacobson E, Tian Y, O’Meally RN, Krag SS, Cole RN, Palsson BO, Zhang H, Betenbaugh M. Proteomic analysis of Chinese hamster ovary cells. J Proteome Res. 2012;11(11):5265–5276. doi: 10.1021/pr300476w. - DOI - PMC - PubMed
-
- Beber A (2018) Invitro study of membrane remodeling and curvature sensing at the micrometric scale by budding yeast septins. tel-02015522v2, Sorbonne Université Biological Physics [physics.bio-ph]., NNT:2018SORUS375.
-
- Bedoya-López A, Estrada K, Sanchez-Flores A, Ramrez OT, Altamirano C, Segovia L, Miranda-Rós J, Trujillo-Roldán MA, Valdez-Cruz NA. Effect of temperature downshift on the transcriptomic responses of Chinese hamster ovary cells using recombinant human tissue plasminogen activator production culture. PLoS ONE. 2016;11(3):e0151529–e0151529. doi: 10.1371/journal.pone.0151529. - DOI - PMC - PubMed
MeSH terms
Substances
LinkOut - more resources
Full Text Sources
Molecular Biology Databases
Research Materials
