. 2022 Mar 21;9(1):21.
doi: 10.1186/s40658-022-00447-1.

Precision dosimetry in yttrium-90 radioembolization through CT imaging of radiopaque microspheres in a rabbit liver model

Affiliations

Precision dosimetry in yttrium-90 radioembolization through CT imaging of radiopaque microspheres in a rabbit liver model

E Courtney Henry et al. EJNMMI Phys. .

Erratum in

Abstract

Purpose: To perform precision dosimetry in yttrium-90 radioembolization through CT imaging of radiopaque microspheres in a rabbit liver model and to compare extracted dose metrics to those produced from conventional PET-based dosimetry.

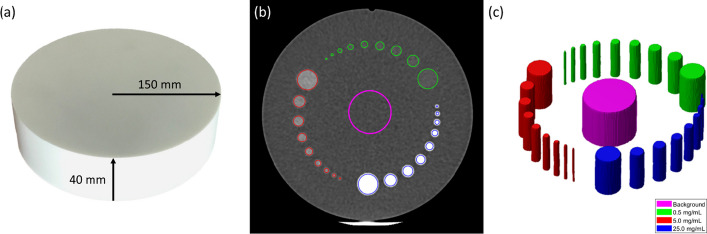
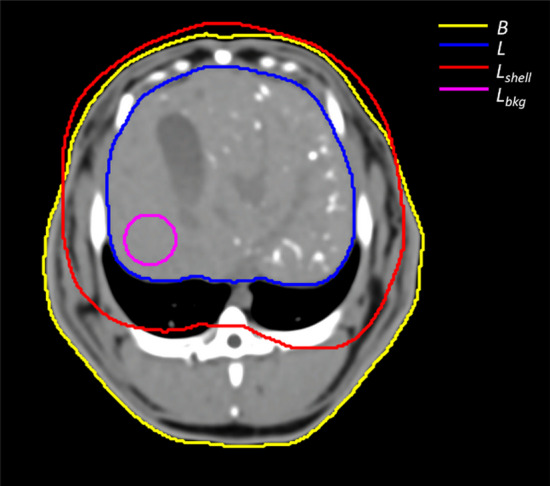
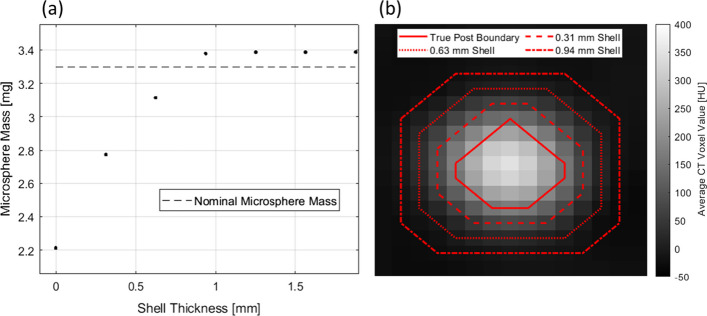
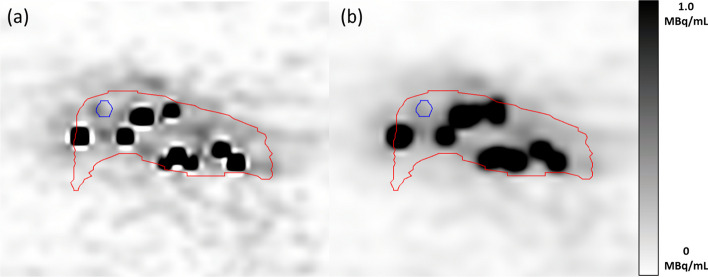
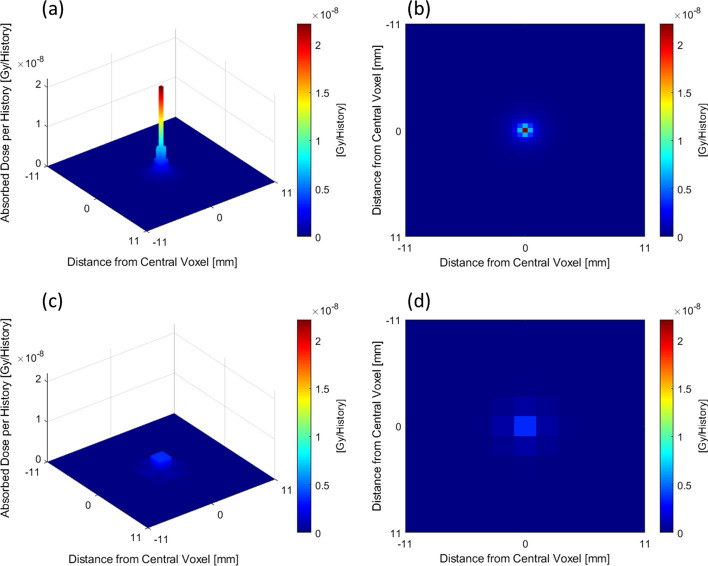
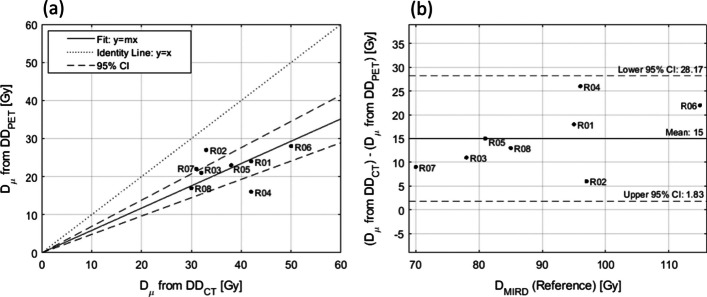
Materials and methods: A CT calibration phantom was designed containing posts with nominal microsphere concentrations of 0.5 mg/mL, 5.0 mg/mL, and 25.0 mg/mL. The mean Hounsfield unit was extracted from the post volumes to generate a calibration curve to relate Hounsfield units to microsphere concentration. A nominal bolus of 40 mg of microspheres was administered to the livers of eight rabbits, followed by PET/CT imaging. A CT-based activity distribution was calculated through the application of the calibration curve to the CT liver volume. Post-treatment dosimetry was performed through the convolution of yttrium-90 dose-voxel kernels and the PET- and CT-based cumulated activity distributions. The mean dose to the liver in PET- and CT-based dose distributions was compared through linear regression, ANOVA, and Bland-Altman analysis.

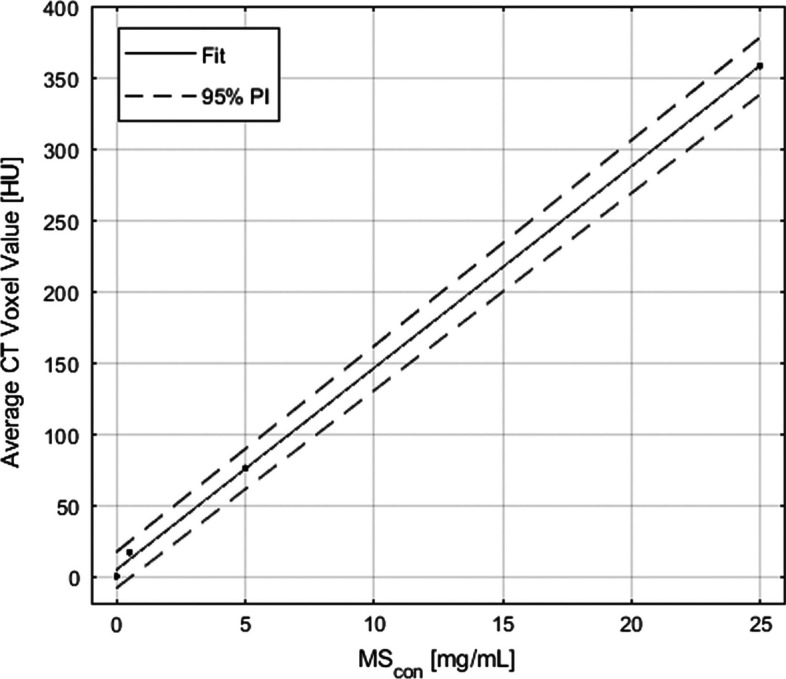
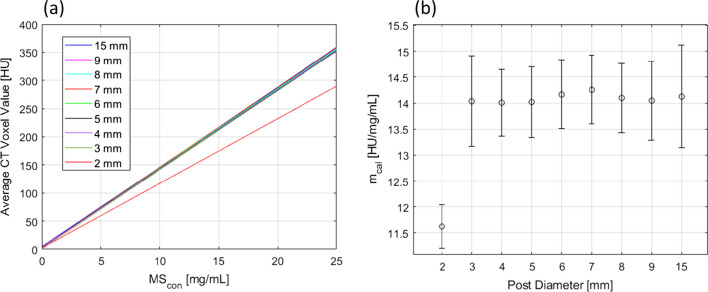
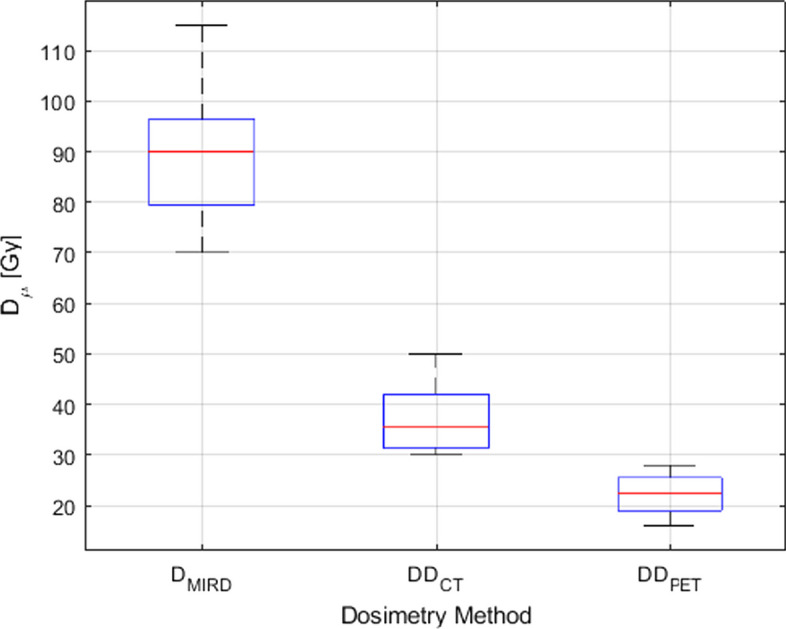
Results: A linear least-squares fit to the average Hounsfield unit and microsphere concentration data from the calibration phantom confirmed a strong correlation (r2 > 0.999) with a slope of 14.13 HU/mg/mL. A poor correlation was found between the mean dose derived from CT and PET (r2 = 0.374), while the ANOVA analysis revealed statistically significant differences (p < 10-12) between the MIRD-derived mean dose and the PET- and CT-derived mean dose. Bland-Altman analysis predicted an offset of 15.0 Gy between the mean dose in CT and PET. The dose within the liver was shown to be more heterogeneous in CT than in PET with an average coefficient of variation equal to 1.99 and 1.02, respectively.

Conclusion: The benefits of a CT-based approach to post-treatment dosimetry in yttrium-90 radioembolization include improved visualization of the dose distribution, reduced partial volume effects, a better representation of dose heterogeneity, and the mitigation of respiratory motion effects. Post-treatment CT imaging of radiopaque microspheres in yttrium-90 radioembolization provides the means to perform precision dosimetry and extract accurate dose metrics used to refine the understanding of the dose-response relationship, which could ultimately improve future patient outcomes.

Keywords: CT; Dosimetry; Microsphere; PET; Radioembolization; Radiopacity; Yttrium-90.


Conflict of interest statement

RA is a shareholder, cofounder, and Chief Medical Officer of ABK Biomedical. AS, ECH, ACG, and DL have provided consulting services to ABK Biomedical. JNB has received research support from ABK Biomedical. SCK has received research support from and served as a consultant for Boston Scientific, Sirtex Medical, and ABK Biomedical. DL has received research support from Boston Scientific and served as a consultant for Sirtex Medical and ABK Biomedical.

Figures

Fig. 1
Fig. 1
a Image of the calibration phantom overlaid with physical dimensions. b Axial CT slice [− 100 to 200 HU] of the calibration phantom with segmented structures for a background region (magenta) and three microsphere concentrations: 0.5 mg/mL (green), 5.0 mg/mL (red), and 25.0 mg/mL (blue). c Segmented structures in the calibration phantom
Fig. 2
Fig. 2
Baseline unenhanced axial CT slice [− 100 to 200 HU] of R03 following the administration of Eye90 showing four structures: the rabbit’s body B (yellow), the liver volume L (blue), the liver extended by an isotropic 1 cm margin Lshell (red), and the non-embolized, homogeneous background region Lbkg (magenta)
Fig. 3
Fig. 3
The average CT voxel value within post structures as a function of post diameter for the three microsphere concentrations within the CT calibration phantom: 0.5 mg/mL, 5.0 mg/mL, and 25.0 mg/mL. Error bars represent the standard deviation of the voxel values within a post
Fig. 4
Fig. 4
A calibration curve derived from the analysis of the calibration phantom. The coefficient of determination is r2 ≥ 0.999. Voxel values were extracted for the 15 mm-diameter posts only
Fig. 5
Fig. 5
a Calibration curves derived for all post sizes within the calibration phantom. b Calibration curve slope as a function of post diameter with error bars representing 95% confidence intervals
Fig. 6
Fig. 6
a The microsphere mass in the 2 mm-diameter post with a microsphere concentration of 25.0 mg/mL as a function of contour shell thickness. The nominal mass of Eye90 within the contour is represented by the dashed horizontal line. b Axial CT slice [− 50 to 400 HU] of the 2 mm-diameter post with a microsphere concentration of 25.0 mg/mL. The red contours represent extended shell thicknesses
Fig. 7
Fig. 7
Sagittal slices of the PET-based activity distribution APET a before filtering with a 4 mm FWHM Gaussian kernel, and b after filtering with a 4 mm FWHM Gaussian kernel. The red contour represents the liver volume L and the blue contour represents the circular ROI where the standard deviation of 90Y activity concentration values was measured. The concentration values are displayed with a range of 0–1.0 MBq/mL
Fig. 8
Fig. 8
a 3D surface plot through the central voxel in the CT dose-voxel kernel DVKCT. b 2D cross section through the central voxel in the CT dose-voxel kernel DVKCT. c 3D surface plot through the central voxel in the PET dose-voxel kernel DVKPET. d 2D cross section through the central voxel in the PET dose-voxel kernel DVKPET. The maximum value in all vertical axes and colour bars corresponds to the maximum value of DVKCT
Fig. 9
Fig. 9
ac Axial, sagittal, and coronal views of the CT-based dose distribution DDCT in R05 overlaid on an axial CT [− 100 to 200 HU]. d–f Axial, sagittal, and coronal views of the PET-based dose distribution DDPET in R05 overlaid on an axial CT [− 100 to 200 HU]
Fig. 10
Fig. 10
ac Axial, sagittal, and coronal views of the CT-based dose distribution DDCT in R06 overlaid on an axial CT [-100 to 200 HU]. df Axial, sagittal, and coronal views of the PET-based dose distribution DDPET in R06 overlaid on an axial CT [− 100 to 200 HU]
Fig. 11
Fig. 11
a Linear regression analysis with 95% confidence intervals (dashed) and identity line (dotted) for the mean dose Dμ in the CT-based dose distribution DDCT and in the PET-based dose distribution DDPET. b Bland–Altman analysis with 95% confidence intervals (dashed)
Fig. 12
Fig. 12
Box-and-whisker plot for the mean dose Dμ across all rabbits extracted from the CT-based dose distribution DDCT, the PET-based dose distribution DDPET, and DDMRD. The red line represents the median value, the blue box contains data between the 25th and 75th percentiles, and the black whiskers extend to the most extreme data points
Fig. 13
Fig. 13
Cumulative dose volume histograms (cDVHs) for the liver volumes L and Lshell across all rabbits

References

    1. Bray F, Ferlay J, Soerjomataram I, Siegel RL, Torre LA, Jemal A. Global cancer statistics 2018: GLOBOCAN estimates of incidence and mortality worldwide for 36 cancers in 185 countries. CA Cancer J Clin. 2018;68(6):394–424. doi: 10.3322/caac.21492. - DOI - PubMed
    1. Torre LA, Bray F, Siegel RL, Ferlay J, Lortet-Tieulent J, Jemal A. Global cancer statistics, 2012. CA Cancer J Clin. 2015;65(2):87–108. - PubMed
    1. Rognoni C, Ciani O, Sommariva S, Facciorusso A, Tarricone R, Bhoori S, et al. Trans-arterial radioembolization in intermediate-advanced hepatocellular carcinoma: systematic review and meta-analyses. Oncotarget. 2016;7(44):72343. - PMC - PubMed
    1. Maluccio M, Covey A. Recent progress in understanding, diagnosing, and treating hepatocellular carcinoma. CA Cancer J Clin. 2012;62(6):394–399. - PubMed
    1. Moreno-Luna LE, Yang JD, Sanchez W, Paz-Fumagalli R, Harnois DM, Mettler TA, et al. Efficacy and safety of transarterial radioembolization versus chemoembolization in patients with hepatocellular carcinoma. Cardiovasc Intervent Radiol. 2013;36(3):714–723. - PMC - PubMed

LinkOut - more resources