. 2022 Oct;76(4):1190-1202.
doi: 10.1002/hep.32470. Epub 2022 May 19.

A pan-genotype hepatitis C virus viral vector vaccine generates T cells and neutralizing antibodies in mice

Affiliations

A pan-genotype hepatitis C virus viral vector vaccine generates T cells and neutralizing antibodies in mice

Timothy Donnison et al. Hepatology. 2022 Oct.

Abstract

Background and aims: A prophylactic vaccine targeting multiple HCV genotypes (gt) is urgently required to meet World Health Organization elimination targets. Neutralizing antibodies (nAbs) and CD4+ and CD8+ T cells are associated with spontaneous clearance of HCV, and each may contribute to protective immunity. However, current vaccine candidates generate either nAbs or T cells targeting genetically variable epitopes and have failed to show efficacy in human trials. We have previously shown that a simian adenovirus vector (ChAdOx1) encoding conserved sequences across gt1-6 (ChAd-Gt1-6), and separately gt-1a E2 protein with variable regions deleted (E2Δ123HMW ), generates pan-genotypic T cells and nAbs, respectively. We now aim to develop a vaccine to generate both viral-specific B- and T-cell responses concurrently.

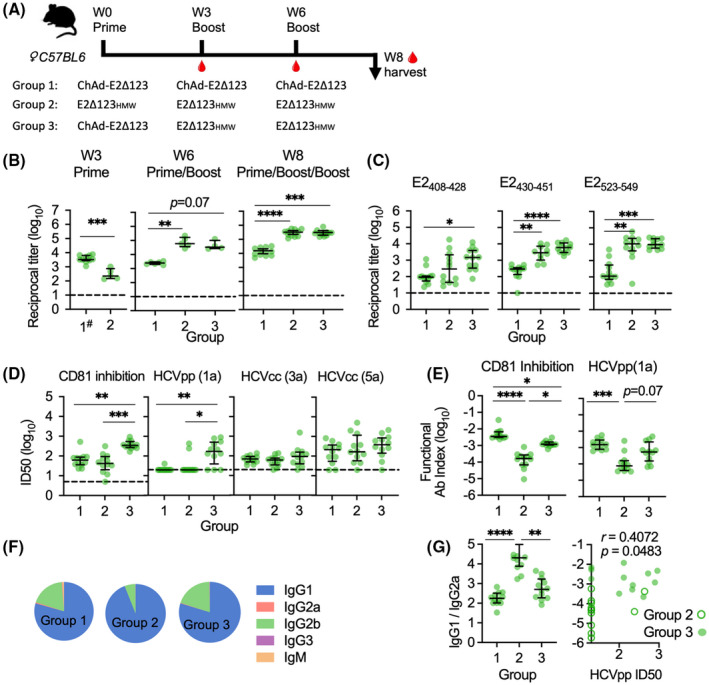
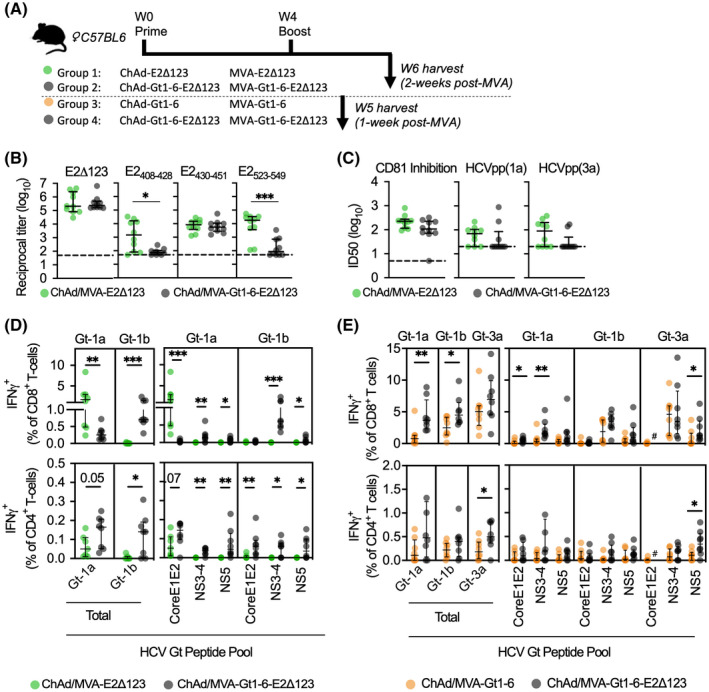
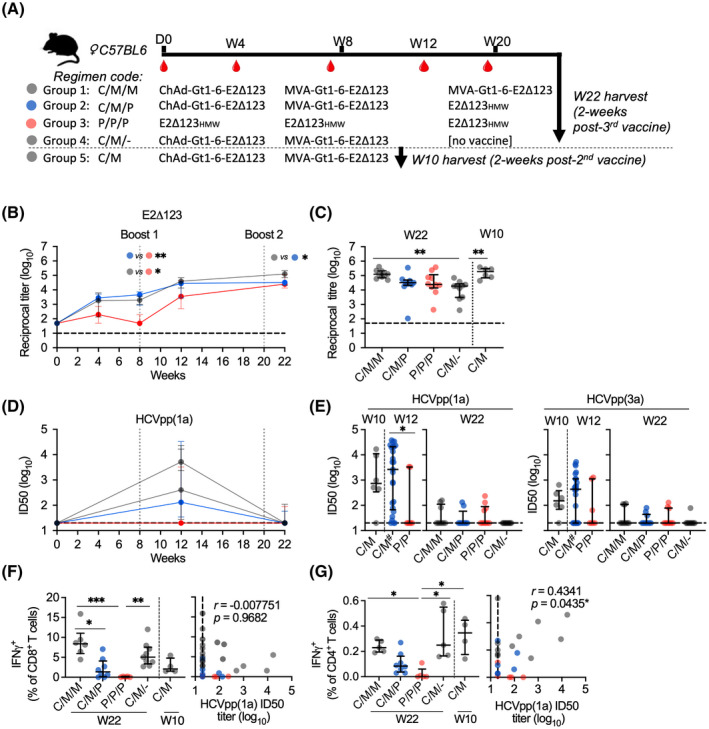
Approach and results: We show that vaccinating with ChAd-Gt1-6 and E2Δ123HMW sequentially in mice generates T-cell and antibody (Ab) responses comparable to either vaccine given alone. We encoded E2Δ123 in ChAdOx1 (ChAd-E2Δ123) and show that this, given with an E2Δ123HMW protein boost, induces greater CD81-E2 inhibitory and HCV-pseudoparticle nAb titers compared to the E2Δ123HMW prime boost. We developed bivalent viral vector vaccines (ChAdOx1 and modified vaccinia Ankara [MVA]) encoding both Gt1-6 and E2Δ123 immunogens (Gt1-6-E2Δ123) generating polyfunctional CD4+ and CD8+ T cells and nAb titers in prime/boost strategies. This approach generated nAb responses comparable to monovalent E2Δ123 ChAd/MVA vaccines and superior to three doses of recombinant E2Δ123HMW protein, while also generating high-magnitude T-cell responses.

Conclusions: These data are an important step forward for the development of a pan-genotype HCV vaccine to elicit T cells and nAbs for future assessment in humans.


Conflict of interest statement

T.D., S.C., and E.B. are all contributors or inventors on patent PCT/GB2017/050840 that describes the conserved segment HCV Gt1‐6 T‐cell vaccine used in this study. H.D. and P.P. are named inventors on patents PCT/AU2007/001221 and PCT/AU2011/001534 that describe E2 antigens used in this study. H.D., E.B., and S.C. are named inventors of PCT/AU2021/050437.

Figures

FIGURE 1
FIGURE 1
Immunogenicity of an E2Δ123 protein sequence encoded in a ChAdOx1 prime vaccine. (A) Groups of 12 age‐matched female C57BL/6 mice were vaccinated with a prime vaccine at day 0, a boost vaccine at week 3 (W3), and another boost vaccine at week 6 (W6), followed by a terminal bleed at week 8 (W8). Group 1 had three sequential ChAd‐E2Δ123 vaccinations; group 2: three sequential E2Δ123HMW protein vaccinations; and group 3, a ChAd‐E2Δ123 prime followed by two sequential E2Δ123HMW protein boosts. ChAd‐E2Δ123 was given i.m. in the left quadricep at 108 infectious units (IU) in 40 μL sterile PBS. E2Δ123HMW (20 μg) was mixed 1:1 with 50 μL of Addavax® adjuvant and administered s.c. in the scruff ofthe neck. (B) Sera was collected at week 3 (preboost 1; hash indicates pooled groups 1 and 3), week 6 (preboost 2), and at week 8 (end of study; EOS) to determine the Ab titers’ capacity to bind gt‐1a E2Δ123 monomer in an ELISA. (C) Immune sera’s (W8, EOS) capacity to bind CD81 binding determinants: AS412 (E2408‐428); AS434 (E2430‐451); and CD81 binding loop (E2523‐549). ELISA Ab titers were measured at 10 times background (BSA), using dilution curves, and are plotted as log reciprocal titers. (D) EOS immune sera titers that inhibit 50% (ID50) of: E2 binding to CD81; neutralizing HCV gt‐1a HCVpp; and HCV gt‐3a and ‐5a HCVcc virion entry into Huh7.5 cells. ID50 inhibitory titers were determined using a dilution curve where the vaccine‐induced Ab response was background subtracted and standardized to a negative control, which displayed 100% binding/entry (e.g., BSA, instead of immune sera, incubated with E2 or HCVpp/cc before determining CD81 binding or cell infectivity). (E) ID50 inhibitory titer of immune sera as a function of the overall Ab titer, displayed as Ab titer divided by ID50 titer. (F) EOS E2‐specific Ab isotype titers are displayed as a fraction of the total Ab titer (median pie base). (G) IgG2a titer of immune sera was calculated as a function of the IgG1 titer and is displayed as IgG1 titer divided by IgG2a titer (IgG1/IgG2a). The lower the titer, the closer the IgG2a to IgG1 ratio is to 1:1, indicative of IgG1 to IgG2a class switching. The reciprocal titer (1/IgG1:IgG2a) was plotted against the HCVpp ID50 titer for immune sera from animals that received C/P/P and P/P/P to determine any correlation. All bars are medians, and interquartile ranges are displayed. For Panel B–D, the dashed line is the cutoff for detectable responses. The D’Agostino and Pearson test was used to determine normality of data distribution, and Mann‐Whitney U tests were performed to determine significant differences between two group medians at a 95% CI (Kruskal‐Wallis test for multiple groups). p values indicate a significant difference between groups when: *p < 0.05; **p < 0.01; ***p < 0.001; ****p < 0.0001
FIGURE 2
FIGURE 2
Immunogenicity of a bivalent HCV vaccine immunogen (Gt1‐6‐E2Δ123) compared to monovalent immunogens, Gt1‐6 and E2Δ123, in a ChAdOx1 prime, MVA boost regimen. Two experiments—each consisting of two groups of age‐matched female C57BL/6 mice (n = 10)—were conducted. (A) The first experiment consisted of a week 0 ChAd‐E2Δ123 prime (108 infectious units [IU] in 40 μL of sterile PBS) followed by a week 4 MVA‐E2Δ123 (107 plaque‐forming units [PFU] in 40 μL of sterile PBS group 1, green dots) versus a week 0 ChAd‐Gt1‐6‐E2Δ123 prime followed by a week 4 MVA‐Gt1‐6‐E2Δ123 (group 2, gray dots), all with Abs and splenic T cells analyzed at week 6 (week 2 post‐MVA). The second experiment compared the peak T‐cell response (week 1 post‐MVA, i.e., week 5 post‐ChAd) of a ChAd‐Gt1‐6 prime followed by an MVA‐Gt1‐6 (group 3, orange dots) versus a week 0 ChAd‐Gt1‐6‐E2Δ123 prime followed by a week 4 MVA‐Gt1‐6‐E2Δ123 (group 4, gray dots). In both experiments, ChAd and MVA vaccines were delivered via i.m. at 108 infectious units and 107 plaque‐forming units, respectively, in the left quadricep. (B) Group 1 and 2 immune sera were assessed for reactivity to E2Δ123 monomer and AS412 (E2408‐428), AS434 (E2430‐451), CD81 binding loop (E2523‐549), and (C) capacity to inhibit 50% of the binding of CD81 to E2 binding and neutralization of gt‐1a HCVpp virion entry into Huh7.5 cells. ID50 inhibitory titers were determined using a dilution curve where the vaccine‐induced Ab response was background subtracted and standardized to a negative control, which displayed 100% binding/entry (e.g., BSA, instead of immune sera, incubated with E2 or HCVpp before determining CD81 binding or cell infectivity). (D,E) Group 1 and 2 splenocytes were harvested at week 6 (D) and group 3 and 4 splenocytes at week 5 (E) and all stimulated ex vivo using HCV peptides (15 mer overlapping by 11 aa) covering the length of the HCV proteome (total) and for peptide pools: Core‐E1‐E2, NS3‐4, and NS5, for gt‐1a (H77), ‐1b (J4), or ‐3a (k3a650). IFNγ+ CD8+ and CD4+ T‐cell frequencies as a percentage of total CD8+ or CD4+ T‐cell frequencies were determined by intracellular cytokine staining and flow cytometry. All data are plotted as medians and interquartile ranges. For panel B and C, the dashed line is the cutoff for detectable responses. The D’Agostino and Pearson test was used to determine the normality of data distribution, and Mann‐Whitney U tests were performed to determine significant differences between two group medians at a 95% CI. p values indicate a significant difference between groups when: *p < 0.05; **p < 0.01; ***p < 0.001; ****p < 0.0001. aa, amino acids
FIGURE 3
FIGURE 3
Assessment of mixed‐modality vaccination regimens using bivalent HCV vaccines and E2Δ123HMW protein vaccines. (A) Groups of 10 age‐matched female C57BL/6 mice were vaccinated with a prime vaccine at day 0, a boost vaccine at week 8 (W8), and another boost vaccine at week 20 (W20), followed by a terminal bleed at week 22 (W22), 2 weeks after the last vaccination. ChAd‐Gt1‐6‐E2Δ123 was delivered via i.m. in the left quadricep at 108 infectious units in 40 μL of sterile PBS, MVA was delivered via i.m. in the left quadricep at 107 plaque‐forming units in 40 μL of sterile PBS, and E2Δ123HMW (20 μg) was mixed 1:1 with 50 μL of AddaVax™ adjuvant and administered s.c. in the scruff of the neck. (B) Longitudinal ELISA assay analysis of immune sera collected at weeks 4, 8, 12, and 22 and plotted as Ab titer (log10) specific for the E2Δ123 monomer. (C) Comparison of week 10 and 22 ELISA assays between groups. (D) Longitudinal HCVpp (gt‐1a) assay analysis of immune sera collected at weeks 12 and 22 and plotted as ID50 (log10; dashed line is the cutoff for detectable responses). (E) Comparison of week 10, 12, and 22 HCVpp (gt‐1a and ‐3a) ID50 titers between groups. Hash indicates groups that were pooled together because of having the same vaccinations up until that point. (F,G) Splenocytes were harvested at week 22 and stimulated ex vivo using HCV peptides (15 mer overlapping by 11 aa) covering the length of the HCV proteome for gt‐1a (H77) and assessed by intracellular cytokine staining and flow cytometry to detect IFNγ+ CD8+ (F) and CD4+ (G) T cells and their correlation with their respective Ab titer in each animal. ICS data are plotted as a percentage of the parent group (live CD3+ CD4/8+). All data are plotted as medians and interquartile ranges. The D’Agostino and Pearson test was used to determine normality of data distribution, and Mann‐Whitney U tests were performed to determine significant differences between two group medians at a 95% CI (Kruskal‐Wallis test for multiple groups). p values indicate significant difference between groups when: *p < 0.05; **p < 0.01; ***p < 0.001; ****p < 0.0001. aa, amino acids
FIGURE 4
FIGURE 4
Summary of vaccination regimens. Comparison of 11 different vaccination regimens based on their immunogenicity, shown as a summary of presented data in Figures 1, 2, 3. Heatmap was generated using the median response for each assay. E2 antibody titer: titer of immune serum generated to bind soluble E2Δ123 monomer. Homologous neutralization titer: ID50 titer that neutralizes gt‐1a HCVpp. Cross‐neutralization titer: the ID50 titer to neutralize gt‐3a and ‐5a HCVcc. CD4+ and CD8+ T‐cell response: frequency of gt‐1a IFNγ+ CD4+ or CD8+ T cells as a percentage of total CD4+ or CD8+ T‐cell (CD3+) frequencies. T‐cell cross‐reactivity: the frequency of all non‐gt‐1a (i.e., gt‐1b and/or ‐3a) IFNγ+ CD4+ or CD8+ T cells as a percentage of total CD4+ or CD8+ T‐cell (CD3+) frequencies. The scale represents a low median response (pink) to high median response (red), with numbering to the right of the chart indicating the highest and lowest values for each analysis. Gray represents analysis that was not performed for that regimen. LOD, limit of detection

Comment in

References

    1. Hill AM, Nath S, Simmons B. The road to elimination of hepatitis C: analysis of cures versus new infections in 91 countries. J Virus Erad. 2017;3:117–23. - PMC - PubMed
    1. World Health Organization . Global Hepatitis Report 2017. Geneva, Switzerland: World Health Organization; 2017.
    1. Stone J, Martin NK, Hickman M, Hellard M, Scott N, McBryde E, et al. The potential impact of a hepatitis C vaccine for people who inject drugs: is a vaccine needed in the age of direct‐acting antivirals? PLoS One. 2016;11:e0156213. - PMC - PubMed
    1. Major M, Gutfraind A, Shekhtman L, Cui Q, Kachko A, Cotler SJ, et al. Modeling of patient virus titers suggests that availability of a vaccine could reduce hepatitis C virus transmission among injecting drug users. Sci Transl Med. 2018;10:eaao4496. - PMC - PubMed
    1. Scott N, McBryde E, Vickerman P, Martin NK, Stone J, Drummer H, et al. The role of a hepatitis C virus vaccine: modelling the benefits alongside direct‐acting antiviral treatments. BMC Med 2015;13:198. - PMC - PubMed

Publication types

LinkOut - more resources