. 2022 Jul;16(13):2585-2606.
doi: 10.1002/1878-0261.13212. Epub 2022 Apr 15.

DRP1 contributes to head and neck cancer progression and induces glycolysis through modulated FOXM1/MMP12 axis

Affiliations

DRP1 contributes to head and neck cancer progression and induces glycolysis through modulated FOXM1/MMP12 axis

Tai-Lin Huang et al. Mol Oncol. 2022 Jul.

Abstract

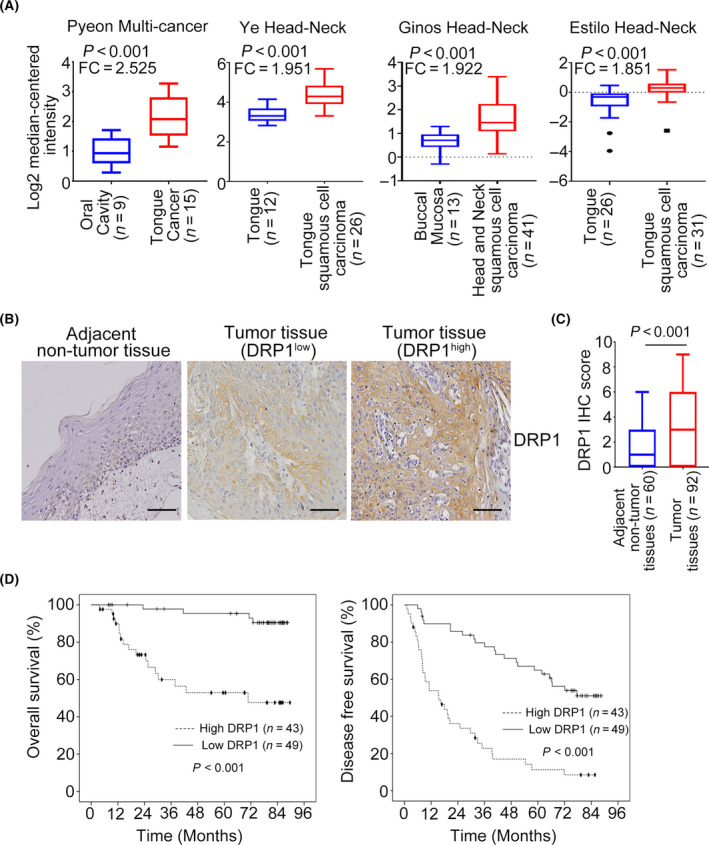
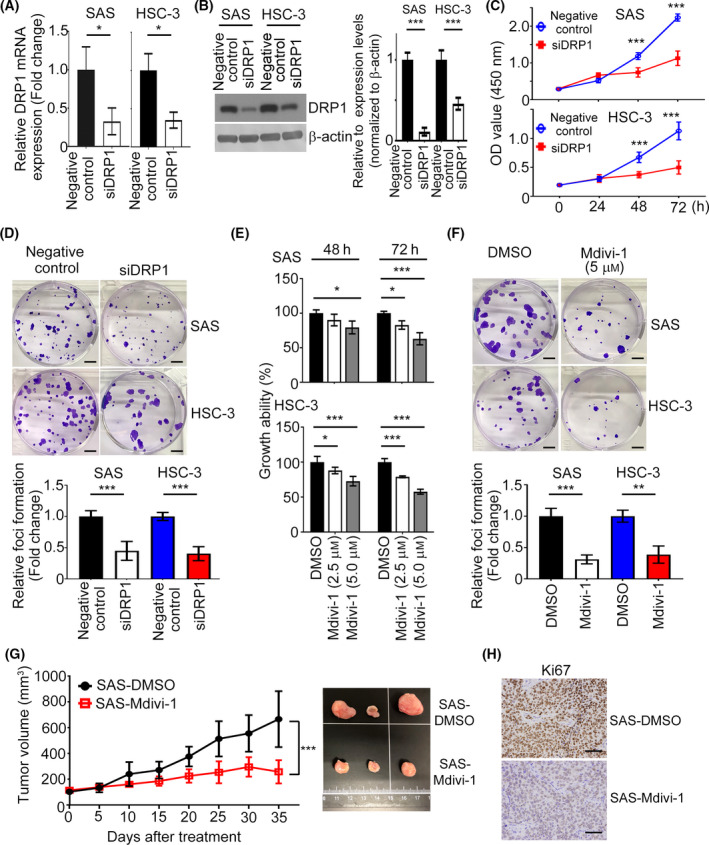
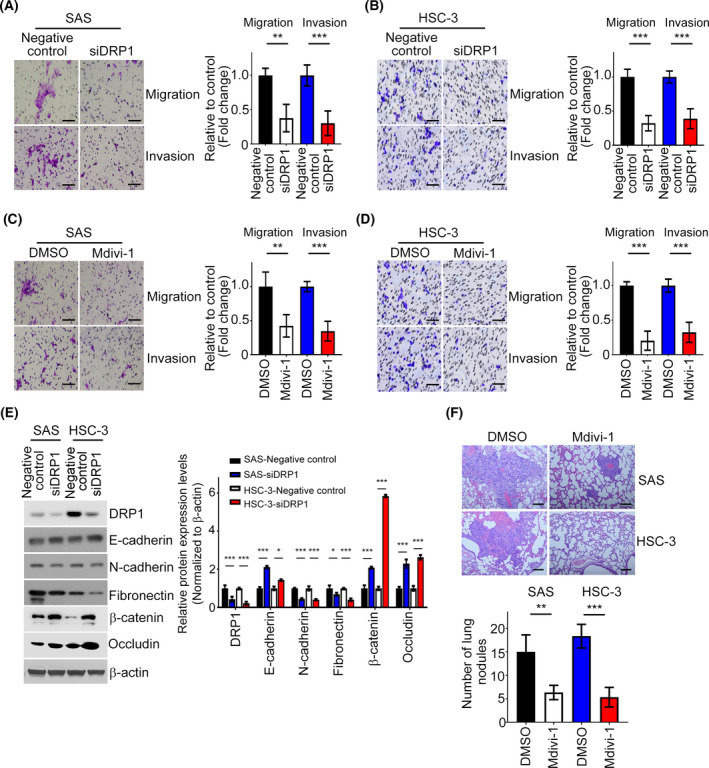
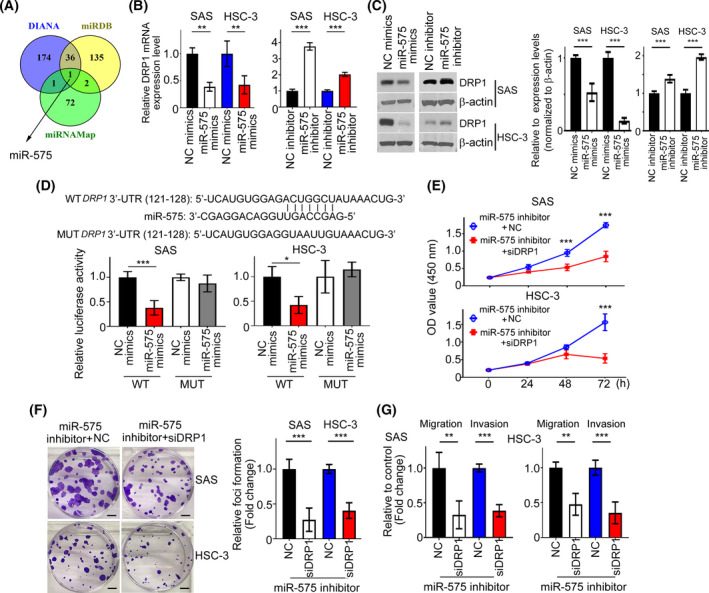
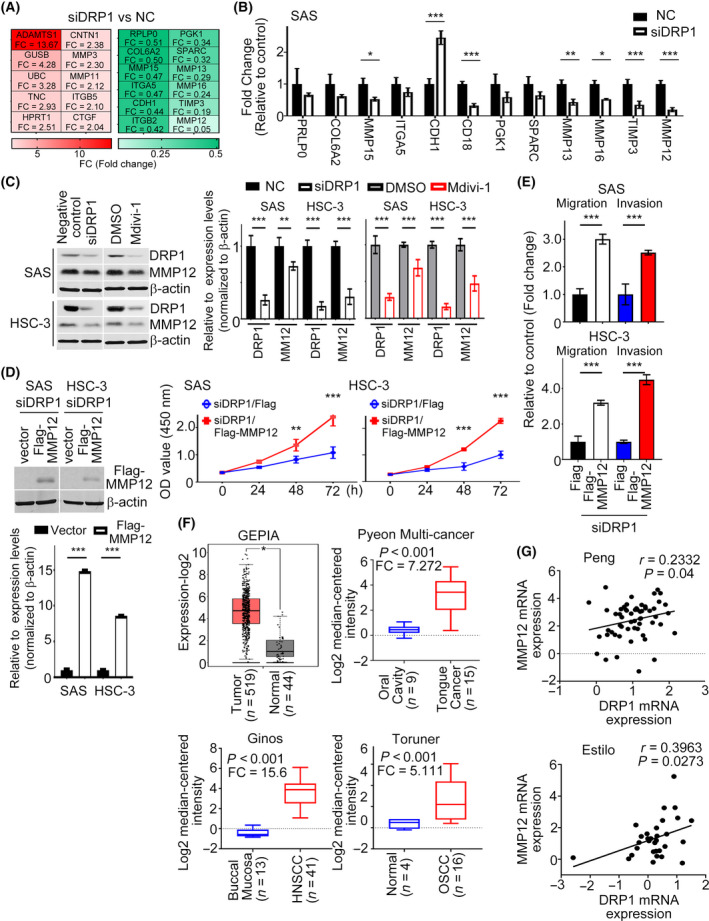
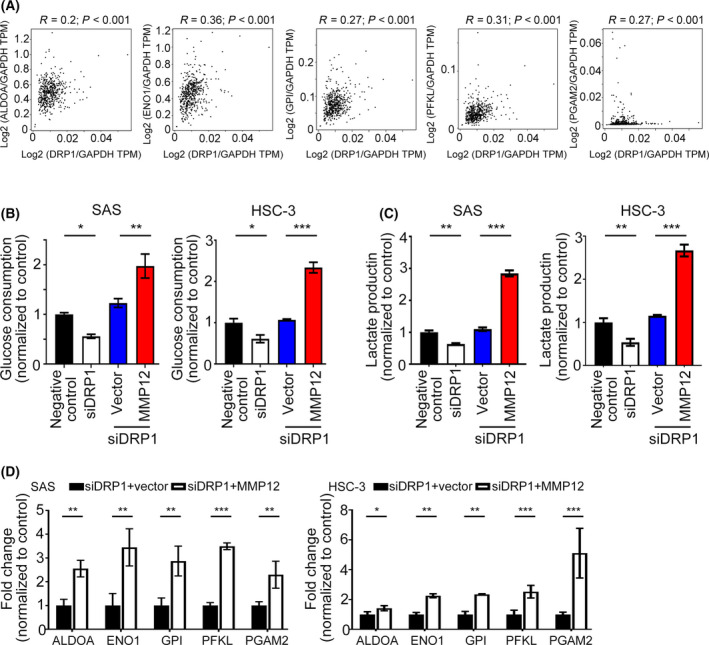
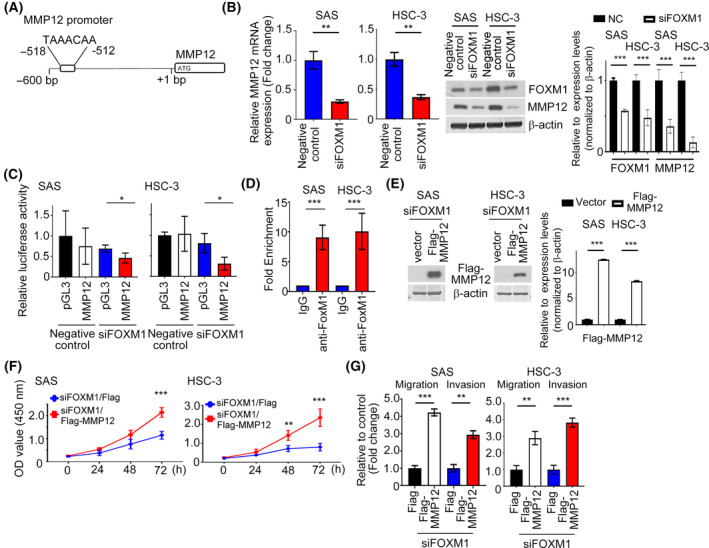
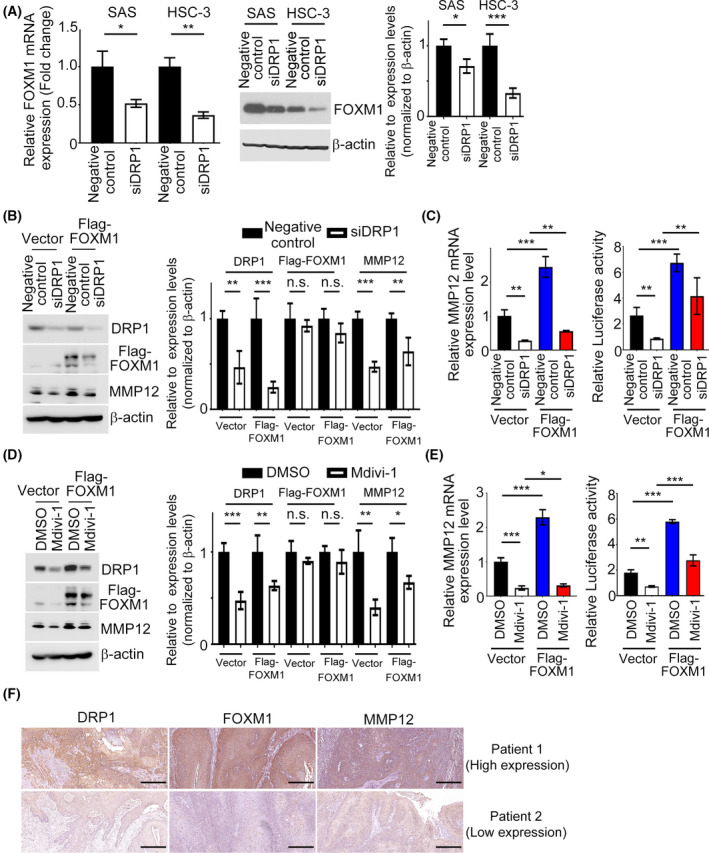
Abnormal DRP1 expression has been identified in a variety of human cancers. However, the prognostic potential and mechanistic role of DRP1 in head and neck cancer (HNC) are currently poorly understood. Here, we demonstrated a significant upregulation of DRP1 in HNC tissues, and that DRP1 expression correlates with poor survival of HNC patients. Diminished DRP1 expression suppressed tumor growth and metastasis in both in vitro and in vivo models. DRP1 expression was positively correlated with FOXM1 and MMP12 expression in HNC patient samples, suggesting pathological relevance in the context of HNC development. Moreover, DRP1 depletion affected aerobic glycolysis through the downregulation of glycolytic genes, and overexpression of MMP12 in DRP1-depleted cells could help restore glucose consumption and lactate production. Using ChIP-qPCR, we showed that DRP1 modulates FOXM1 expression, which can enhance MMP12 transcription by binding to its promoter. We also showed that miR-575 could target 3'UTR of DRP1 mRNA and suppress DRP1 expression. Collectively, our study provides mechanistic insights into the role of DRP1 in HNC and highlights the potential of targeting the miR-575/DRP1/FOXM1/MMP12 axis as a novel therapy for the prevention of HNC progression.

Keywords: DRP1; FOXM1; MMP12; glycolysis; head and neck cancer; miR-575.


Conflict of interest statement

The authors declare no conflicts of interest.

Figures

Fig. 1
Fig. 1
DRP1 expression is upregulated in HNC and is associated with poor outcomes. (A) The DRP1 mRNA expression in HNC samples from Oncomine datasets. Data are presented as mean  ±  SD. Significance is calculated using t‐test. (B) Representative images of immunohistochemical staining for DRP1 in adjacent nontumor tissues and tumor tissues of HNC. Scale bar: 100 µm. (C) Average staining scores for DRP1 expression in HNC tumor tissues and adjacent nontumor tissues. Data are presented as mean  ±  SD. Significance is calculated using unpaired t‐test. (D) DRP1 expression in overall and disease‐free survival was assessed in patients with HNC using Kaplan–Meier analyses. P‐values were determined using the log‐rank test.
Fig. 2
Fig. 2
Inhibition of DRP1 retards cell growth in HNC. (A,B) The mRNA and protein expression levels of DRP1 in both SAS and HSC‐3 cells were determined by QPCR and western blotting. Quantification of relative DRP1 expression is shown. (C, D) The effect of DRP1 on cell proliferation was examined by CCK8 and foci formation assays. Scale bar: 500 µm. (E, F) The impact of Mdivi‐1 on cell growth was determined by CCK8 and foci formation assays. Scale bar: 500 µm. (G) Cells stimulated with Mdivi‐1 and control groups were injected into the right flank of nude mice for 4 weeks; n = 5 per group. The tumor volumes were measured. (H) KI67 staining indicated cell growth in tumor cells. Scale bar: 50 µm. All data presented as mean  ±  SD of three independent experiments. Significance calculated in (A,B,D,F,G) using t‐test. Significance calculated in (C) and (E) using one‐way ANOVA followed by Tukey’s multiple comparison’s test. * P < 0.05, ** P < 0.01, *** P < 0.001.
Fig. 3
Fig. 3
DRP1 depletion restrains cell metastasis in HNC. (A, B) The Transwell assay was performed to examine the effect of DRP1 on cell migration and invasion in SAS and HSC‐3 cells. The representative images and the fold changes of cell migration and invasion are presented. Scale bar: 100 µm. (C, D) Migration and invasion assays of SAS and HSC‐3 cells treated with Mdivi‐1. The representative images and the fold changes of cell migration and invasion are presented. Scale bar: 100 µm. (E) DRP1, E‐cadherin, N‐cadherin, fibronectin, β‐catenin and Occludin protein expressions were determined in SAS/negative control, SAS/ siDRP1, HSC‐3/negative control, and HSC‐3/ siDRP1 by western blotting. (F) HE staining was performed to demonstrate the tumor nodule in the lungs; n = 4 per group. Representative images and statistical analyses are shown. Scale bar: 50 µm. All data are presented as mean  ±  SD of three independent experiments. Significance was calculated using t‐test. ** P < 0.01, *** P < 0.001.
Fig. 4
Fig. 4
DRP1 targeted by miR‐575. (A) A drawn Venn diagram was used to identify miRNA among three cohort profile datasets. (B) The mRNA expression profiles of DRP1 were determined by QPCR in SAS and HSC‐3 cells transfected with miR‐575 mimics or inhibitors. (C) SAS and HSC‐3 cells were transfected with miR‐575 mimics or inhibitor for 36 h. DRP1 protein was investigated by western blotting. Quantification of relative DRP1 expression was shown. (D) Luciferase reporter assays were performed to demonstrate the influence of miR‐575 on the activity of DRP1 mRNA 3’UTR. (E– G) Cells expressing miR‐575 inhibitor were transfected with siDRP1 or NC for 24 h. Cell proliferation, migration and invasion were examined by MTT, colony formation and Transwell assays. NC, negative control. Scale bar: 500 µm. All data are presented as mean  ±  SD of three independent experiments. Significance was calculated using t‐test. In (E), statistical analyses were performed using one‐way ANOVA followed by Tukey’s multiple comparison’s test. * P < 0.05, ** P < 0.01, *** P < 0.001.
Fig. 5
Fig. 5
MMP12 is one of the targets of DRP1 in HNC cells. (A) Heat‐map showing relative alteration of target genes belonging to EMT molecules using QPCR array analysis of SAS cell transfected with siDRP1 compared with the negative control. Red: upregulation; green: downregulation. (B) QPCR was analyzed to validate the expressions of target genes from (A). (C) Impact of DRP1 knockdown or Mdivi‐1 on MMP12 protein expression were demonstrated in SAS and HSC‐3 cells. Quantification of relative DRP1 and MMP12 expressions are shown. (D,E) Cell growth and motility were evaluated in DRP1‐depleted cells transfected with MMP12 using MTT and Transwell assays. Quantification of relative Flag‐MMP12 expression is shown. (F) Studies from GEPIA and Oncomine datasets present the increase of MMP12 mRNA in HNC samples. (G) A positive correlation between DRP1 mRNA and MMP12 mRNA was found in the Oncomine cohort (Peng database, n = 41; Estilo database, n = 31). All data are presented as mean  ±  SD of three independent experiments. Significance was calculated using t‐test. In (D) (cell growth) and (F) (GEPIA), statistical analyses were performed using one‐way ANOVA followed by Tukey’s multiple comparison’s test and Wilcoxon signed‐rank test, respectively. * P < 0.05, ** P < 0.01, *** P < 0.001.
Fig. 6
Fig. 6
DRP1 potentiates glycolysis in HNC cell that is required for MMP12. (A) The correlation between DRP1 and glycolytic molecules was assessed from the GEPIA database (n = 519). (B,C) Glucose consumption and lactate production were measured in siDRP1‐SAS and ‐HSC‐3 cells transfected with MMP12 or vector alone. (D) The transcriptional levels of glycolytic molecules were examined by QPCR in siDRP1‐SAS and ‐HSC‐3 cells transfected with MMP12 or vector alone. All data are presented as mean  ±  SD of three independent experiments. Significance calculated using t‐test. * P < 0.05, ** P < 0.01, *** P < 0.001.
Fig. 7
Fig. 7
FOXM1 regulates the expression and transcription activity of MMP12 in HNC cells. (A) Potential FOXM1 binding sites in human MMP12 promoter region. (B,C) QRT‐PCR, western blotting and luciferase assays indicating the expression and luciferase activity of MMP12 in FOXM1‐depleted HNC cells. Quantification of relative FOXM1 and MMP12 expressions are shown. (D) ChIP assays were performed to confirm the binding of FOXM1 to the MMP12 promoter in SAS and HSC‐3 cells using an anti‐FOXM1 antibody. Isotype IgGs were used as a negative control. (E) The protein expression level of MMP12 was investigated in FOXM1‐depleted cells transfected with Flag‐MMP12 by western blotting. Quantification of relative Flag‐MMP12 expression is shown. (F,G) The growth and motility of siFOXM1 with MMP12 overexpression in HNC transfectants was determined. All data are presented as mean  ±  SD of three independent experiments. Significance was calculated using t‐test. In (F), statistical analyses were performed using one‐way ANOVA followed by Tukey’s multiple comparison’s test. * P < 0.05, ** P < 0.01, *** P < 0.001.
Fig. 8
Fig. 8
MMP12 expression is essential for DRP1/FOXM1 regulation in HNC cells. (A) The mRNA and protein expression levels of FOXM1 in siDRP1 cells were examined. Quantification of relative FOXM1 expression is shown. (B,C) Western blotting, QPCR and luciferase activity analysis of MMP12 were determined in SAS cells transfected with FOXM1 or vector control in combination with siDRP1 or negative control. Quantification of relative DRP1, Flag‐FOXM1 and MMP12 expressions is shown. (D,E) Western blotting, QPCR and luciferase activity of MMP12 were analyzed in SAS cells transfected with FOXM1 or vector control in combination with Mdivi‐1 treatment. Quantification of relative DRP1, Flag‐FOXM1, and MMP12 expressions is shown. (F) IHC staining patterns of the HNC tumor tissues for DRP1, FOXM1 and MMP12. Scale bar: 100 µm. All data presented as mean  ±  SD of three independent experiments. Significance calculated using t‐test. * P < 0.05, ** P < 0.01, *** P < 0.001.

Similar articles

Cited by

References

    1. Bray F, Ferlay J, Soerjomataram I, Siegel RL, Torre LA, Jemal A. Global cancer statistics 2018: GLOBOCAN estimates of incidence and mortality worldwide for 36 cancers in 185 countries. CA Cancer J Clin. 2018;68:394–424. - PubMed
    1. Chow LQM. Head and neck cancer. N Engl J Med. 2020;382:60–72. - PubMed
    1. Siegel RL, Miller KD, Jemal A. Cancer statistics, 2018. Cancer J Clin. 2018;68:7–30. - PubMed
    1. Cancer Registry Annual Report, 2017. Taiwan.
    1. Wang HC, Chan LP, Cho SF. Targeting the immune microenvironment in the treatment of head and neck squamous cell carcinoma. Front Oncol. 2019;9:1084. - PMC - PubMed

Publication types