Randomized Controlled Trial
. 2022 Apr 18;145(2):517-530.
doi: 10.1093/brain/awab318.

Naming-related spectral responses predict neuropsychological outcome after epilepsy surgery

Affiliations
Randomized Controlled Trial

Naming-related spectral responses predict neuropsychological outcome after epilepsy surgery

Masaki Sonoda et al. Brain. .

Abstract

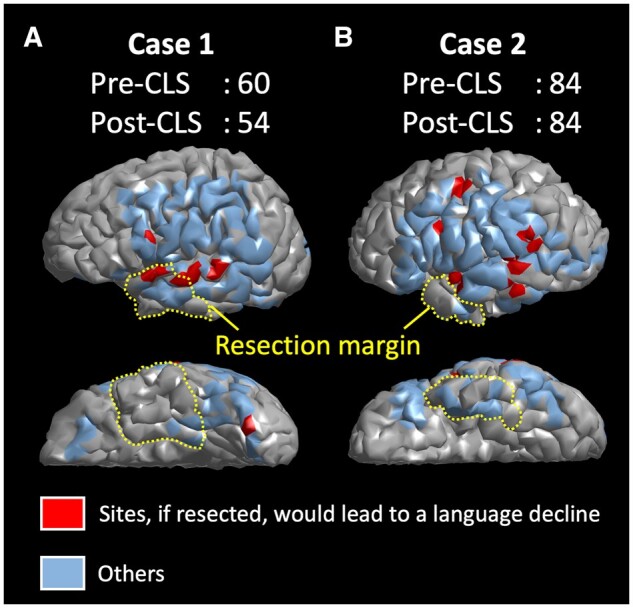
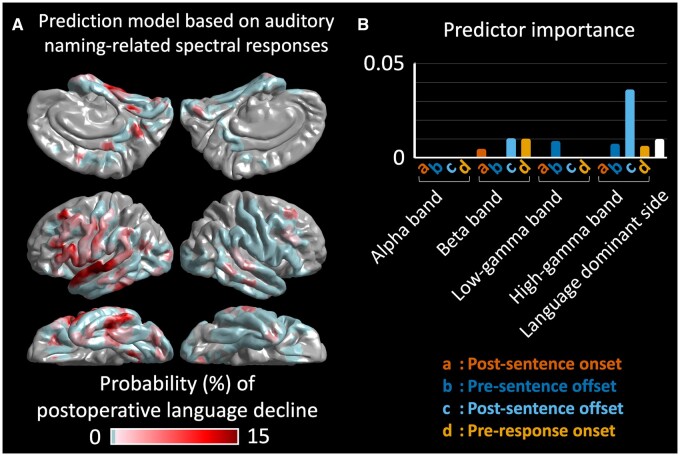
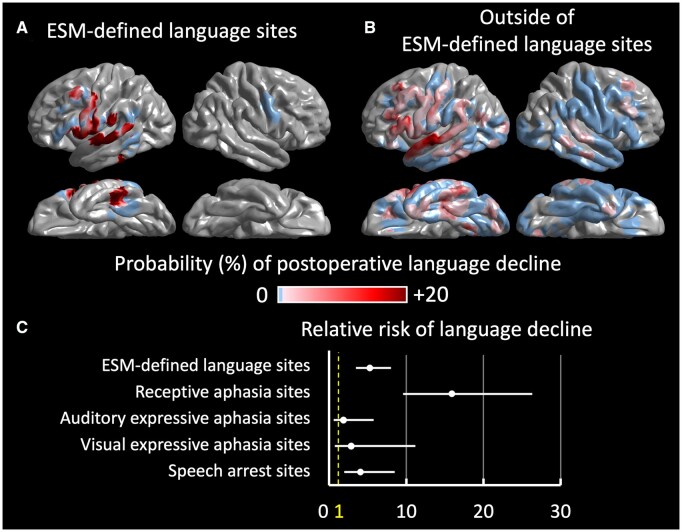
This prospective study determined the use of intracranially recorded spectral responses during naming tasks in predicting neuropsychological performance following epilepsy surgery. We recruited 65 patients with drug-resistant focal epilepsy who underwent preoperative neuropsychological assessment and intracranial EEG recording. The Clinical Evaluation of Language Fundamentals evaluated the baseline and postoperative language function. During extra-operative intracranial EEG recording, we assigned patients to undergo auditory and picture naming tasks. Time-frequency analysis determined the spatiotemporal characteristics of naming-related amplitude modulations, including high gamma augmentation at 70-110 Hz. We surgically removed the presumed epileptogenic zone based on the intracranial EEG and MRI abnormalities while maximally preserving the eloquent areas defined by electrical stimulation mapping. The multivariate regression model incorporating auditory naming-related high gamma augmentation predicted the postoperative changes in Core Language Score with r2 of 0.37 and in Expressive Language Index with r2 of 0.32. Independently of the effects of epilepsy and neuroimaging profiles, higher high gamma augmentation at the resected language-dominant hemispheric area predicted a more severe postoperative decline in Core Language Score and Expressive Language Index. Conversely, the model incorporating picture naming-related high gamma augmentation predicted the change in Receptive Language Index with an r2 of 0.50. Higher high gamma augmentation independently predicted a more severe postoperative decline in Receptive Language Index. Ancillary regression analysis indicated that naming-related low gamma augmentation and alpha/beta attenuation likewise independently predicted a more severe Core Language Score decline. The machine learning-based prediction model suggested that naming-related high gamma augmentation, among all spectral responses used as predictors, most strongly contributed to the improved prediction of patients showing a >5-point Core Language Score decline (reflecting the lower 25th percentile among patients). We generated the model-based atlas visualizing sites, which, if resected, would lead to such a language decline. With a 5-fold cross-validation procedure, the auditory naming-based model predicted patients who had such a postoperative language decline with an accuracy of 0.80. The model indicated that virtual resection of an electrical stimulation mapping-defined language site would have increased the relative risk of the Core Language Score decline by 5.28 (95% confidence interval: 3.47-8.02). Especially, that of an electrical stimulation mapping-defined receptive language site would have maximized it to 15.90 (95% confidence interval: 9.59-26.33). In summary, naming-related spectral responses predict neuropsychological outcomes after epilepsy surgery. We have provided our prediction model as an open-source material, which will indicate the postoperative language function of future patients and facilitate external validation at tertiary epilepsy centres.

Keywords: event-related high gamma augmentation; high-frequency oscillations (HFOs); intracranial electroencephalography (iEEG) recording; paediatric epilepsy surgery; ripples.


Figures

Figure 1
Figure 1
Distribution of intracranial electrodes. (A) The FreeSurfer surface image presents the distribution of artefact-free electrode sites included in the present study (6886 sites). Colour indicates the number of patients at each cortical point. (B) The distribution of sites assessed by electrical stimulation mapping (5203 sites).
Figure 2
Figure 2
Naming tasks and analysis periods of interest. (A) Auditory naming task. Each patient was instructed to verbally answer a brief sentence question (median duration of sentence stimuli: 1.8 s; range: 1.2–2.4 s). (B) Picture naming task. Each patient named an object presented on a monitor. Each 600-ms analysis period of interest is highlighted in colour and labelled as a to f.
Figure 3
Figure 3
Preprocessing to remove pathological components from time-frequency analysis. (A) Identification of randomly occurring spike discharges. We identified within-trial time-frequency bins showing a broadband (30–85 Hz) amplitude >2 SD from the across-trial mean (i.e. z-score of >2)., (B) Removal of bins including spike discharges. We treated such time-frequency bins including an excessive broadband amplitude as missing values (i.e. NaN: Not a Number). (C) Averaging of time-frequency bins across trials. We computed the averaged amplitude modulations (i.e. percentage change) as compared to that during the 400-ms baseline period prior to the stimulus onset. Here, the time-frequency matrices present auditory naming-related spectral responses time-locked to stimulus offset at four electrode sites. Top: Across-trial averaged data before bins including spike discharges excluded; several matrices exhibit episodes of brief broadband augmentation attributed to randomly occurring spike discharges. Bottom: Across-trial averaged data after excluding bins with spike discharges. In the present study, we adopted the time-frequency data presented in the lower row. Amplitude scale: 100% indicates no change in amplitude compared to the baseline, whereas 110 and 90% indicate 10% increase and decrease, respectively.
Figure 4
Figure 4
Naming-related high gamma augmentation and ESM. (A) The spatial distribution of auditory naming-related high gamma augmentation during each 600-ms analysis period of interest: a, post-sentence onset; b, pre-sentence offset; c, post-sentence offset and d, pre-response onset. (B) The distribution of picture naming-related high gamma augmentation: e, post-stimulus onset; f, pre-response onset. (C) The spatial distribution of the probability of ESM-induced symptoms, including receptive aphasia, auditory expressive aphasia, visual expressive aphasia and speech arrest. (D) The bar charts show the strength of correlation between modality-specific high gamma augmentation (at sites with a z-score of ≥2) and the probability of each ESM-induced symptom. *Positive correlation with a Bonferroni-adjusted P < 0.05.
Figure 5
Figure 5
Spatial relationship between cortical sites predicting postoperative cognitive decline and resection margin. The cortical surface in each individual 3D brain image is highlighted whether a given site, if resected, would result in a >5-point Core Language Score decline. A given model prediction (i.e. red: >5-point decline; blue: otherwise) was projected onto triangular meshes within a 5-mm radius of each electrode site. Postoperative cognitive outcome of each electrode site was predicted by the boosted tree ensemble model incorporating auditory naming-related iEEG amplitude variables in addition to the dominant hemisphere variable. The yellow dotted lines denote the resection margin in a given patient. (A) Case 1: The cortical sites predicted to result in a >5-point Core Language Score decline (coloured in red) were indeed resected, and the language decline was observed postoperatively. (B) Case 2: The cortical sites predicted to result in such a >5-point decline were preserved, and no language decline was observed.
Figure 6
Figure 6
Three-dimensional brain atlas visualizing the group-level probability of postoperative language decline. (A) The averaged surface image presents the group-level probability of a >5-point Core Language Score decline resulting from the virtual resection of a given cortical point. The group-level probability was computed with the boosted tree ensemble model incorporating auditory naming-related iEEG amplitude modulation variables in addition to a dominant hemisphere variable. The model predicted such a Core Language Score decline with an accuracy of 0.80 and area under the curve of 0.65. (B) Bar charts visualize the relative contribution of each variable to the prediction model providing the atlas.
Figure 7
Figure 7
Relative risk of language decline related to the virtual resection of ESM-defined language sites. The boosted tree ensemble model, incorporating auditory naming-related spectral responses, presents the group-level probability of a >5-point Core Language Score decline resulting from virtual resection of a given electrode site. (A) Virtual resection of an electrical stimulation mapping (ESM)-defined language site (i.e. cortical sites with ESM-induced receptive aphasia, auditory expressive aphasia, visual expressive aphasia or speech arrest). (B) Virtual resection of a site outside the ESM-defined language areas. (C) The relative risk (95% CI) of language decline related to the virtual resection of an ESM-defined language site, compared to that of a site outside.

References

    1. Rosenow F, Lüders H.. Presurgical evaluation of epilepsy. Brain. 2001;124(Pt 9):1683–1700. - PubMed
    1. So EL, Alwaki A.. A guide for cortical electrical stimulation mapping. J Clin Neurophysiol. 2018;35(2):98–105. - PubMed
    1. Hamberger MJ, Seidel WT, Mckhann GM, Perrine K, Goodman RR.. Brain stimulation reveals critical auditory naming cortex. Brain. 2005;128(Pt 11):2742–2749. - PubMed
    1. Tate MC, Herbet G, Moritz-Gasser S, Tate JE, Duffau H.. Probabilistic map of critical functional regions of the human cerebral cortex: Broca’s area revisited. Brain. 2014;137(Pt 10):2773–2782. - PubMed
    1. Ojemann G, Ojemann J, Lettich E, Berger M.. Cortical language localization in left, dominant hemisphere: An electrical stimulation mapping investigation in 117 patients. J Neurosurg. 1989;71(3):316–326. - PubMed

Publication types