[Preprint]. 2022 Mar 16:2022.03.15.484467.
doi: 10.1101/2022.03.15.484467.

A conserved immune trajectory of recovery in hospitalized COVID-19 patients

Affiliations

A conserved immune trajectory of recovery in hospitalized COVID-19 patients

Cassandra E Burnett et al. bioRxiv. .

Update in

Abstract

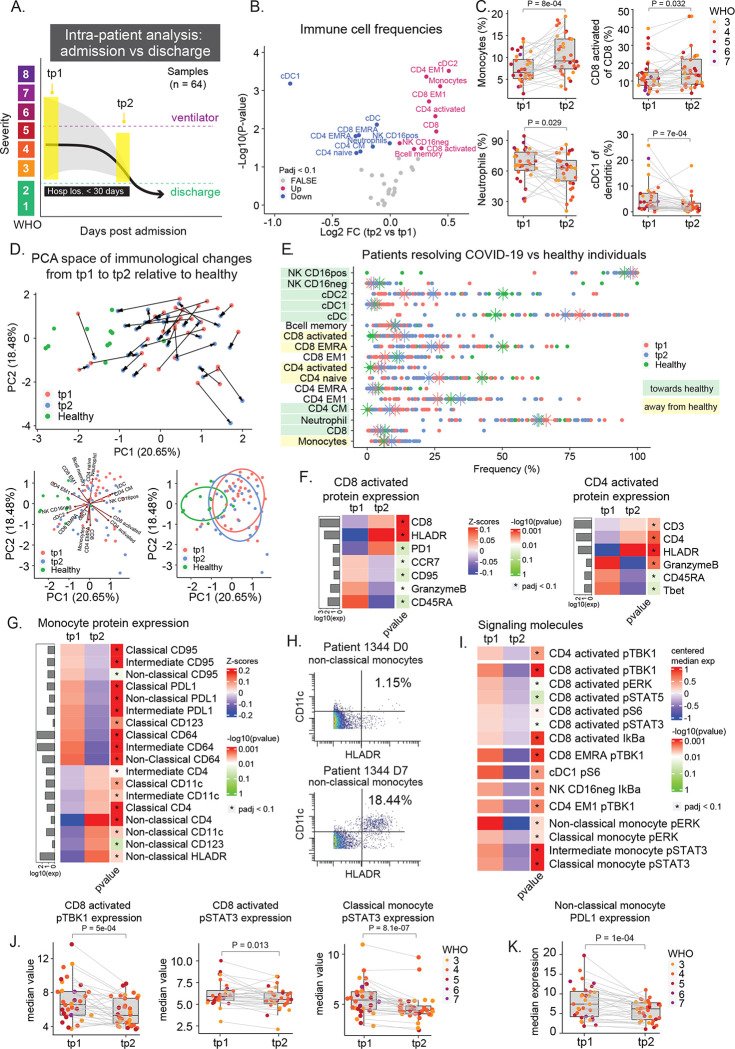
Many studies have provided insights into the immune response to COVID-19; however, little is known about the immunological changes and immune signaling occurring during COVID-19 resolution. Individual heterogeneity and variable disease resolution timelines obscure unifying immune characteristics. Here, we collected and profiled >200 longitudinal peripheral blood samples from patients hospitalized with COVID-19, with other respiratory infections, and healthy individuals, using mass cytometry to measure immune cells and signaling states at single cell resolution. COVID-19 patients showed a unique immune composition and an early, coordinated and elevated immune cell signaling profile, which correlated with early hospital discharge. Intra-patient time course analysis tied to clinically relevant events of recovery revealed a conserved set of immunological processes that accompany, and are unique to, disease resolution and discharge. This immunological process, together with additional changes in CD4 regulatory T cells and basophils, accompanies recovery from respiratory failure and is associated with better clinical outcomes at the time of admission. Our work elucidates the biological timeline of immune recovery from COVID-19 and provides insights into the fundamental processes of COVID-19 resolution in hospitalized patients.


Figures

Figure 1:
Figure 1:. COVID-19 immune phenotype and composition is highly divergent from healthy individuals and has unique features compared to other severe respiratory infections.
A) Overview of cohort. Patients were admitted to the hospital and enrolled in the study at D0. Peripheral blood samples were collected throughout the duration of stay. Corresponding clinical parameters and WHO scores were documented. 205 samples from 81 COVID-19 positive patients were included in the final cohort. Additionally, 14 samples from 7 COVID-19 negative patients with other respiratory diseases and 11 healthy individuals were included in the study. B) t-SNE plot of all patient samples at D0 (n = 83) using phenotypic markers colored by major immune cell populations. Upper right panel: t-SNE plot of healthy samples (n = 11); middle right panel: t-SNE plot of COVID-19 negative samples (n = 6); lower right panel: t-SNE plot of COVID-19 positive samples (n = 66). C) Immune cell population abundance at D0 in COVID-19 positive (+), COVID-19 negative (−) patients, and healthy individuals (H). P-values obtained by Wilcoxon Rank Sum Test, followed by Benjamini-Hochberg correction with FDR < 0.1. D) Correlation between cell population abundance at D0 and clinical outcomes, e.g. ventilation duration (vent_duration) and hospital length of stay (hosp_los) for COVID-19+ patients. Correlation estimates are obtained by Pearson correlation. E) Protein expression on neutrophils (F) in COVID-19 positive (COV+), COVID-19 negative (COV−) patients, and healthy controls at D0 (Wilcoxon Rank Sum Test, Benjamini-Hochberg correction with FDR < 0.1). F) Frequency of monocyte subsets in COVID-19 positive (COV+), COVID-19 negative (COV−) patients, and healthy controls at D0. P-values obtained by Wilcoxon Rank Sum Test.
Figure 2:
Figure 2:. Early coordinated immune signaling defines COVID-19 patients with high pSTAT3 and pSTAT6 associated with favorable clinical outcomes
A) Signaling schematic. Stars denote phosphorylated signaling molecules that are measured in the CyTOF panel. B) Expression of signaling molecules in CD45+ CD235a/b-negative peripheral blood immune cells at D0 in COVID-19 positive (+), COVID-19 negative (−) patients, and healthy individuals (H). P-values obtained by Wilcoxon Rank Sum Test, followed by Benjamini-Hochberg correction with FDR < 0.1. C+D) Correlation between signaling molecule expressions at D0 and clinical outcomes, e.g. ventilation duration (vent_duration) and hospital length of stay (hosp_los) for COVID-19+ patients (C) and COVID-19- patients (D). Correlation estimates are obtained by Pearson correlation. E+F) Correlation between pSTAT3 (E) or pSTAT6 (F) signaling at D0 and hospital length of stay or ventilation duration. Correlation estimates and p-values are obtained by Pearson correlation.
Figure 3:
Figure 3:. Conserved immunological processes accompany COVID-19 resolution and hospital discharge
A) Illustration of intra-patient analysis from admission to discharge for patients who are successfully discharged from the hospital within 30 days of admission (n = 32). B) Paired differential expression analysis of immune cell populations between the first (tp1) and second (tp2) timepoints illustrated in 3A (paired Wilcoxon Rank Sum Test). The log2 fold changes (tp2 vs tp1) are plotted against the negative log10(p-values). Colors indicate if cell populations are significantly down- (blue) or upregulated (purple) from tp1 to tp2 or not differentially expressed (FALSE, grey) after Benjamini-Hochberg correction, FDR < 0.1. C) Frequency of monocytes, neutrophils, cDC1, and CD8 activated T cells at tp1 and tp2. Lines connect samples from the same patient. P-values obtained by paired Wilcoxon Rank Sum Test. CD8 activated T cells and cDC1 cells are shown as a percentage of parent populations (e.g. CD8 T cells and dendritic cells, respectively), while monocytes and neutrophils are shown as a percentage of all cells. D) Principal component analysis of significant immune cell subsets in 3B for tp1, tp2, and healthy controls. Immune cell directionality and contribution to PCA space denoted on right (top). Summary ellipsoid of tp1, tp2, and healthy patients in PCA space on right (bottom). E) Population frequencies of significant immune cell subsets in 3B for tp1, tp2, and healthy controls. Stars indicate median value for each group. Cell populations are highlighted in green if tp2 is closer to healthy than tp1, and highlighted in yellow if tp2 is moving away from healthy. F+G) Protein expression on CD8− and CD4 activated T cells (F) and on monocyte subsets (G) at tp1 and tp2. Mean protein expression values have been log10 transformed, scaled, and centered on heatmap. Bars indicate mean protein expression across all samples. Only significant proteins are shown (Wilcoxon Rank Sum Test, Benjamini-Hochberg correction with FDR < 0.1). H) Scatter plots of CD11c and HLA-DR expression on non-classical monocytes in patient 1344 at D0 (top) and D7 (bottom). I) Expression of signaling molecules in significant immune cell subsets in 3B at tp1 and tp2. Median signaling expression values have been centered on heatmap. Only significant signaling molecules are shown (Wilcoxon Rank Sum Test, Benjamini-Hochberg correction with FDR < 0.1). J) Expression of pTBK1 in CD8 activated T cells, and pSTAT3 expression in CD8 activated T cells and classical monocytes at tp1 and tp2. Lines connect samples from the same patient. P-values obtained by paired Wilcoxon Rank Sum Test. K) Expression of PDL1 on non-classical monocytes at tp1 and tp2. Lines connect samples from the same patient. P-values obtained by paired Wilcoxon Rank Sum Test.
Figure 4:
Figure 4:. Immune features associated with COVID-19 resolution are absent in patients who are discharged late or die from COVID-19
A) Illustration of intra-patient analysis of patients who are hospitalized for >30 days (n = 6) and patients who die (n = 5). B) Median cell population frequencies at tp1 (red) and tp2 (blue) for patients who are discharged <30 days, >30 days, and deceased. C) Representative scatter plots of activated CD8 T cells (defined by CD38 and HLA-DR expression), at tp1 (left) and tp2 (right) for patients who are discharged <30 days, >30 days, and deceased. D) Magnitude of change illustrated by log2FC*−log10(pvalue) of signaling molecules (identified in Figure 3I) for patients who are discharged within 30 days (<30 days, green), discharged after 30 days (>30 days, blue), and die (red). P-values obtained by paired Wilcoxon Rank Sum Test. E+F) Median signaling molecule expression at tp1 (red) and tp2 (blue) for patients who are discharged <30 days, >30 days, and deceased. G) Monocyte frequencies (left plots) and CD8 activated pERK expressions (right plots) relative to time to discharge in all samples from patients who are discharged <30 days (n = 142 samples) or >30 days (n = 30 samples). Black lines connect samples from the same patient. Blue lines and grey shadows represent the best fitted smooth line and 95% confidence interval. Dotted lines intersect the x-axis at day 30.
Figure 5:
Figure 5:. Recovery from severe COVID-19 requires core immune resolution features and additional regulatory T cell and basophil upregulation
A) Illustration of intra-patient analysis of ventilated patients. Three timepoints are considered: tp1 (first sample after a patient has been put on a ventilator), tp2 (last sample before the patient is removed from a ventilator), and tp3 (first sample after a patient is successfully removed from ventilation support). B) Paired differential expression analysis of immune cell populations between the first (tp1) and third (tp3) timepoints illustrated in 5A (paired Wilcoxon Rank Sum Test). The log2 fold changes (tp3 vs tp1) are plotted against the negative log10(p-values). Colors indicate if cell populations are significantly down- (blue) or upregulated (purple) from tp1 to tp3 or not differentially expressed (FALSE, grey) after Benjamini-Hochberg correction, FDR < 0.1. C) Frequency of monocytes, neutrophils, CD4 Treg, and CD8 activated T cells at tp1 and tp3. Lines connect samples from the same patient. P-values obtained by paired Wilcoxon Rank Sum Test. CD8 activated T cells are shown as a percentage of parent population (e.g. CD8 T cells), while monocytes, neutrophils, and CD4 Tregs are shown as a percentage of all cells. D) Principal component analysis of significant immune cell subsets in 5B for tp1, tp3, and healthy controls. Immune cell directionality and contribution to PCA space denoted on the right. E) Population frequencies of significant immune cell subsets in 3B for tp1, tp3, and healthy controls. Stars indicate median value for each group. Cell populations are highlighted in green if tp3 is closer to healthy than tp1, and highlighted in yellow if tp3 is moving away from healthy. F+G) Protein expression on CD8 activated T cells (F) and on monocyte subsets (G) at tp1 and tp3. Mean protein expression values have been log10 transformed, scaled, and centered on heatmap. Bars indicate mean protein expression across all samples. Only significant proteins are shown (Wilcoxon Rank Sum Test, Benjamini-Hochberg correction with FDR < 0.1). H) Expression of PDL1 on non-classical monocytes at tp1 and tp3. Lines connect samples from the same patient. P-values obtained by paired Wilcoxon Rank Sum Test. I) Left: Scatter plots of CD11c and HLA-DR expression on non-classical monocytes in patient 1276 at D0 (tp1, top) and D28 (tp3, bottom). Right: Expression of CD64 on non-classical monocytes for patient 1279 from D0 (tp1) to D28 (tp3). J) Expression of signaling molecules in significant immune cell subsets in 5B at tp1 and tp3. Median signaling expression values have been centered on heatmap. Only significant signaling molecules are shown (Wilcoxon Rank Sum Test, Benjamini-Hochberg correction with FDR < 0.1). K) Expression of pSTAT1 (left) and pCREB (right) in CD4 Tregs at tp1 (blue) and tp3 (orange) for representative patients. L) Expression of pSTAT1 and pCREB in CD4 Tregs at tp1 and tp3. Lines connect samples from the same patient. P-values obtained by paired Wilcoxon Rank Sum Test. M) Principal component analysis of significant signaling molecules in 5I for tp1, tp3, and healthy controls. Immune cell directionality and contribution to PCA space denoted on the right.
Figure 6:
Figure 6:. Core immune resolution features define patients with better clinical outcomes at time of admission
A) Illustration of inter-patient analysis of ventilated patients (vent, n = 13) vs patients who are never ventilated (no vent, n = 50). For ventilated patients, the latest sample before the patient is put on a ventilator is used. For non-ventilated patients, D0 is used. B) Differential expression analysis of immune cell populations between ventilated and non-ventilated patients illustrated in 6A (Wilcoxon Rank Sum Test). The log2 fold changes (vent vs no vent) are plotted against the negative log10(p-values). Colors indicate if cell populations are significantly down- (blue) or upregulated (purple) for vent vs no vent or not differentially expressed (FALSE, grey) after Benjamini-Hochberg correction, FDR < 0.1. C) Frequency of monocytes, neutrophils, CD4 Tregs, and CD8 EM3 T cells in vent and no vent patients. P-values obtained by Wilcoxon Rank Sum Test. CD8 EM3 T cells parent population (e.g. CD8 T cells), while monocytes, neutrophils, and CD4 Tregs are shown as a percentage of all cells. D) Monocyte (left plots) and neutrophil (right plots) frequencies relative to intubation / extubation in all samples from ventilated patients. Black lines connect samples from the same patient. Blue lines and grey shadows represent the best fitted smooth line and 95% confidence interval. Dotted lines intersect the x-axis at day of intubation / extubation. E) Expression of pSTAT3 and pPLCg2 in basophils in non-ventilated and ventilated patients as well as healthy individuals. P-values obtained by Wilcoxon Rank Sum Test. F) Expression of pSTAT5 in CD4 Tregs relative to intubation / extubation in all samples from ventilated patients. G) Graphical summary depicting the trajectories of key immune features involved in COVID-19 resolution and ventilation recovery.

References

    1. Allen Breanna M., Hiam Kamir J., Burnett Cassandra E., Venida Anthony, DeBarge Rachel, Tenvooren Iliana, Marquez Diana M., Cho Nam Woo, Carmi Yaron, and Spitzer Matthew H.. 2020. “Systemic Dysfunction and Plasticity of the Immune Macroenvironment in Cancer Models.” Nature Medicine 26 (7): 1125–34. - PMC - PubMed
    1. Asano Takaki, Boisson Bertrand, Onodi Fanny, Matuozzo Daniela, Moncada-Velez Marcela, Maglorius Renkilaraj Majistor Raj Luxman, Zhang Peng, et al. 2021. “X-Linked Recessive TLR7 Deficiency in ~1% of Men under 60 Years Old with Life-Threatening COVID-19.” Science Immunology 6 (62). 10.1126/sciimmunol.abl4348. - DOI - PMC - PubMed
    1. Bange Erin M., Han Nicholas A., Wileyto Paul, Kim Justin Y., Gouma Sigrid, Robinson James, Greenplate Allison R., et al. 2021. “CD8+ T Cells Contribute to Survival in Patients with COVID-19 and Hematologic Cancer.” Nature Medicine 27 (7): 1280–89. - PMC - PubMed
    1. Centers for Disease Control and Prevention. 2021. “CDC COVID Data Tracker.” Trends in Number of COVID-19 Cases and Deaths in the US Reported to CDC, by State/Territory. November 9, 2021. https://covid.cdc.gov/covid-data-tracker/#trends_dailydeaths.
    1. Chang Sarah Esther, Feng Allan, Meng Wenzhao, Apostolidis Sokratis A., Mack Elisabeth, Artandi Maja, Barman Linda, et al. 2021. “New-Onset IgG Autoantibodies in Hospitalized Patients with COVID-19.” Nature Communications 12 (1): 5417. - PMC - PubMed

Publication types