[Preprint]. 2022 Mar 15:2022.03.14.22272359.
doi: 10.1101/2022.03.14.22272359.

Biomarkers Selection for Population Normalization in SARS-CoV-2 Wastewater-based Epidemiology

Affiliations

Biomarkers Selection for Population Normalization in SARS-CoV-2 Wastewater-based Epidemiology

Shu-Yu Hsu et al. medRxiv. .

Update in

Abstract

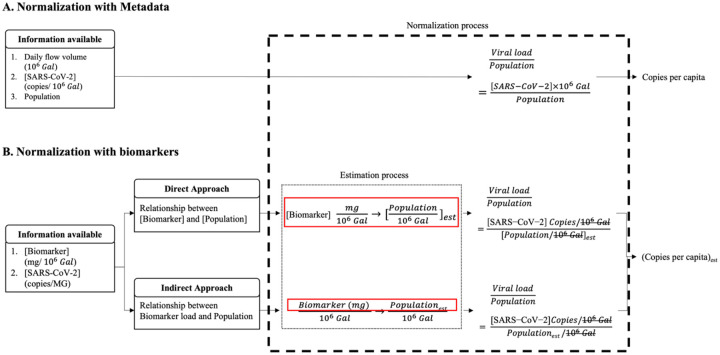
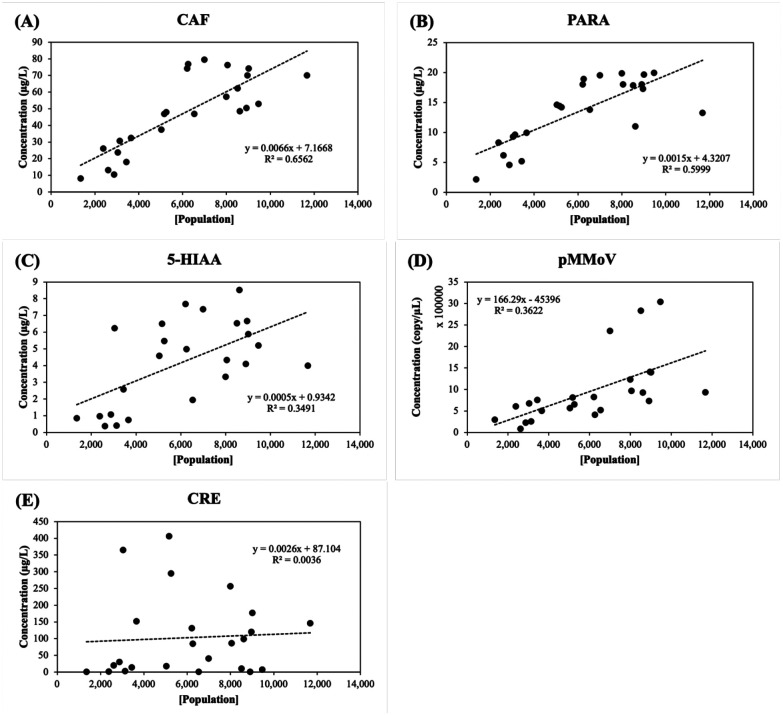
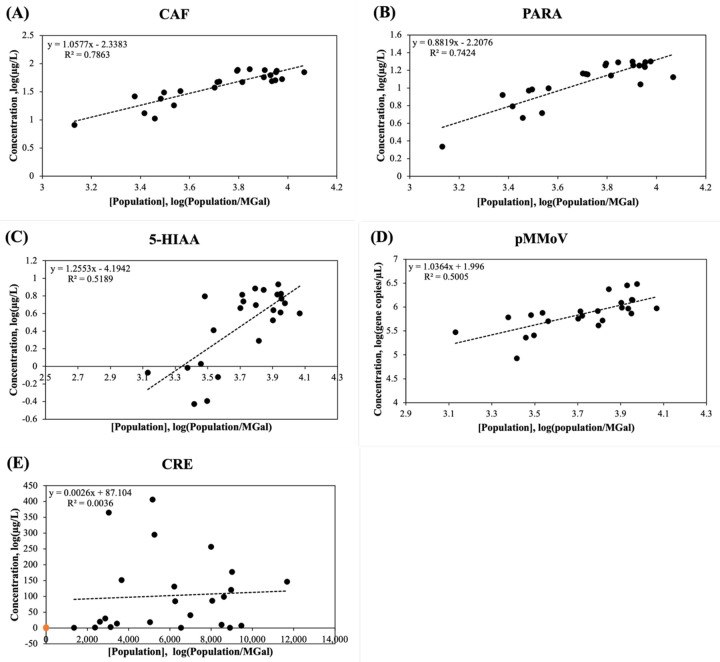
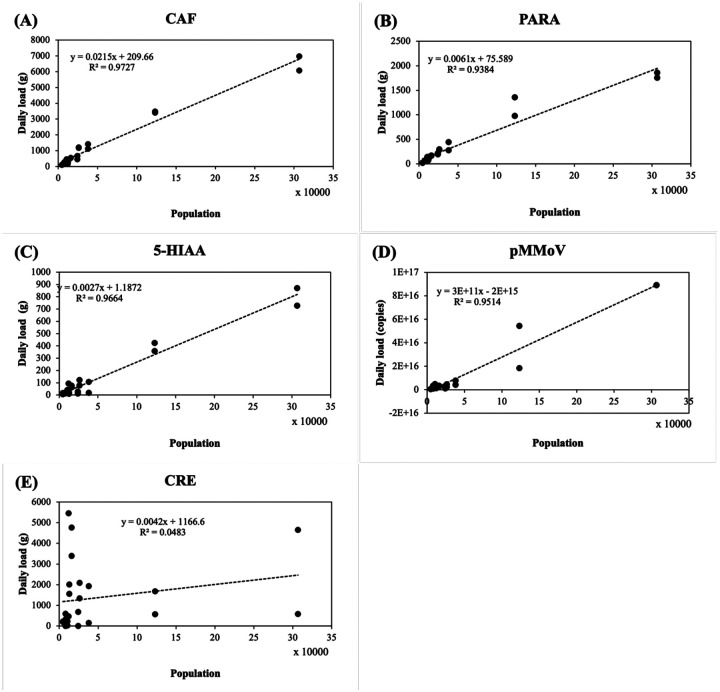
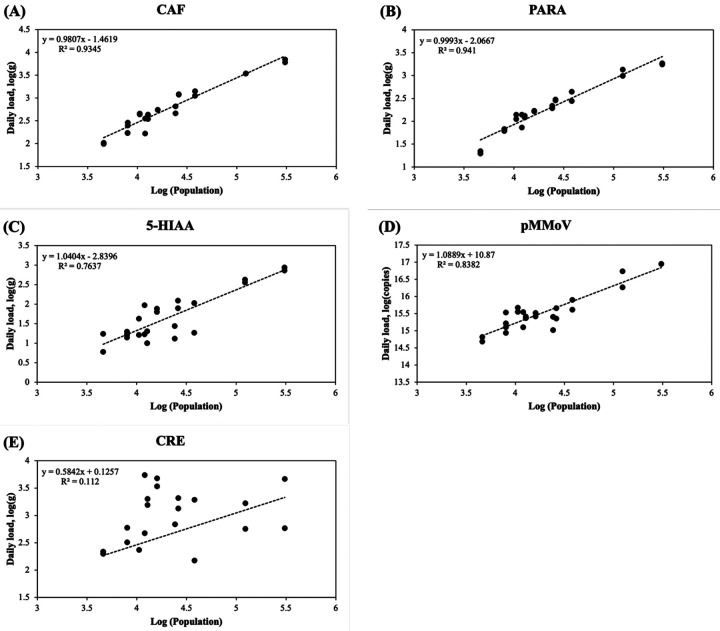
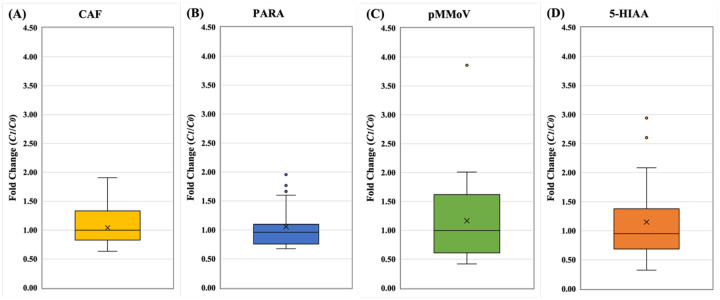
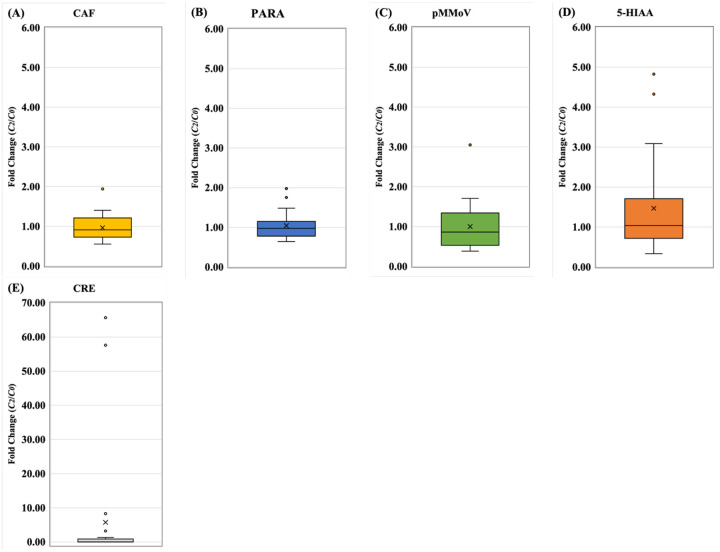
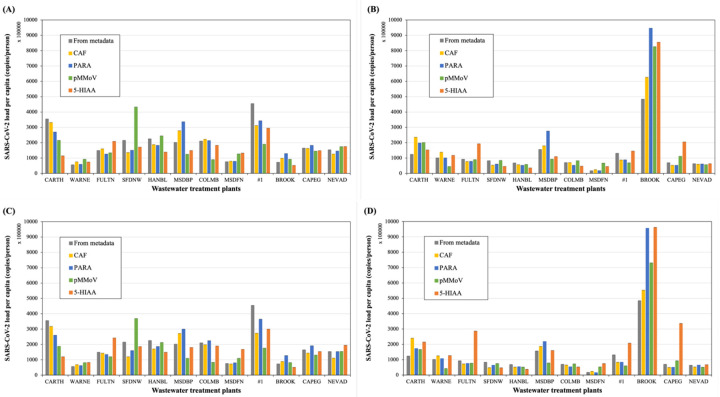
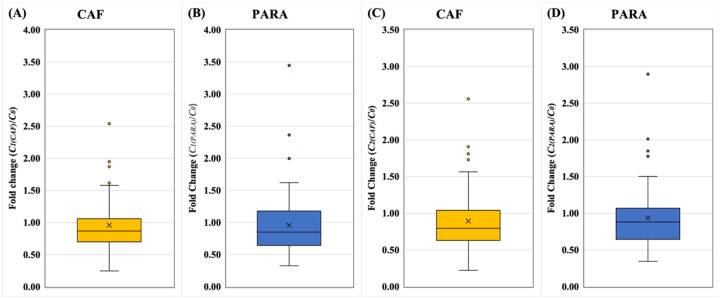
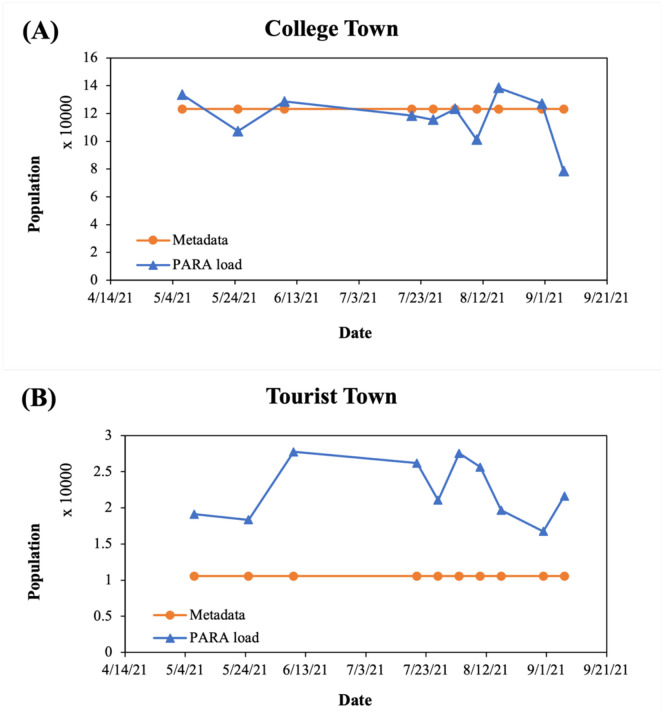
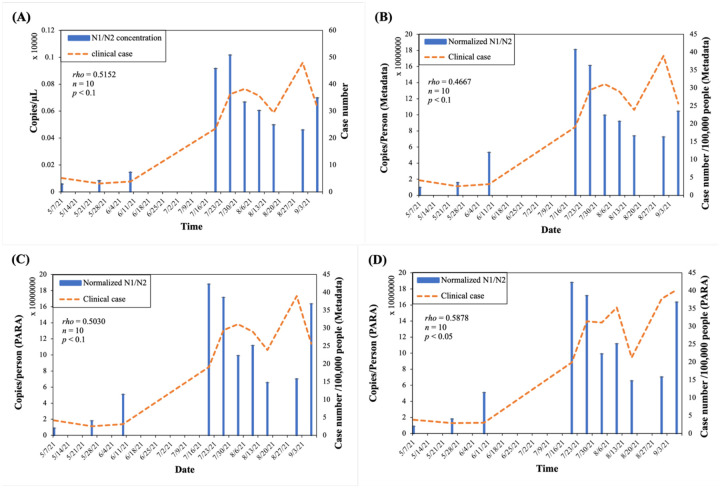
Wastewater-based epidemiology (WBE) has been one of the most cost-effective approaches to track the SARS-CoV-2 levels in the communities since the COVID-19 outbreak in 2020. Normalizing SARS-CoV-2 concentrations by the population biomarkers in wastewater can be critical for interpreting the viral loads, comparing the epidemiological trends among the sewersheds, and identifying the vulnerable communities. In this study, five population biomarkers, pepper mild mottle virus (pMMoV), creatinine (CRE), 5-hydroxyindoleacetic acid (5-HIAA), caffeine (CAF) and its metabolite paraxanthine (PARA) were investigated for their utility in normalizing the SARS-CoV-2 loads through developed direct and indirect approaches. Their utility in assessing the real-time population contributing to the wastewater was also evaluated. The best performed candidate was further tested for its capacity for improving correlation between normalized SARS-CoV-2 loads and the clinical cases reported in the City of Columbia, Missouri, a university town with a constantly fluctuated population. Our results showed that, except CRE, the direct and indirect normalization approaches using biomarkers allow accounting for the changes in wastewater dilution and differences in relative human waste input over time regardless flow volume and population at any given WWTP. Among selected biomarkers, PARA is the most reliable population biomarker in determining the SARS-CoV-2 load per capita due to its high accuracy, low variability, and high temporal consistency to reflect the change in population dynamics and dilution in wastewater. It also demonstrated its excellent utility for real-time assessment of the population contributing to the wastewater. In addition, the viral loads normalized by the PARA-estimated population significantly improved the correlation ( rho =0.5878, p <0.05) between SARS-CoV-2 load per capita and case numbers per capita. This chemical biomarker offers an excellent alternative to the currently CDC-recommended pMMoV genetic biomarker to help us understand the size, distribution, and dynamics of local populations for forecasting the prevalence of SARS-CoV2 within each sewershed.

Highlight bullet points: The paraxanthine (PARA), the metabolite of the caffeine, is a more reliable population biomarker in SARS-CoV-2 wastewater-based epidemiology studies than the currently recommended pMMoV genetic marker.SARS-CoV-2 load per capita could be directly normalized using the regression functions derived from correlation between paraxanthine and population without flowrate and population data.Normalizing SARS-CoV-2 levels with the chemical marker PARA significantly improved the correlation between viral loads per capita and case numbers per capita.The chemical marker PARA demonstrated its excellent utility for real-time assessment of the population contributing to the wastewater.


Figures

Figure 1.
Figure 1.
Normalization processes of determining SARS-CoV-2 load per capita. (A) When the population size, daily flow volume and viral concentration of the metadata are used in the normalization process. (B) When the real-time population size of the sewershed is estimated using regression functions developed from the correlation between biomarker and population size from metadata in direct or indirect approach.
Figure 2.
Figure 2.
Population concentration [Population] versus biomarker concentration (mg/L) in the wastewater. (A) CAF: caffeine, (B) PARA: paraxanthine, (C) 5-HIAA: 5-hydroxyindoleacetic acid, (D) pMMoV: Pepper Mild Mottle Virus (E) CRE: creatinine. The concentrations of caffeine, paraxanthine, 5-hydroxyindoleacetic acid, and creatinine in 24 wastewater samples (Table 1) were determined by LC-MS/MS analysis and the Pepper Mild Mottle Virus concentration was determined by RT-qPCR as described in Methods and Materials. The population concentrations were calculated using the daily flow volume and population size in Eq. (1). The trendline (dashed line) was calculated using linear regression; R2 represented the percentage of the population concentration variation that is explained by the linear model.
Figure 3.
Figure 3.
Log-transformed population concentration [Population] versus biomarker concentration (mg/L) in the wastewater. (A) CAF: caffeine, (B) PARA: paraxanthine, (C) 5-HIAA: 5-hydroxyindoleacetic acid, (D) pMMoV: Pepper Mild Mottle Virus (E) CRE: creatinine. The concentrations of caffeine, paraxanthine, 5-hydroxyindoleacetic acid, and creatinine in 24 wastewater samples (Table 1) were determined by LC-MS/MS analysis and the Pepper Mild Mottle Virus concentration was determined by RT-qPCR as described in Methods and Materials. The population concentrations were calculated using the daily flow volume and population size in Eq. (1). The trendline (dashed line) was calculated using linear regression; R2 represented the percentage of the population concentration variation that is explained by the linear model.
Figure 4.
Figure 4.
Population versus biomarker load in the wastewater. (A) CAF: caffeine, (B) PARA: paraxanthine, (C) 5-HIAA: 5-hydroxyindoleacetic acid, (D) pMMoV: Pepper Mild Mottle Virus (E) CRE: creatinine. The concentrations of caffeine, paraxanthine, 5-hydroxyindoleacetic acid, and creatinine in 24 wastewater samples (Table 1) were determined by LC-MS/MS analysis and the Pepper Mild Mottle Virus concentration was determined by RT-qPCR as described in Methods and Materials. The biomarker loads were calculated using the daily flow volume (million gallon, MGal) and biomarker concentrations in Eq. (3). The trendline (dashed line) was calculated using linear regression; R2 represented the percentage of the population concentration variation that is explained by the linear model.
Figure 5.
Figure 5.
Log-transformed population versus biomarker load in the wastewater. (A) CAF: caffeine, (B) PARA: paraxanthine, (C) 5-HIAA: 5-hydroxyindoleacetic acid, (D) pMMoV: Pepper Mild Mottle Virus (E) CRE: creatinine. The concentrations of caffeine, paraxanthine, 5-hydroxyindoleacetic acid, and creatinine in 24 wastewater samples (Table 1) were determined by LC-MS/MS analysis and the Pepper Mild Mottle Virus concentration was determined by RT-qPCR. The biomarker loads were calculated using the daily flow volume and biomarker concentrations in Eq. (3). The trendline (dashed line) of each graph was generated using linear regression; R2 represented the percentage of the population concentration variation that is explained by the linear model.
Figure 6.
Figure 6.
The fold changes of normalization coefficients from direct approach. A) CAF: caffeine, (B) PARA: paraxanthine, (C) pMMoV: Pepper Mild Mottle Virus, (D) 5-HIAA: 5-hydroxyindoleacetic acid. The normalization coefficients, C0 and C1(i), of 24 wastewater samples (Table 1) were calculated using metadata and biomarker concentration in Eq. (5) and Eq. (7), respectively. The fold changes, C1(i) divided by C0, were used to standardize C1(i) for each biomarker at each WWTP. In the box plots, the upper whisker represents the maximum, the lower whisker the minimum; “X” represents the mean and open circles are the outliers. The data of CRE is not shown due to poor correlation between biomarker concentration and population concentration in wastewater.
Figure 7.
Figure 7.
The fold changes of normalization coefficients from indirect approach. A) CAF: caffeine, (B) PARA: paraxanthine, (C) 5-HIAA: 5-hydroxyindoleacetic acid, (D) pMMoV: Pepper Mild Mottle Virus (E) CRE: creatinine. The normalization coefficients, C0 and C2(i), of 24 wastewater samples (Table 1) were calculated using metadata and biomarker concentration in Eq. (5) and Eq. (10), respectively. The fold changes, C2(i) divided by C0, were used to standardize C2(i) for each biomarker at each WWTP. In the box plots, the upper whisker represents the maximum, the lower whisker the minimum; “X” represents the mean and open circles are the outliers.
Figure 8.
Figure 8.
The normalized SARS-CoV-2 load per capita by biomarkers using either direct or indirect approaches at WWTPs. The direct normalization approach was applied to 12 samples collected in the week of (A) January 19th and (B) January 23rd. The indirect approach was applied to 12 samples collected in the week of (C) January 19th and (D) January 23rd. (Grey: Metadata, yellow: CAF, blue: PARA, green: pMMoV, orange: 5-HIAA; error bars showed standard deviation, n=4). The SARS-CoV-2 load per capita was normalized using the average of duplicated N1 and N2 concentrations at each WWTP and the normalization coefficients of each biomarker in Eq. (7) for direction approach in (A) and (B), or in Eq. (10) for indirect approach in (C) and (D). The viral loads were normalized using metadata in Eq. (5) and included in all graphs for comparison. The data of CRE was not shown due to its poor correlation with population.
Figure 9.
Figure 9.
Validation of normalization approaches. The direct approach for (A) CAF and (B) PARA and the indirect approach for (C) CAF and (D) PARA were applied and shown for validation. In the box plots, the upper whisker represents the maximum, the lower whisker the minimum; “X” represents the mean and open circles are the outliers. The PARA and CAF concentrations in 64 wastewater samples collected from WWTPs in the State of Missouri (Table S1) were quantified by LC-MS/MS, and the normalization coefficients, C0, C1(i) and C2(i), were calculated as described in Methods and Materials. The fold changes (C1(i)/C0 or C2(i)/C0) were used to standardize C1(i) and C2(i).
Figure 10.
Figure 10.
Estimation of real-time population in the college town and the tourist town. (A) College town (B) Tourist town (blue triangle: population estimated using PARA, orange circle: population reported by Metadata). The PARA concentrations in 10 wastewater samples collected from WWTPs in City of Columbia and a tourist town (Table S2) were quantified by LC-MS/MS as described in Methods and Materials and further converted to daily PARA load using daily flow volume from metadata. The population was estimated using the daily PARA load using the developed regression function (Table S4).
Figure 11.
Figure 11.
The correlation between normalized SARS-CoV-2 loads in wastewater and the clinical reported case numbers. (Orange dashed line: clinical case, blue solid bar: normalized N1/N2 average concentration/load). The PARA concentrations in 10 wastewater samples collected from WWTP in City of Columbia (Table S2) were quantified by LC-MS/MS as described in Methods and Materials and applied in Eq. (10) to normalize viral load using indirect approach. (A) Viral concentrations and clinical cases before normalization (B) Both viral load per capita and clinical cases normalized using metadata. (C) Viral load per capita normalized by PARA load and clinical cases normalized by Metadata (D) Both viral load per capita and clinical cases normalized by PARA loads. The Spearman’s correlation was performed to examine the correlation between normalized SARS-CoV-2 and clinical case numbers; rho represented the strength of the correlation.

Similar articles

References

    1. WHO Naming the coronavirus disease (COVID-19) and the virus that causes it. Available from: https://www.who.int/emergencies/diseases/novel-coronavirus-2019/technica....
    1. Gonzalez R, Curtis K, Bivins A, et al. (2020) COVID-19 surveillance in Southeastern Virginia using wastewater-based epidemiology. Water Research 186: 116296. - PMC - PubMed
    1. Polo D, Quintela-Baluja M, Corbishley A, et al. (2020) Making waves: Wastewater-based epidemiology for COVID-19 – approaches and challenges for surveillance and prediction. Water Research 186: 116404. - PMC - PubMed
    1. Agrawal S, Orschler L, Lackner S (2021) Long-term monitoring of SARS-CoV-2 RNA in wastewater of the Frankfurt metropolitan area in Southern Germany. Sci Rep 11: 5372. - PMC - PubMed
    1. Haramoto E, Malla B, Thakali O, et al. (2020) First environmental surveillance for the presence of SARS-CoV-2 RNA in wastewater and river water in Japan. Science of The Total Environment 737: 140405. - PMC - PubMed

Publication types