[Preprint]. 2022 Mar 16:2022.03.14.484208.
doi: 10.1101/2022.03.14.484208.

Parsing the role of NSP1 in SARS-CoV-2 infection

Affiliations

Parsing the role of NSP1 in SARS-CoV-2 infection

Tal Fisher et al. bioRxiv. .

Update in

  • Parsing the role of NSP1 in SARS-CoV-2 infection.
    Fisher T, Gluck A, Narayanan K, Kuroda M, Nachshon A, Hsu JC, Halfmann PJ, Yahalom-Ronen Y, Tamir H, Finkel Y, Schwartz M, Weiss S, Tseng CK, Israely T, Paran N, Kawaoka Y, Makino S, Stern-Ginossar N. Fisher T, et al. Cell Rep. 2022 Jun 14;39(11):110954. doi: 10.1016/j.celrep.2022.110954. Epub 2022 May 26. Cell Rep. 2022. PMID: 35671758 Free PMC article.

Abstract

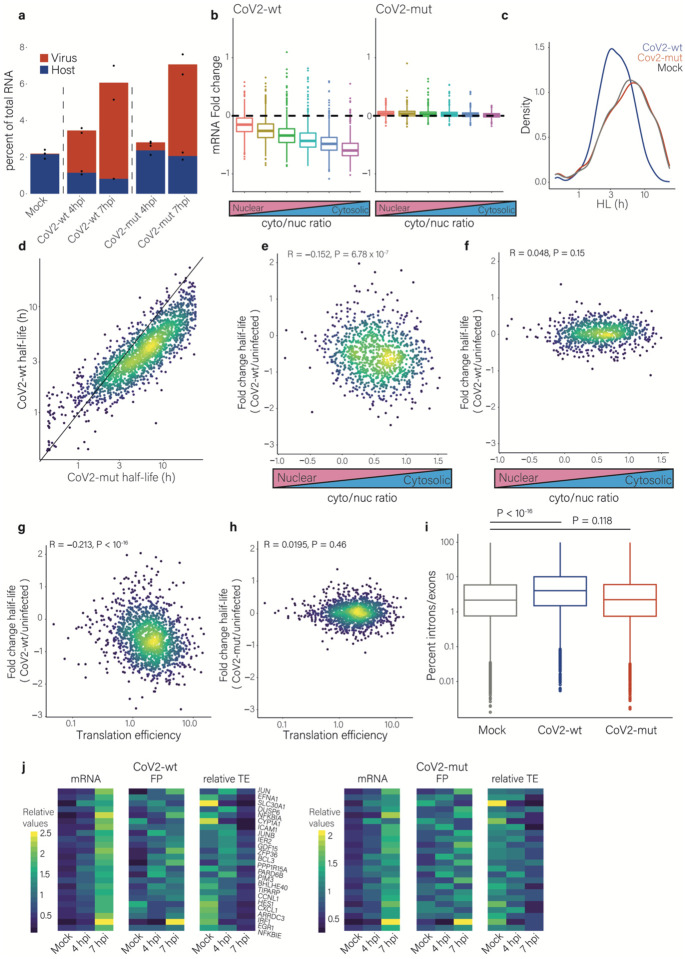
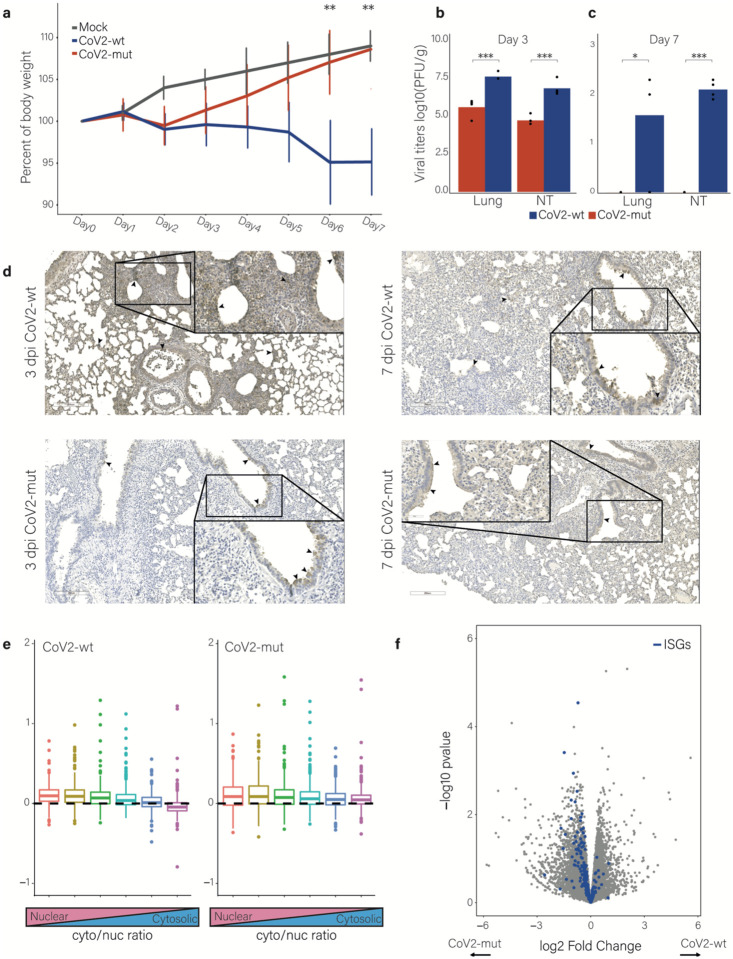
Severe acute respiratory syndrome coronavirus 2 (SARS-CoV-2) is the cause of the ongoing coronavirus disease 19 (COVID-19) pandemic. Despite its urgency, we still do not fully understand the molecular basis of SARS-CoV-2 pathogenesis and its ability to antagonize innate immune responses. SARS-CoV-2 leads to shutoff of cellular protein synthesis and over-expression of nsp1, a central shutoff factor in coronaviruses, inhibits cellular gene translation. However, the diverse molecular mechanisms nsp1 employs as well as its functional importance in infection are still unresolved. By overexpressing various nsp1 mutants and generating a SARS-CoV-2 mutant in which nsp1 does not bind ribosomes, we untangle the effects of nsp1. We uncover that nsp1, through inhibition of translation and induction of mRNA degradation, is the main driver of host shutoff during SARS-CoV-2 infection. Furthermore, we find the propagation of nsp1 mutant virus is inhibited specifically in cells with intact interferon (IFN) response as well as in-vivo , in infected hamsters, and this attenuation is associated with stronger induction of type I IFN response. This illustrates that nsp1 shutoff activity has an essential role mainly in counteracting the IFN response. Overall, our results reveal the multifaceted approach nsp1 uses to shut off cellular protein synthesis and uncover the central role it plays in SARS-CoV-2 pathogenesis, explicitly through blockage of the IFN response.


Figures

Figure 1:
Figure 1:. Nsp1 promotes both translation inhibition and decay of cellular mRNAs.
a, Schematic illustration of the nsp1-ΔRB and nsp1-CD mutation. b, 293T cells were transfected with plasmids expressing nsp1-WT, nsp1-ΔRB, or nsp1-CD, and ribosomes were pelleted. Nsp1 protein levels in the input and in the ribosome pellet (RBP) were measured by Western blot with Strep-Tactin. RPS6 and GAPDH were used as ribosomal protein and loading controls, respectively. Right panel presents the ratio of the strep signal in the RBP to input, which was assessed using the intensity of the bends. Points show technical replicates, * = p<0.05 and ** = p<0.01 for a two tailed t-test. c-f, 293T cells co-transfected with plasmids expressing nsp1-WT, nsp1-ΔRB, or nsp1-CD or a control plasmid together with (c and d) a reporter plasmid expressing GFP fused to human beta-globin 5’UTR (host-5’UTR-GFP), or (e and f) the SARS-CoV-2 5’leader sequence (CoV2-leader-GFP). (c and e) GFP expression was measured by flow cytometry. (d and f) Relative GFP mRNA levels were measured by quantitative real-time PCR. 18S ribosomal RNA was used as a normalizing gene. Points show measurement of technical replicates. (g and h) Vero E6 cells were co-transfected with the reporter plasmid containing a cap-dependent Renilla luciferase followed by an EMCV IRES and Firefly luciferase (pRL-EMCV-FL) along with pCAGGS empty vector (EV) as a control plasmid or a plasmid expressing nsp1-WT, nsp1-ΔRB or nsp1-CD. No T/F represents non-transfected cells. (g) Luciferase expression levels. Y-axis represents light units. (h) RNAs were extracted and analyzed by Northern blot using a digoxigenin-labeled rLuc riboprobe. RNA size marker is a mixture of in vitro-transcribed RNA transcripts, RNA 1 and RNA 2, as shown. RNA 1 contains the region from the 5’-end to the 3’-end of the intercistronic region of pRL-EMCV-FL, and RNA 2 contains the region from the 5’-end to the end of the rluc ORF in pRL-EMCV-FL. A non-specific bend is indicated.
Figure 2:
Figure 2:. Nsp1 inhibits nuclear mRNA export and accelerates the decay of cytosolic mRNAs.
a, Distribution of the cytosolic to nuclear ratio of cellular transcripts in 293T cells transfected with nsp1-WT, nsp1-ΔRB, or control expression plasmids that were subjected to subcellular fractionation followed by RNA-seq. b, Distribution of cellular transcript half-lives in 293T cells transfected with nsp1-WT, nsp1-ΔRB, nsp1-CD, or control expression plasmids. Half-lives were determined by SLAM-seq measurements followed by analysis using GRAND-SLAM (Jürges et al., 2018). c, Scatter plot of the fold change of transcript half-lives between SARS-CoV-2-infected cells and uninfected Calu3 cells (Finkel et al., 2021a), relative to the fold change of 293T cells transfected with nsp1-WT compared to a control plasmid. d, Scatter plot of the fold change of transcript half-lives between 293T cells transfected with nsp1-WT compared to control plasmid, relative to the cytosolic to nuclear ratio of the transcripts. e, Scatter plot of the fold change of transcript half-lives between 293T cells transfected with a plasmid expressing nsp1-WT or with a control plasmid, relative to their translation efficiency (TE) values from uninfected cells. Pearson’s R and two-sided P values are presented.
Figure 3:
Figure 3:. SARS-CoV-2 carrying nsp1-ΔRB is attenuated specifically in IFN competent cells.
a, Western blot analysis of the Nsp1 protein in Vero cells infected with the CoV2-wt or with the CoV2-mut at an MOI of 0.1 or 1. b, Microscopy images of Vero cells infected with CoV2-wt or with CoV2-mut at 16 hpi with an MOI of 2, and stained with antibodies for Nsp1. c, Northern blot analysis using a probe, which binds to the common 3’ UTR of viral mRNAs and detects all viral mRNAs, in Vero cells infected with the CoV2-wt or with the CoV2-mut at MOI of 0.1 or 1 at 18hpi. d, Microscopy images of Vero cells infected with CoV2-wt or with CoV2-mut, and stained with antibodies for the nucleocapsid protein. (e and f) viral titers (e) or percentage of viral reads (f) in Calu3 or Vero cells infected with CoV2-wt or with CoV2-mut at 0, 11, 24, and 48 hpi with an MOI of 0.01. Two tailed T-test performed where ** = p<0.01 and *** = p<0.001. g, Volcano plots showing changes in cellular transcript levels in CoV2-wt versus CoV2-mut infected Calu3 (right) or Vero (left) cells at 24 hpi. The fold change and statistical significance are presented in the x axis and y axis, respectively. Enrichment of ISGs was calculated using a hypergeometric test. ISGs are marked in blue. h, percentage of viral reads in untreated or Ruxolitinib treated Calu3 cells infected with CoV2-wt or with CoV2-mut at 0, 24, and 48 hpi with an MOI of 0.01. The effect of Ruxolitinib treatment on CoV2-mut was significantly stronger compared to the effect on CoV2-wt, * = p<0.05 and *** = p<0.001 using linear regression.
Figure 4:
Figure 4:. Effects of nsp1 on translation and accumulation of viral and host mRNAs.
a, Protein synthesis measurement by flow cytometry of Calu3 cells infected with CoV2-wt or with CoV2-mut (MOI = 3) for 4, 5 and 7 hpi or an uninfected control following O-Propargyl Puromycin (OPP) incorporation and fluorescent labeling using Click chemistry b, Cumulative frequency of human (line) and viral (dots) genes according to their relative translation efficiency (TE) in cells infected with CoV2-wt (blue) or with CoV2-mut (red) at 4 hpi. TE was calculated from ribosome profiling and mRNA sequencing, and is defined as the ratio of ribosome footprints to mRNA for a given gene. Each dot represents one of nine major viral mRNA species.
Figure 5:
Figure 5:. Nsp1 mediates cellular RNA degradation during SARS-CoV-2 infection
a, Percentage of reads that aligned to the human or viral transcripts out of total RNA reads. b, The fold change in RNA levels in CoV2-wt-infected (left) or CoV2-mut-infected (right) cells relative to uninfected cells at 7 hpi. Transcripts were grouped into six bins on the basis of their cytosol-to-nucleus localization ratio. c, The distribution of cellular transcript half-lives in uninfected, CoV2-wt-infected or CoV2-mut-infected Calu3 cells as was determined by SLAM-seq followed by GRAND-SLAM analysis (Jürges et al., 2018). d, Scatter plot of cellular transcript half-lives in CoV2-wt-infected cells relative to CoV2-mutinfected cells. (e and f), Scatter plots of the fold change of transcript half-lives between CoV2-wt-infected cells (e) or CoV2-mut-infected cells (f) and uninfected cells, relative to the cytosolic to nuclear ratio in uninfected cells. Pearson’s R and two-sided P value on log values are presented. (g and h) Scatter plots of the fold change in transcript half-lives between CoV2-wt-infected cells (g) or CoV2-mut-infected cells (h) relative to the previously calculated TE values in uninfected cells. Pearson’s R and two-sided P value on log values are presented. (i), The ratios of intronic to exonic reads for cellular genes in uninfected, CoV2-wt-infected, or CoV2-mut-infected Calu3 cells, at 4 hpi. (j) Heatmaps showing the relative mRNA, footprints and translation efficiency, at 4 and 7 hpi of cellular genes that were elevated during infection in both CoV2-wt infected cells and CoV2-mut infected cells relative to uninfected cells.
Figure 6:
Figure 6:. Nsp1 plays a critical role in SARS-CoV-2 pathogenesis in-vivo
a, Hamster weight as a percentage of their body weight on day 0 for hamsters infected with CoV2-mut, CoV2-wt, and Mock infected hamsters. (b and c), Viral titers in lungs and in NT at 3dpi (b) and 7dpi (c) for both CoV2-wt and CoV2-mut infected hamsters. (a-c)Two tailed T-test performed where * = p<0.05 and *** = p<0.001. d, IHC staining of hamster lungs for SARS-CoV-2 spike protein (brown) with hematoxylin counterstain (blue) for hamsters infected with CoV2-wt or CoV2-mut at 3 dpi and 7 dpi. Arrows indicate select infected cells. e, The fold change in mRNA levels in CoV2-wt-infected (left) or CoV2-mut-infected (right) relative to mock-infected hamsters at 3 dpi. Transcripts were grouped into six bins on the basis of their cytosol-to-nucleus localization ratio. f, Volcano plot showing changes in cellular transcript levels in CoV2-wt versus CoV2-mut infected hamsters at 3 dpi. The fold change and the statistical significance are presented in the x axis and y axis, respectively. ISGs enrichment was calculated using a hypergeometric test. ISGs are marked in blue. two extreme genes were removed.

References

    1. Abernathy E., and Glaunsinger B. (2015). Emerging roles for RNA degradation in viral replication and antiviral defense. Virology 479–480, 600–608. - PMC - PubMed
    1. Addetia A., Lieberman N.A.P., Phung Q., Hsiang T.-Y., Xie H., Roychoudhury P., Shrestha L., Loprieno M.A., Huang M.-L., Gale M. Jr, et al. (2021). SARS-CoV-2 ORF6 Disrupts Bidirectional Nucleocytoplasmic Transport through Interactions with Rae1 and Nup98. MBio 12. - PMC - PubMed
    1. Banerjee A.K., Blanco M.R., Bruce E.A., Honson D.D., Chen L.M., Chow A., Bhat P., Ollikainen N., Quinodoz S.A., Loney C., et al. (2020). SARS-CoV-2 Disrupts Splicing, Translation, and Protein Trafficking to Suppress Host Defenses. Cell 183, 1325–1339.e21. - PMC - PubMed
    1. Bujanic L., Shevchuk O., von Kügelgen N., Ludwik K., Koppstein D., Zerna N., Sickmann A., and Chekulaeva M. (2021). The key features of SARS-CoV-2 leader and NSP1 required for viral escape of NSP1-mediated repression. bioRxiv 10.1101/2021.09.13.460054. - DOI - PMC - PubMed
    1. Burke J.M., St Clair L.A., Perera R., and Parker R. (2021). SARS-CoV-2 infection triggers widespread host mRNA decay leading to an mRNA export block. RNA rna.078923.121. - PMC - PubMed

Publication types