

Comparative plastome analysis of Musaceae and new insights into phylogenetic relationships
- PMID: 35313810
- PMCID: PMC8939231
- DOI: 10.1186/s12864-022-08454-3
Comparative plastome analysis of Musaceae and new insights into phylogenetic relationships
Abstract
Background: Musaceae is an economically important family consisting of 70-80 species. Elucidation of the interspecific relationships of this family is essential for a more efficient conservation and utilization of genetic resources for banana improvement. However, the scarcity of herbarium specimens and quality molecular markers have limited our understanding of the phylogenetic relationships in wild species of Musaceae. Aiming at improving the phylogenetic resolution of Musaceae, we analyzed a comprehensive set of 49 plastomes for 48 species/subspecies representing all three genera of this family.
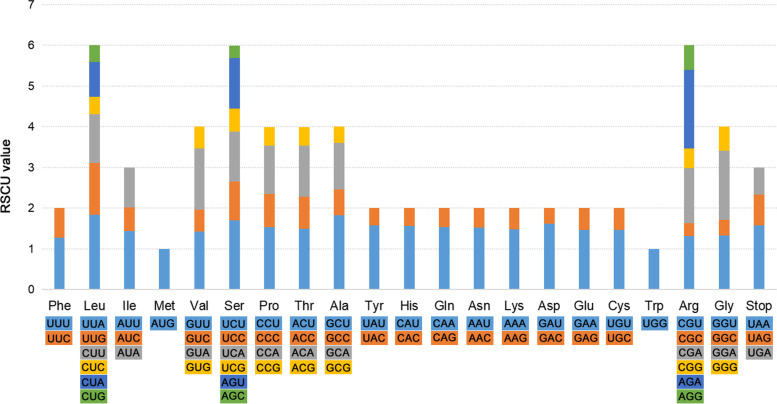
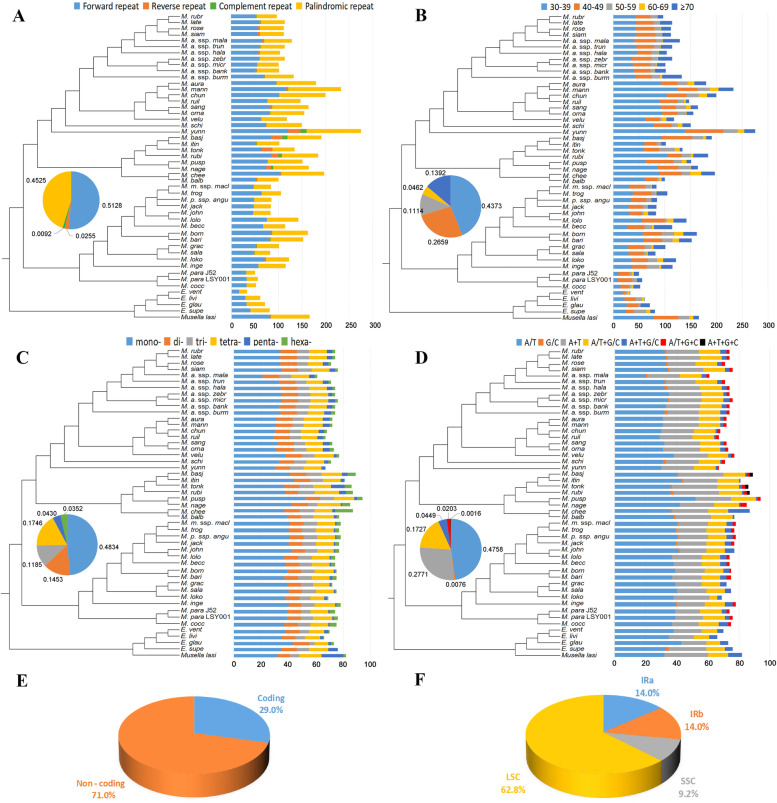
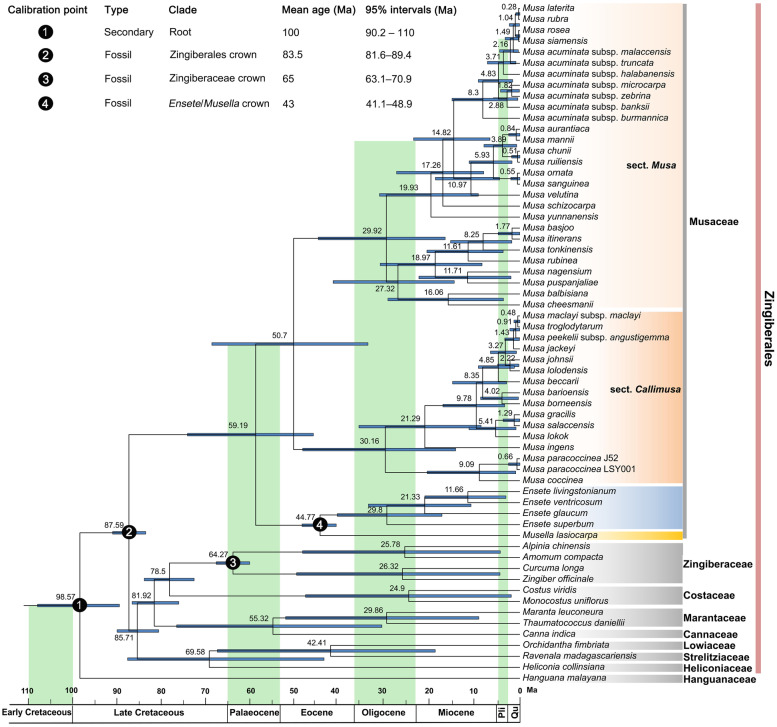
Results: Musaceae plastomes have a relatively well-conserved genomic size and gene content, with a full length ranging from 166,782 bp to 172,514 bp. Variations in the IR borders were found to show phylogenetic signals to a certain extent in Musa. Codon usage bias analysis showed different preferences for the same codon between species and three genera and a common preference for A/T-ending codons. Among the two genes detected under positive selection (dN/dS > 1), ycf2 was indicated under an intensive positive selection. The divergent hotspot analysis allowed the identification of four regions (ndhF-trnL, ndhF, matK-rps16, and accD) as specific DNA barcodes for Musaceae species. Bayesian and maximum likelihood phylogenetic analyses using full plastome resulted in nearly identical tree topologies with highly supported relationships between species. The monospecies genus Musella is sister to Ensete, and the genus Musa was divided into two large clades, which corresponded well to the basic number of n = x = 11 and n = x =10/9/7, respectively. Four subclades were divided within the genus Musa. A dating analysis covering the whole Zingiberales indicated that the divergence of Musaceae family originated in the Palaeocene (59.19 Ma), and the genus Musa diverged into two clades in the Eocene (50.70 Ma) and then started to diversify from the late Oligocene (29.92 Ma) to the late Miocene. Two lineages (Rhodochlamys and Australimusa) radiated recently in the Pliocene /Pleistocene periods.
Conclusions: The plastome sequences performed well in resolving the phylogenetic relationships of Musaceae and generated new insights into its evolution. Plastome sequences provided valuable resources for population genetics and phylogenetics at lower taxon.
Keywords: Divergence time; Musaceae; Phylogeny; Plastome; cpDNA marker.
© 2022. The Author(s).
Conflict of interest statement
The authors declare that there are no competing interests.
Figures


Similar articles
-
Molecular phylogeny and systematics of the banana family (Musaceae) inferred from multiple nuclear and chloroplast DNA fragments, with a special reference to the genus Musa.Mol Phylogenet Evol. 2010 Oct;57(1):1-10. doi: 10.1016/j.ympev.2010.06.021. Epub 2010 Jun 30. Mol Phylogenet Evol. 2010. PMID: 20601004
-
Phylogeny and diversification of genus Sanicula L. (Apiaceae): novel insights from plastid phylogenomic analyses.BMC Plant Biol. 2024 Jan 24;24(1):70. doi: 10.1186/s12870-024-04750-0. BMC Plant Biol. 2024. PMID: 38263006 Free PMC article.
-
A multi gene sequence-based phylogeny of the Musaceae (banana) family.BMC Evol Biol. 2011 Apr 16;11:103. doi: 10.1186/1471-2148-11-103. BMC Evol Biol. 2011. PMID: 21496296 Free PMC article.
-
Dynamic evolution of the plastome in the Elm family (Ulmaceae).Planta. 2022 Dec 17;257(1):14. doi: 10.1007/s00425-022-04045-4. Planta. 2022. PMID: 36526857 Review.
-
A comparative analysis of plastome evolution in autotrophic Piperales.Am J Bot. 2024 Mar;111(3):e16300. doi: 10.1002/ajb2.16300. Epub 2024 Mar 12. Am J Bot. 2024. PMID: 38469876 Review.
Cited by
-
Hybridization, missing wild ancestors and the domestication of cultivated diploid bananas.Front Plant Sci. 2022 Oct 7;13:969220. doi: 10.3389/fpls.2022.969220. eCollection 2022. Front Plant Sci. 2022. PMID: 36275535 Free PMC article.
-
Musa species in mainland Southeast Asia: From wild to domesticate.PLoS One. 2024 Oct 2;19(10):e0307592. doi: 10.1371/journal.pone.0307592. eCollection 2024. PLoS One. 2024. PMID: 39356650 Free PMC article.
-
Comparative chloroplast genomes and phylogenetic analysis of the Phlegmariurus (Lycopodiaceae) from China and neighboring regions.Front Plant Sci. 2025 Jul 8;16:1543431. doi: 10.3389/fpls.2025.1543431. eCollection 2025. Front Plant Sci. 2025. PMID: 40697875 Free PMC article.
-
Chromosome-level genome assemblies of Musa ornata and Musa velutina provide insights into pericarp dehiscence and anthocyanin biosynthesis in banana.Hortic Res. 2024 Mar 14;11(5):uhae079. doi: 10.1093/hr/uhae079. eCollection 2024 May. Hortic Res. 2024. PMID: 38766534 Free PMC article.
-
Phylogeny and Taxonomic Revision of the Genus Melanosciadium (Apiaceae), Based on Plastid Genomes and Morphological Evidence.Plants (Basel). 2024 Mar 21;13(6):907. doi: 10.3390/plants13060907. Plants (Basel). 2024. PMID: 38592923 Free PMC article.
References
-
- Häkkinen M, Vare H. Typification and check-list of Musa L. names (Musaceae) with nomenclatural notes. Adansonia. 2008;30(1):63–112.
-
- Häkkinen M. Reappraisal of sectional taxonomy in Musa (Musaceae). Taxon. 2013;62(4):809–13. 10.12705/624.3.
-
- Simmonds NW. The evolution of the bananas. London: Green & Co. Ltd.; 1962.
-
- Rijzaani H, Bayer PE, Rouard M, Dolezel J, Batley J, Edwards D. The pangenome of banana highlights differences between genera and genomes. Plant Genome. 2021:e20100. 10.1002/tpg2.20100. - PubMed
-
- Liu AZ, Kress WJ, Li DZ. Phylogenetic analyses of the banana family (Musaceae) based on nuclear ribosomal (ITS) and chloroplast (trnL-F) evidence. Taxon. 2010;59(1):20–28. doi: 10.2307/27757047. - DOI
MeSH terms
Grants and funding
LinkOut - more resources
Full Text Sources
Miscellaneous
