

Evaluation of tree-based statistical learning methods for constructing genetic risk scores
- PMID: 35313824
- PMCID: PMC8935722
- DOI: 10.1186/s12859-022-04634-w
Evaluation of tree-based statistical learning methods for constructing genetic risk scores
Abstract
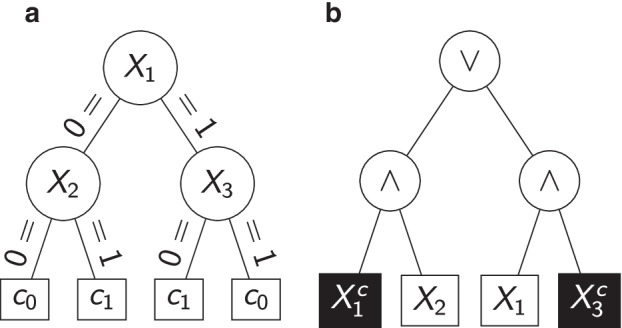
Background: Genetic risk scores (GRS) summarize genetic features such as single nucleotide polymorphisms (SNPs) in a single statistic with respect to a given trait. So far, GRS are typically built using generalized linear models or regularized extensions. However, these linear methods are usually not able to incorporate gene-gene interactions or non-linear SNP-response relationships. Tree-based statistical learning methods such as random forests and logic regression may be an alternative to such regularized-regression-based methods and are investigated in this article. Moreover, we consider modifications of random forests and logic regression for the construction of GRS.
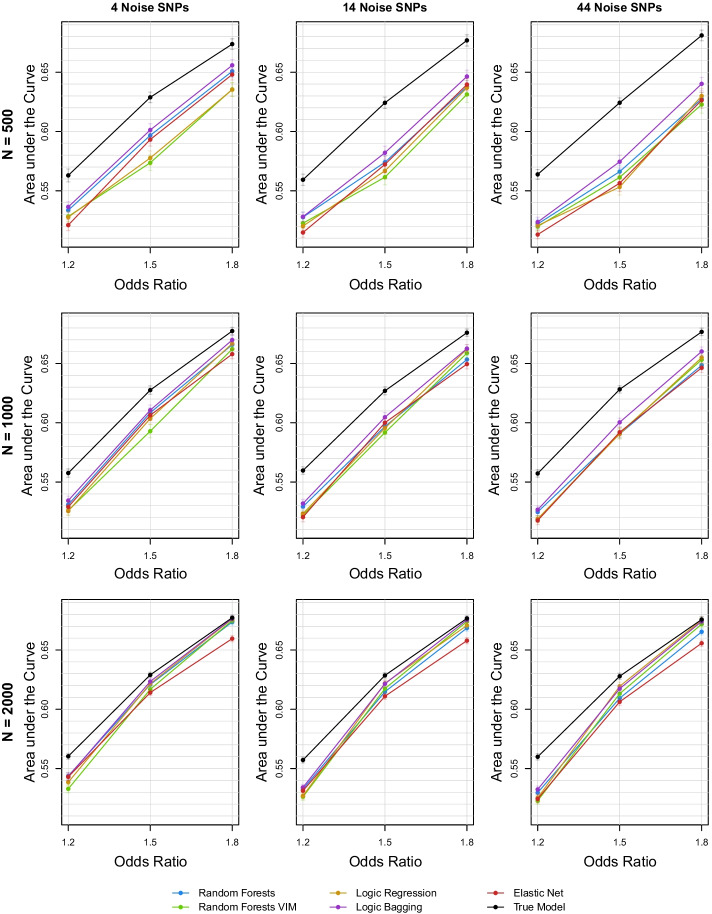
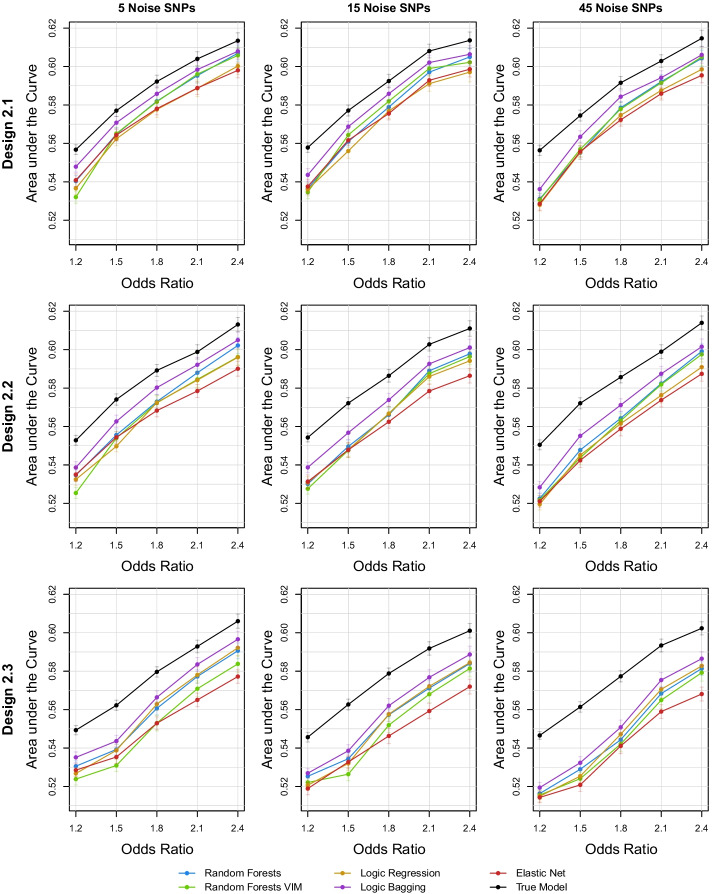
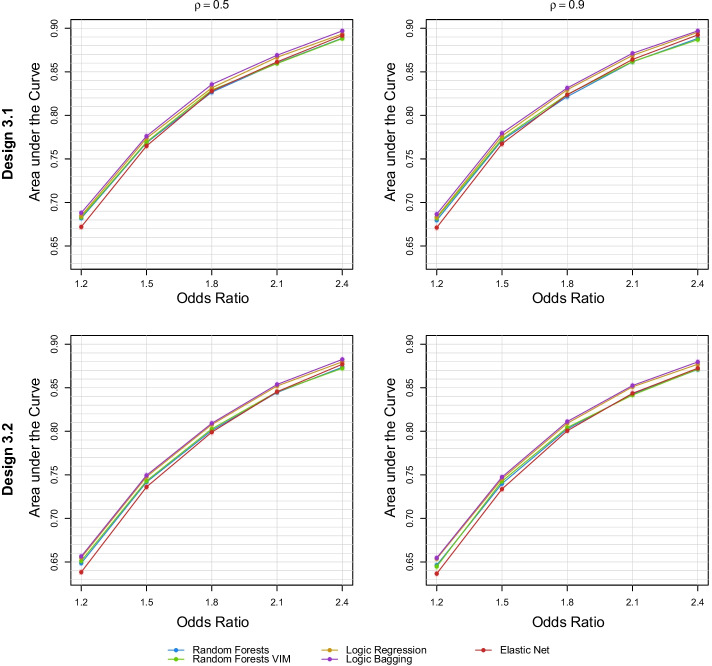
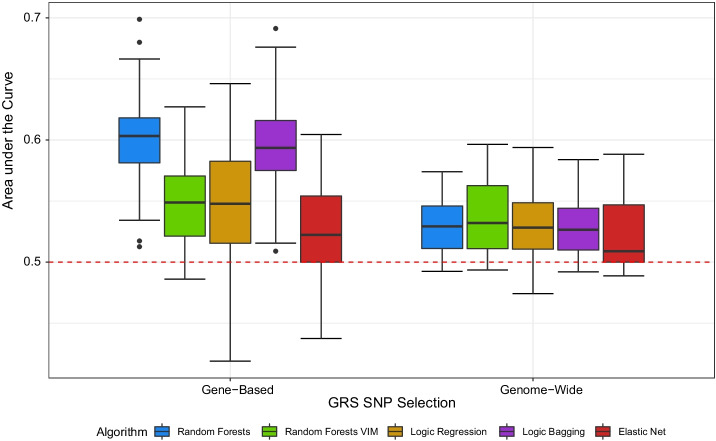
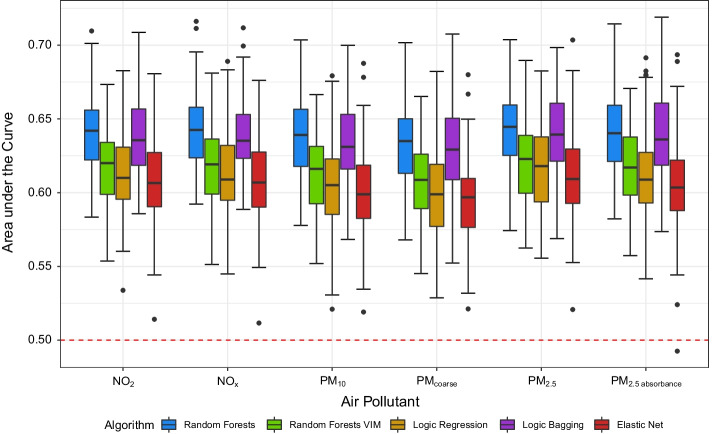
Results: In an extensive simulation study and an application to a real data set from a German cohort study, we show that both tree-based approaches can outperform elastic net when constructing GRS for binary traits. Especially a modification of logic regression called logic bagging could induce comparatively high predictive power as measured by the area under the curve and the statistical power. Even when considering no epistatic interaction effects but only marginal genetic effects, the regularized regression method lead in most cases to inferior results.
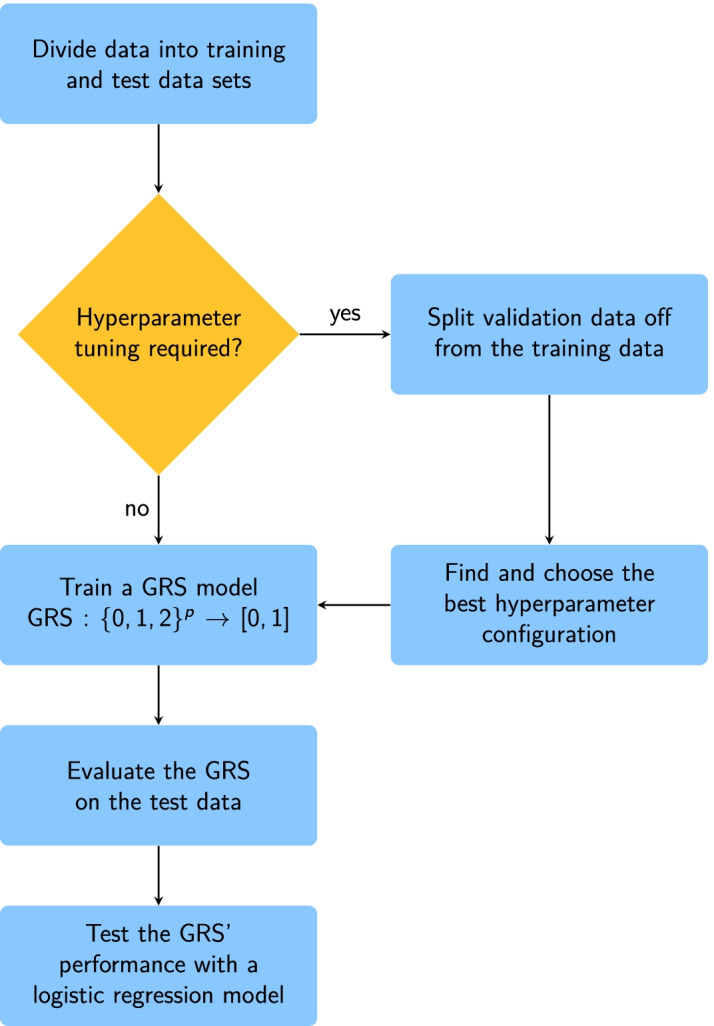
Conclusions: When constructing GRS, we recommend taking random forests and logic bagging into account, in particular, if it can be assumed that possibly unknown epistasis between SNPs is present. To develop the best possible prediction models, extensive joint hyperparameter optimizations should be conducted.
Keywords: Bagging; Elastic net; Epistasis; Logic regression; Polygenic risk scores; Random forests; Simulation study; Statistical learning; Variable selection.
© 2022. The Author(s).
Conflict of interest statement
The authors declare that they have no competing interests.
Figures
Similar articles
-
Efficient gene-environment interaction testing through bootstrap aggregating.Sci Rep. 2023 Jan 17;13(1):937. doi: 10.1038/s41598-023-28172-4. Sci Rep. 2023. PMID: 36650248 Free PMC article.
-
Detection of gene-environment interactions in the presence of linkage disequilibrium and noise by using genetic risk scores with internal weights from elastic net regression.BMC Genet. 2017 Jun 12;18(1):55. doi: 10.1186/s12863-017-0519-1. BMC Genet. 2017. PMID: 28606108 Free PMC article.
-
Comparison of weighting approaches for genetic risk scores in gene-environment interaction studies.BMC Genet. 2017 Dec 16;18(1):115. doi: 10.1186/s12863-017-0586-3. BMC Genet. 2017. PMID: 29246113 Free PMC article.
-
Methods for identifying SNP interactions: a review on variations of Logic Regression, Random Forest and Bayesian logistic regression.IEEE/ACM Trans Comput Biol Bioinform. 2011 Nov-Dec;8(6):1580-91. doi: 10.1109/TCBB.2011.46. IEEE/ACM Trans Comput Biol Bioinform. 2011. PMID: 21383421 Review.
-
Brief review of regression-based and machine learning methods in genetic epidemiology: the Genetic Analysis Workshop 17 experience.Genet Epidemiol. 2011;35 Suppl 1(Suppl 1):S5-11. doi: 10.1002/gepi.20642. Genet Epidemiol. 2011. PMID: 22128059 Free PMC article. Review.
Cited by
-
Machine Learning to Advance Human Genome-Wide Association Studies.Genes (Basel). 2023 Dec 25;15(1):34. doi: 10.3390/genes15010034. Genes (Basel). 2023. PMID: 38254924 Free PMC article. Review.
-
Transfer learning with false negative control improves polygenic risk prediction.PLoS Genet. 2023 Nov 27;19(11):e1010597. doi: 10.1371/journal.pgen.1010597. eCollection 2023 Nov. PLoS Genet. 2023. PMID: 38011285 Free PMC article.
-
Efficient gene-environment interaction testing through bootstrap aggregating.Sci Rep. 2023 Jan 17;13(1):937. doi: 10.1038/s41598-023-28172-4. Sci Rep. 2023. PMID: 36650248 Free PMC article.
-
From Data to Cure: A Comprehensive Exploration of Multi-omics Data Analysis for Targeted Therapies.Mol Biotechnol. 2025 Apr;67(4):1269-1289. doi: 10.1007/s12033-024-01133-6. Epub 2024 Apr 2. Mol Biotechnol. 2025. PMID: 38565775 Free PMC article. Review.
References
-
- Torkamani A, Wineinger NE, Topol EJ. The personal and clinical utility of polygenic risk scores. Nat Rev Genet. 2018;19(9):581–590. - PubMed
-
- Wray NR, Lin T, Austin J, McGrath JJ, Hickie IB, Murray GK, et al. From basic science to clinical application of polygenic risk scores: a primer. JAMA Psychiat. 2021;78(1):101–109. - PubMed
MeSH terms
LinkOut - more resources
Full Text Sources
