

Functional principal component analysis for identifying the child growth pattern using longitudinal birth cohort data
- PMID: 35313828
- PMCID: PMC8935724
- DOI: 10.1186/s12874-022-01566-0
Functional principal component analysis for identifying the child growth pattern using longitudinal birth cohort data
Abstract
Background: Longitudinal studies are important to understand patterns of growth in children and limited in India. It is important to identify an approach for characterising growth trajectories to distinguish between children who have healthy growth and those growth is poor. Many statistical approaches are available to assess the longitudinal growth data and which are difficult to recognize the pattern. In this research study, we employed functional principal component analysis (FPCA) as a statistical method to find the pattern of growth data. The purpose of this study is to describe the longitudinal child growth trajectory pattern under 3 years of age using functional principal component method.
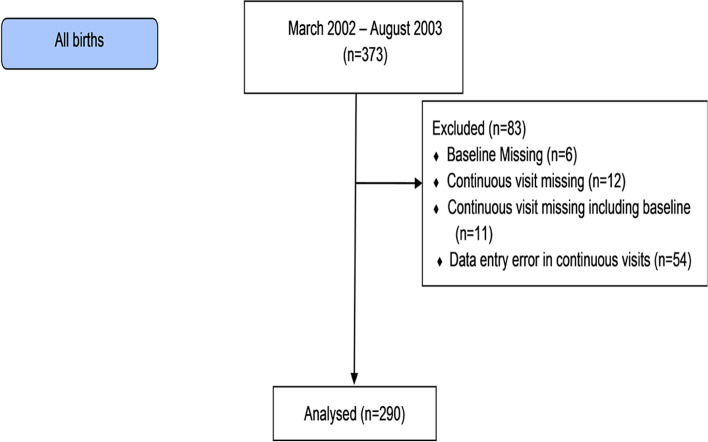
Methods: Children born between March 2002 and August 2003 (n = 290) were followed until their third birthday in three neighbouring slums in Vellore, South India. Field workers visited homes to collect details of morbidity twice a week. Height and weight were measured monthly from 1 month of age in a study-run clinic. Longitudinal child growth trajectory pattern were extracted using Functional Principal Component analysis using B-spline basis functions with smoothing parameters. Functional linear model was used to assess the factors association with the growth functions.
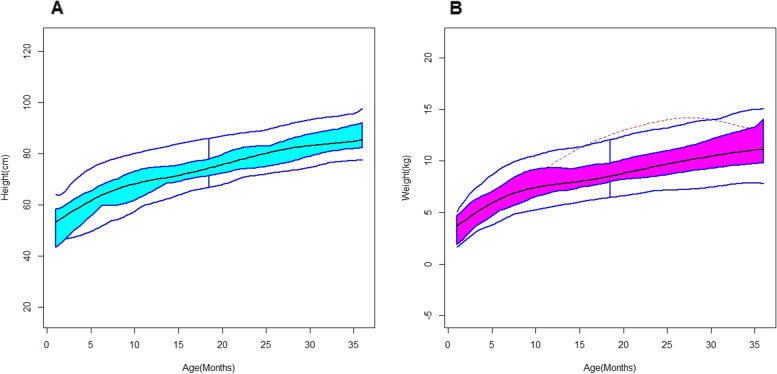
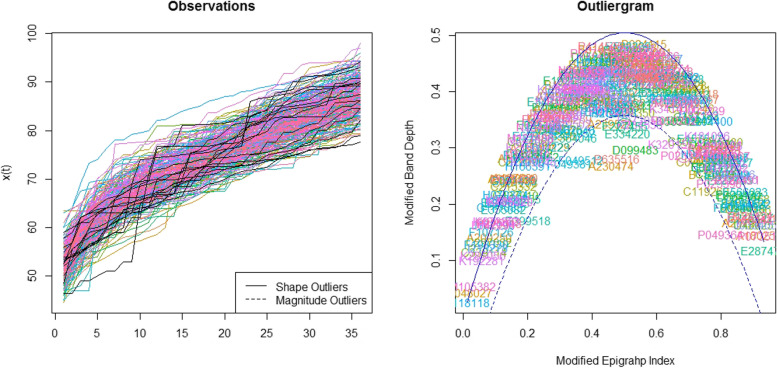
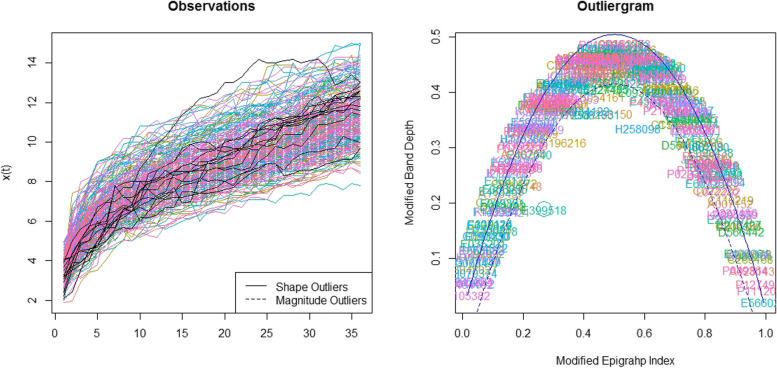
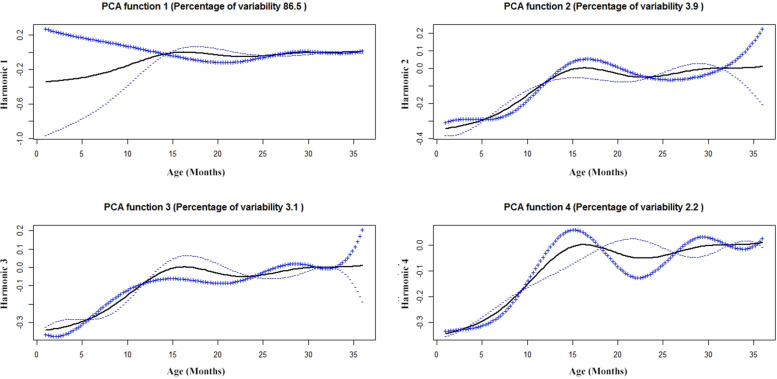
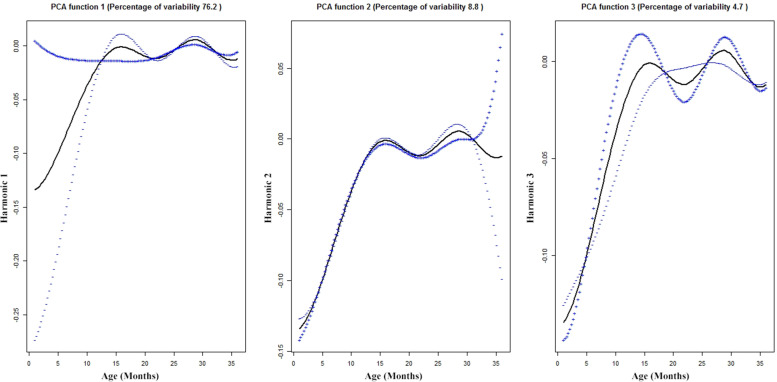
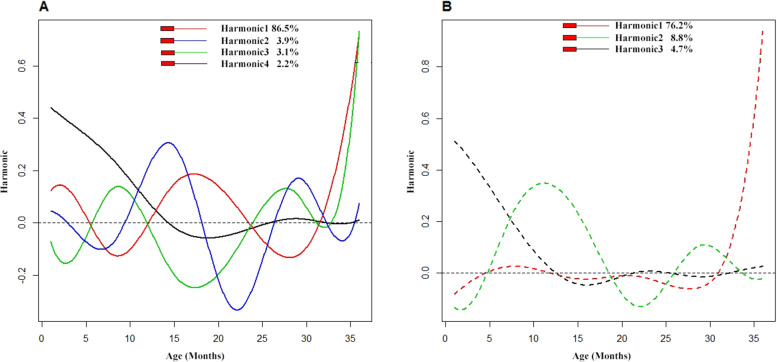
Results: We have obtained four FPCs explained by 86.5, 3.9, 3.1 and 2.2% of the variation respectively for the height functions. For height, 38% of the children's had poor growth trajectories. Similarly, three FPCs explained 76.2, 8.8, and 4.7% respectively for the weight functions and 44% of the children's had poor growth in their weight trajectories. Results show that gender, socio-economic status, parent's education, breast feeding, and gravida are associated and, influence the growth pattern in children.
Conclusions: The FPC approach deals with subjects' dynamics of growth and not with specific values at given times. FPC could be a better alternate approach for both dimension reduction and pattern detection. FPC may be used to offer greater insight for classification.
Keywords: Child growth; Cohort; Functional principal component analysis; Longitudinal; Urban slums.
© 2022. The Author(s).
Conflict of interest statement
The authors declare that they have no competing interests.
Figures
References
-
- Walker SP, Wachs TD, Gardner JM, Lozoff B, Wasserman GA, Pollitt E, et al. Child development: risk factors for adverse outcomes in developing countries. Lancet. 2007;369:145–157. - PubMed
Publication types
MeSH terms
Grants and funding
LinkOut - more resources
Full Text Sources
