

Using biological information to analyze potential miRNA-mRNA regulatory networks in the plasma of patients with non-small cell lung cancer
- PMID: 35313857
- PMCID: PMC8939143
- DOI: 10.1186/s12885-022-09281-1
Using biological information to analyze potential miRNA-mRNA regulatory networks in the plasma of patients with non-small cell lung cancer
Abstract
Background: Lung cancer is the most common malignant tumor, and it has a high mortality rate. However, the study of miRNA-mRNA regulatory networks in the plasma of patients with non-small cell lung cancer (NSCLC) is insufficient. Therefore, this study explored the differential expression of mRNA and miRNA in the plasma of NSCLC patients.
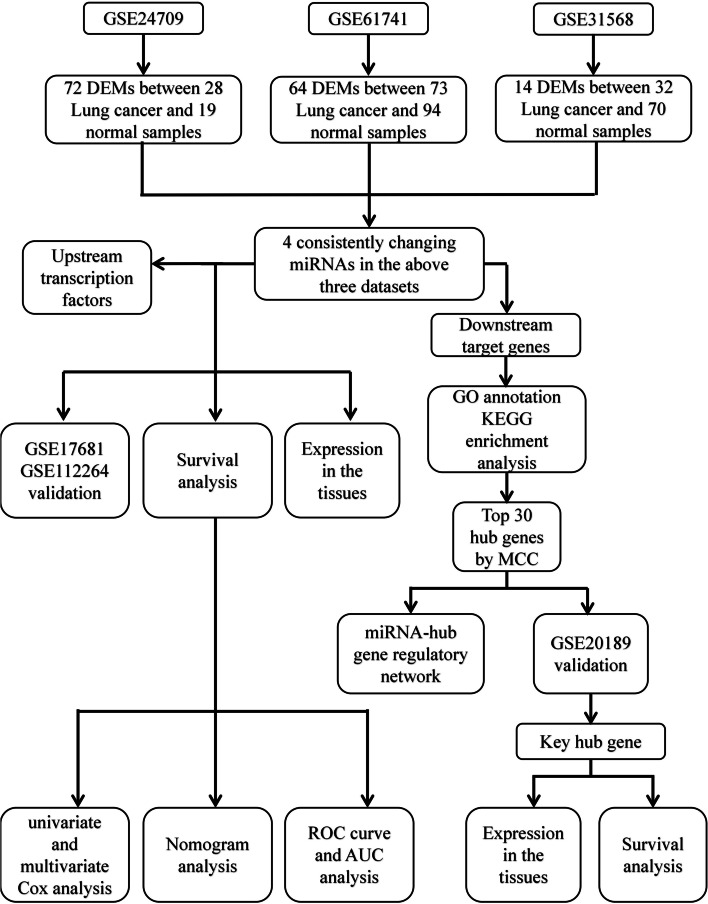
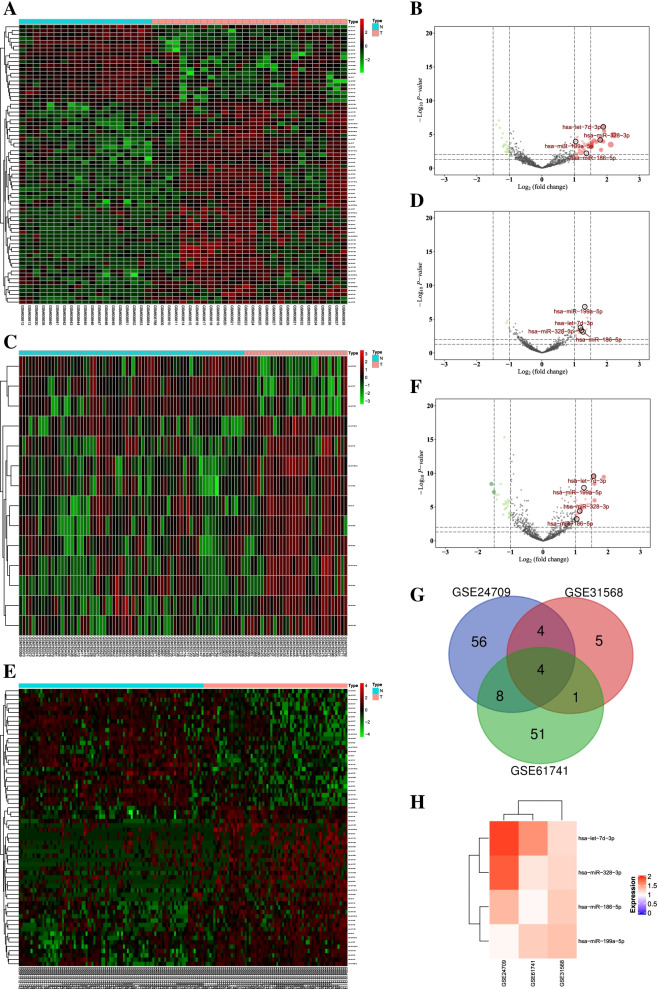
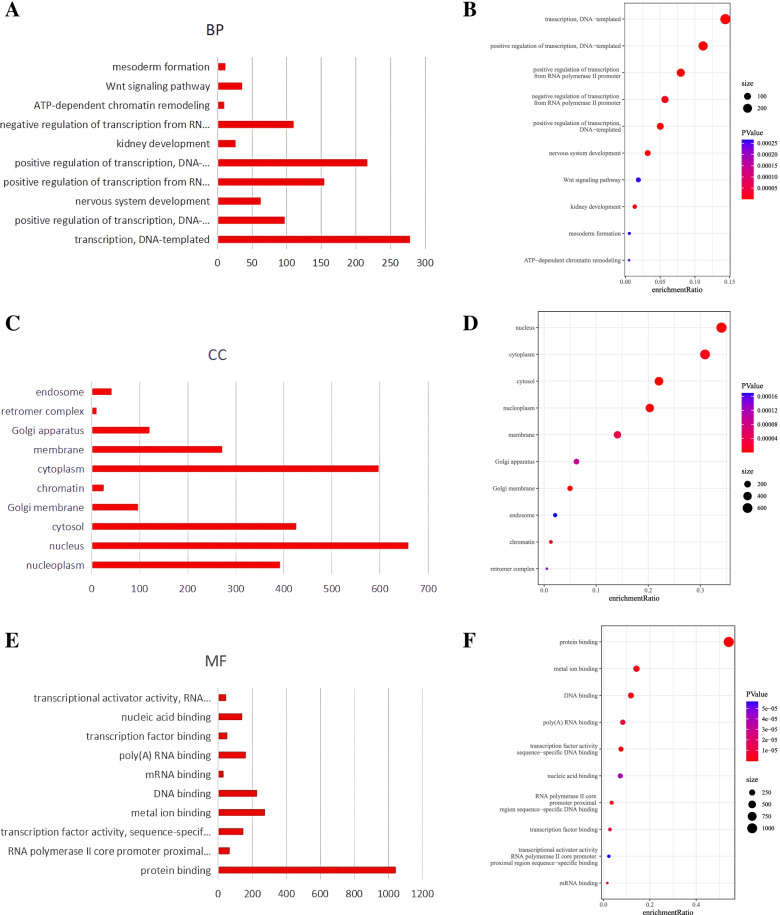
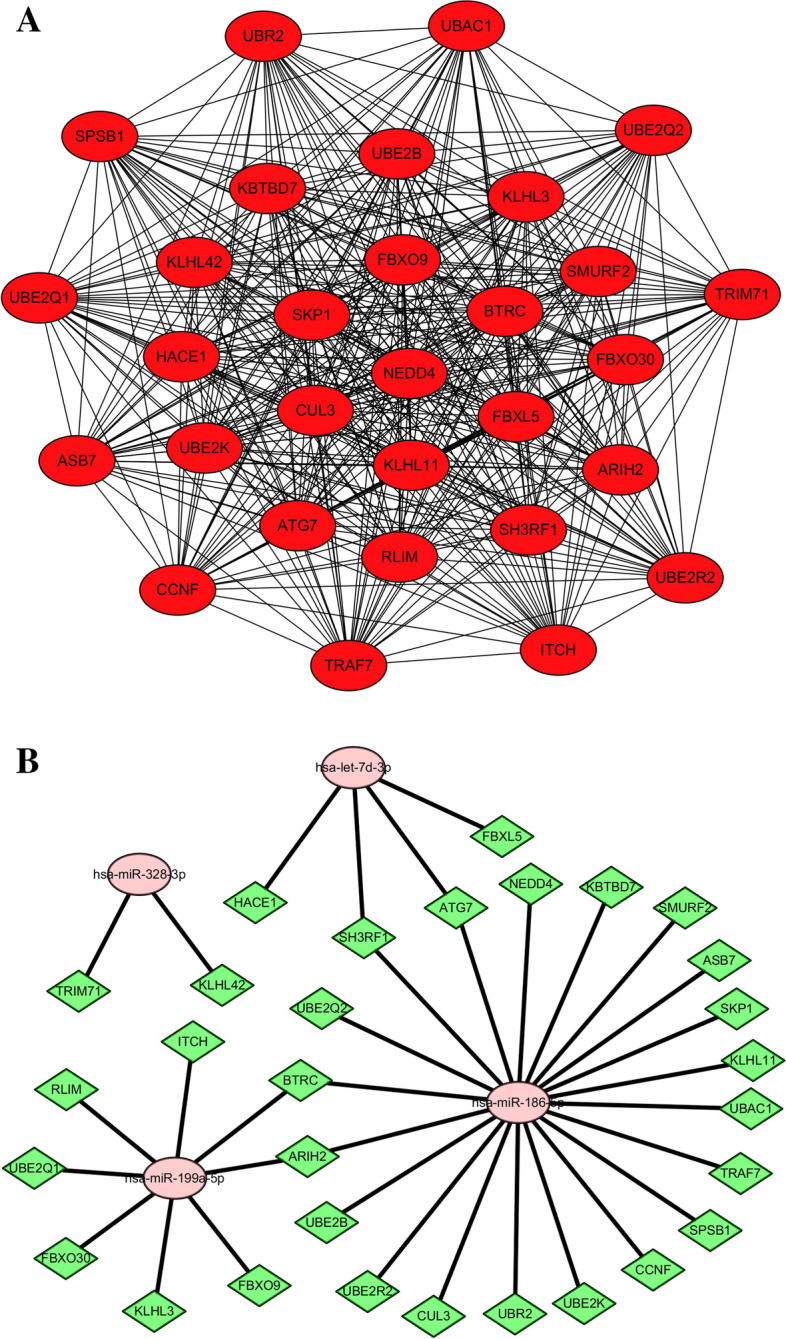
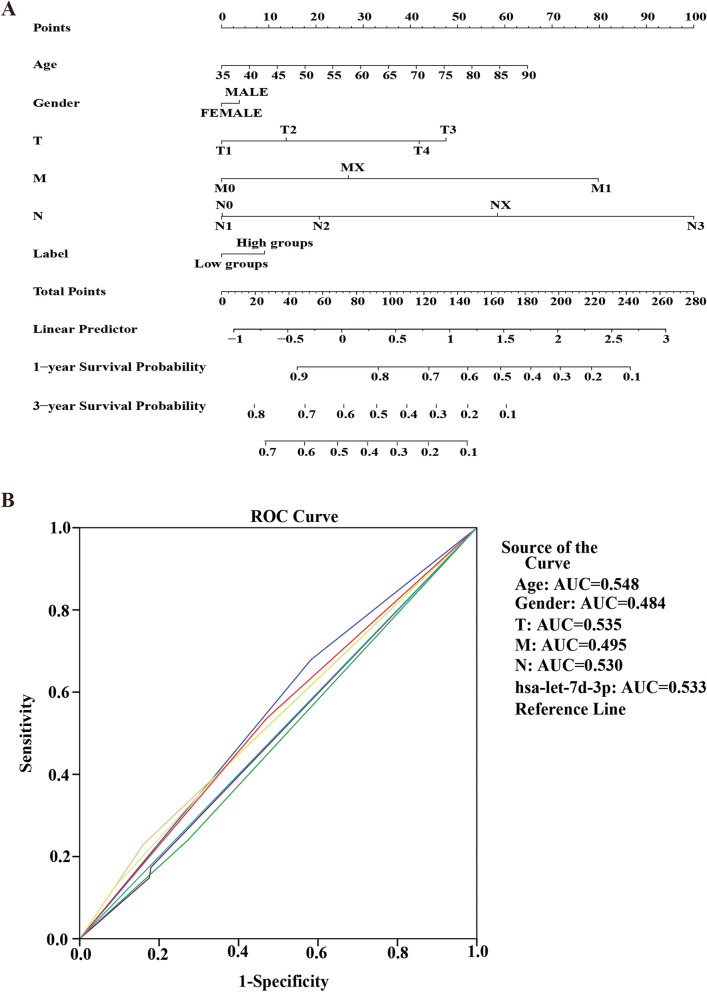
Methods: The Gene Expression Omnibus (GEO) database was used to download microarray datasets, and the differentially expressed miRNAs (DEMs) were analyzed. We predicted transcription factors and target genes of the DEMs by using FunRich software and the TargetScanHuman database, respectively. The Database for Annotation, Visualization, and Integrated Discovery (DAVID) was used for GO annotation and KEGG enrichment analysis of downstream target genes. We constructed protein-protein interaction (PPI) and DEM-hub gene networks using the STRING database and Cytoscape software. The GSE20189 dataset was used to screen out the key hub gene. Using The Cancer Genome Atlas (TCGA) and UALCAN databases to analyze the expression and prognosis of the key hub gene and DEMs. Then, GSE17681 and GSE137140 datasets were used to validate DEMs expression. Finally, the receiver operating characteristic (ROC) curve was used to verify the ability of the DEMs to distinguish lung cancer patients from healthy patients.
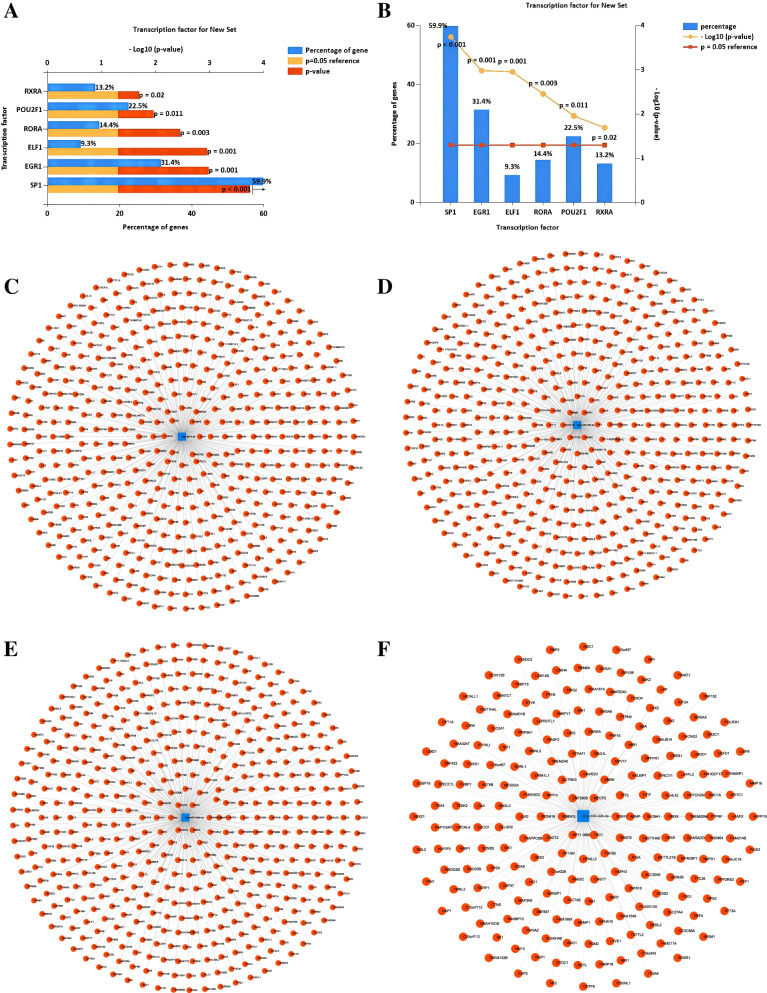
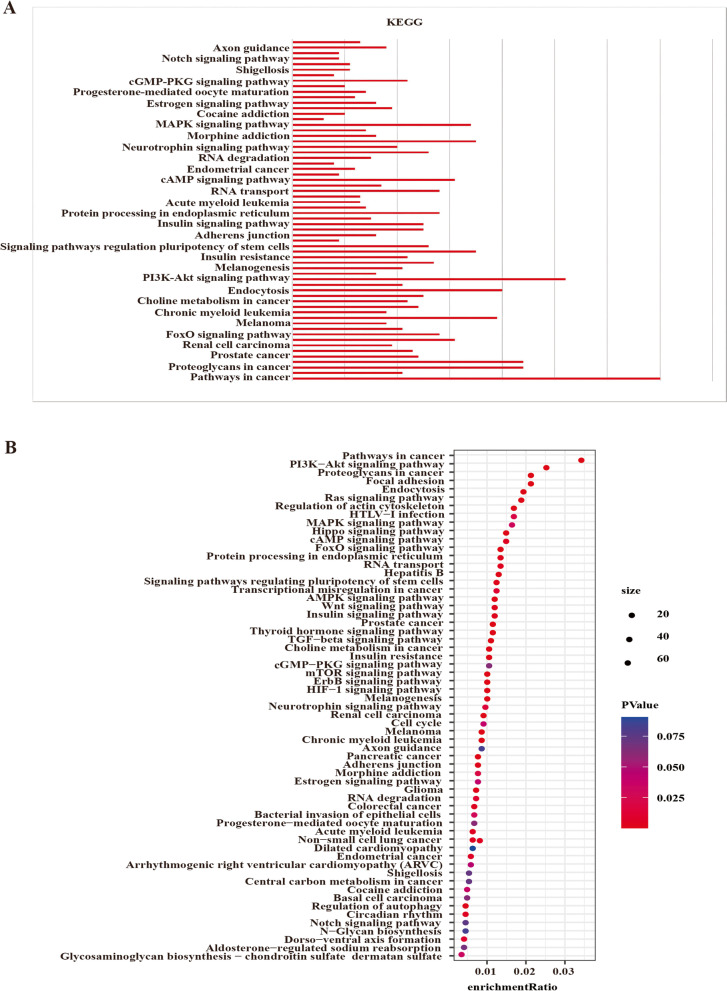
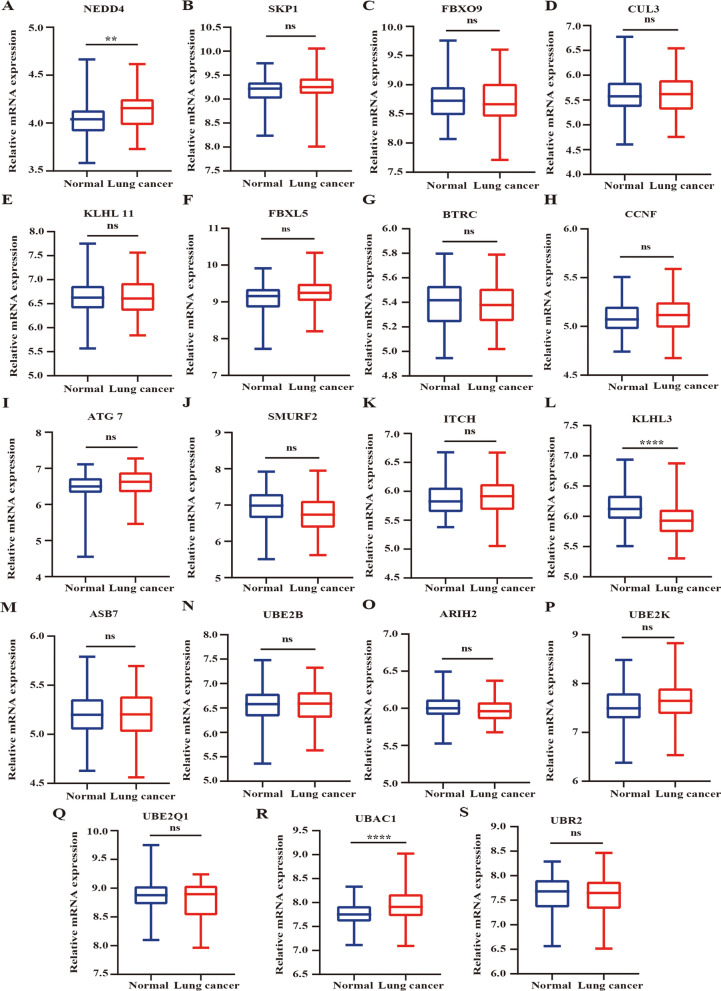
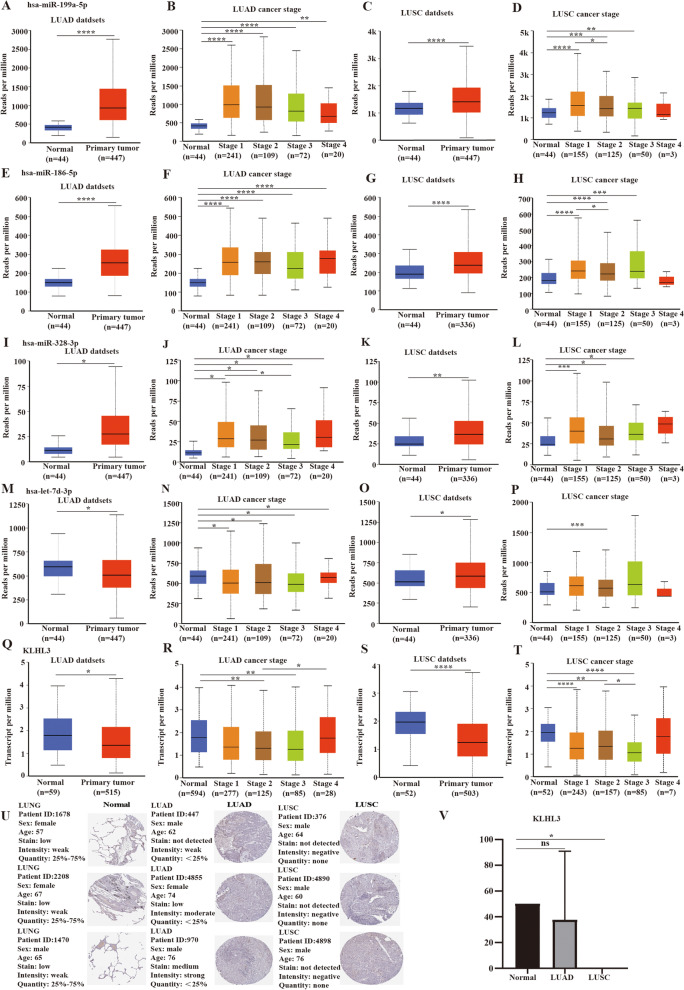
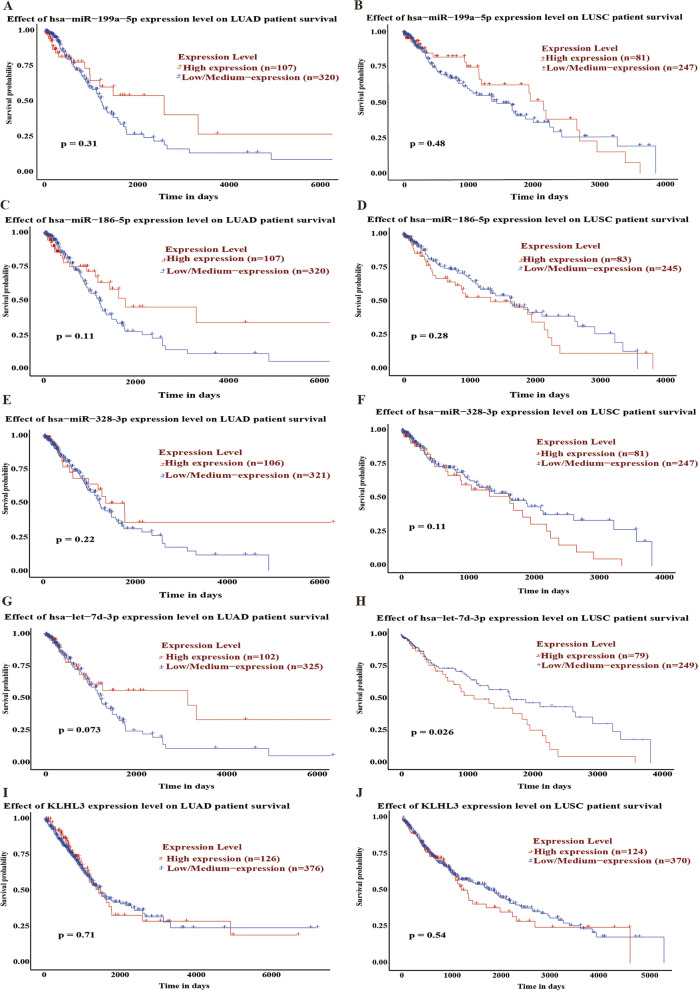
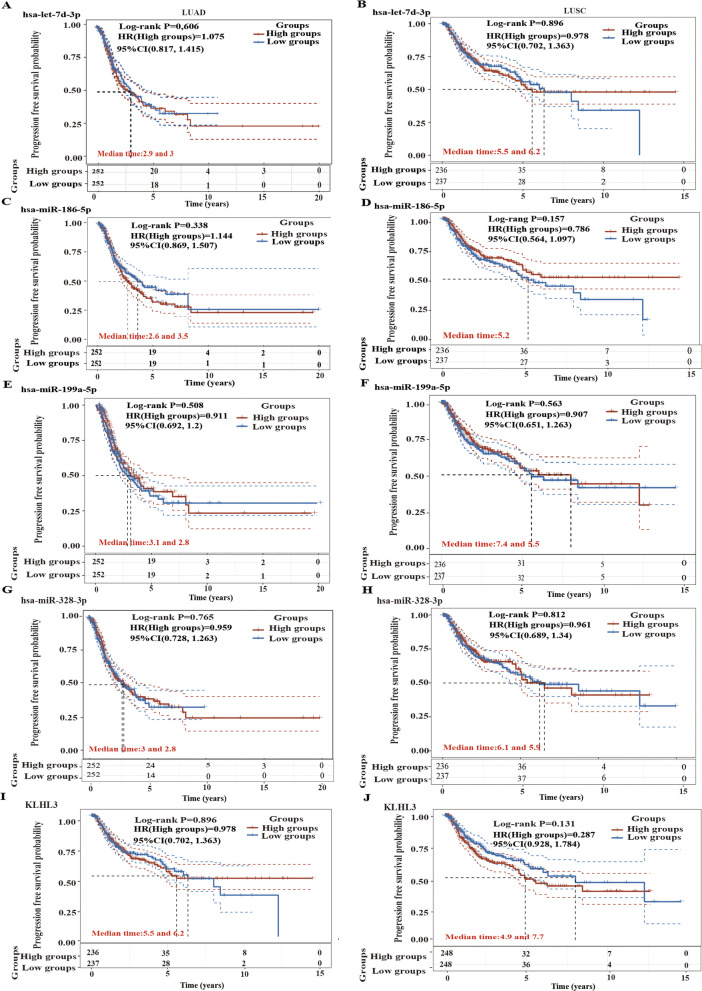
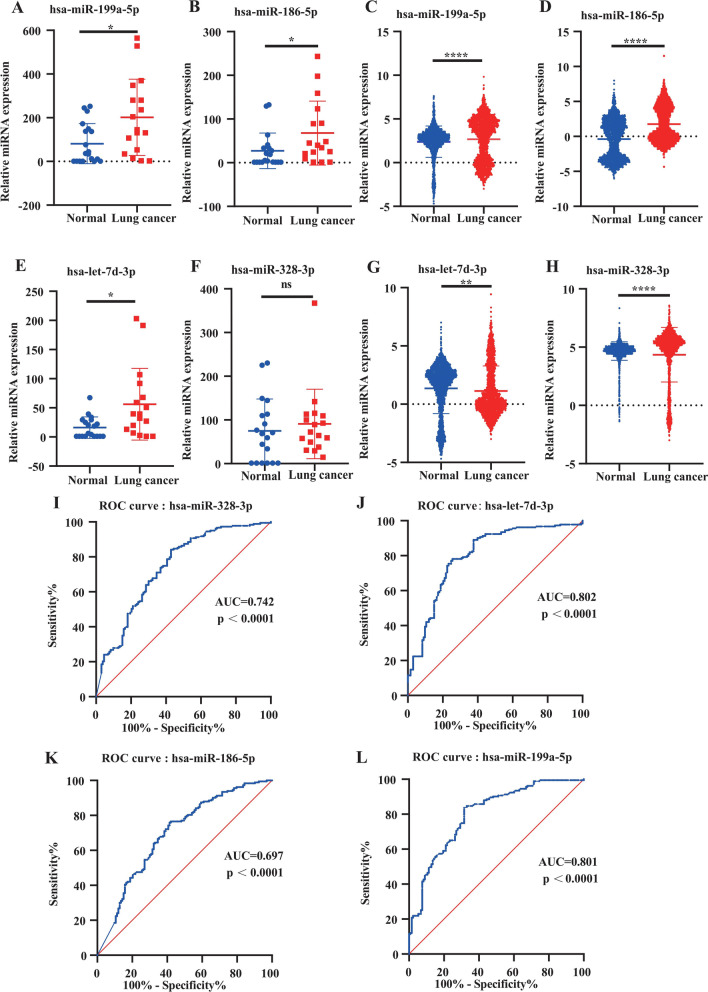
Results: Four upregulated candidate DEMs (hsa-miR199a-5p, hsa-miR-186-5p, hsa-miR-328-3p, and hsa-let-7d-3p) were screened from 3 databases, and 6 upstream transcription factors and 2253 downstream target genes were predicted. These genes were mainly enriched in cancer pathways and PI3k-Akt pathways. Among the top 30 hub genes, the expression of KLHL3 was consistent with the GSE20189 dataset. Except for let-7d-3p, the expression of other DEMs and KLHL3 in tissues were consistent with those in plasma. LUSC patients with high let-7d-3p expression had poor overall survival rates (OS). External validation demonstrated that the expression of hsa-miR-199a-5p and hsa-miR-186-5p in peripheral blood of NSCLC patients was higher than the healthy controls. The ROC curve confirmed that the DEMs could better distinguish lung cancer patients from healthy people.
Conclusion: The results showed that miR-199a-5p and miR-186-5p may be noninvasive diagnostic biomarkers for NSCLC patients. MiR-199a-5p-KLHL3 may be involved in the occurrence and development of NSCLC.
Keywords: Bioinformatics; Non-small cell lung cancer; miRNA-mRNA regulatory network; microRNA.
© 2022. The Author(s).
Conflict of interest statement
All authors agreed to publish the paper and there was no conflict of interest.
Figures
Similar articles
-
Construction of Potential miRNA-mRNA Regulatory Network in COPD Plasma by Bioinformatics Analysis.Int J Chron Obstruct Pulmon Dis. 2020 Sep 10;15:2135-2145. doi: 10.2147/COPD.S255262. eCollection 2020. Int J Chron Obstruct Pulmon Dis. 2020. PMID: 32982206 Free PMC article.
-
Identification of key microRNAs and hub genes in non-small-cell lung cancer using integrative bioinformatics and functional analyses.J Cell Biochem. 2020 Mar;121(3):2690-2703. doi: 10.1002/jcb.29489. Epub 2019 Nov 6. J Cell Biochem. 2020. PMID: 31692035
-
Microarray data analysis on gene and miRNA expression to identify biomarkers in non-small cell lung cancer.BMC Cancer. 2020 Apr 16;20(1):329. doi: 10.1186/s12885-020-06829-x. BMC Cancer. 2020. PMID: 32299382 Free PMC article.
-
Identification of differentially expressed circulating serum microRNA for the diagnosis and prognosis of Indian non-small cell lung cancer patients.Curr Probl Cancer. 2020 Aug;44(4):100540. doi: 10.1016/j.currproblcancer.2020.100540. Epub 2020 Jan 23. Curr Probl Cancer. 2020. PMID: 32007320 Review.
-
Common gene signatures and key pathways in hypopharyngeal and esophageal squamous cell carcinoma: Evidence from bioinformatic analysis.Medicine (Baltimore). 2020 Oct 16;99(42):e22434. doi: 10.1097/MD.0000000000022434. Medicine (Baltimore). 2020. PMID: 33080677 Free PMC article.
Cited by
-
LINC02323 facilitates development of lung squamous cell carcinoma by miRNA sponge and RBP dysregulation and links to poor prognosis.Thorac Cancer. 2023 Feb;14(4):407-418. doi: 10.1111/1759-7714.14760. Epub 2022 Dec 14. Thorac Cancer. 2023. PMID: 36516959 Free PMC article.
-
Identification of a novel circRNA-miRNA-mRNA regulatory axis in hepatocellular carcinoma based on bioinformatics analysis.Sci Rep. 2023 Mar 6;13(1):3728. doi: 10.1038/s41598-023-30567-2. Sci Rep. 2023. PMID: 36878930 Free PMC article.
-
Integration of miRNA expression analysis of purified leukocytes and whole blood reveals blood-borne candidate biomarkers for lung cancer.Epigenetics. 2024 Dec;19(1):2393948. doi: 10.1080/15592294.2024.2393948. Epub 2024 Aug 20. Epigenetics. 2024. PMID: 39164937 Free PMC article.
-
A united model for diagnosing pulmonary tuberculosis with random forest and artificial neural network.Front Genet. 2023 Mar 9;14:1094099. doi: 10.3389/fgene.2023.1094099. eCollection 2023. Front Genet. 2023. PMID: 36968608 Free PMC article.
-
Bioinformatic Analysis Identifies of Potential miRNA-mRNA Regulatory Networks Involved in the Pathogenesis of Lung Cancer.Comput Intell Neurosci. 2022 Sep 30;2022:6295934. doi: 10.1155/2022/6295934. eCollection 2022. Comput Intell Neurosci. 2022. PMID: 36211008 Free PMC article.
References
-
- Ferlay J, Colombet M, Soerjomataram I, et al. Estimating the global cancer incidence and mortality in 2018: GLOBOCAN sources and methods. Int J Cancer. 2019;144(8):1941–1953. - PubMed
-
- Woodman C, Vundu G, George A, et al. Applications and strategies in nanodiagnosis and nanotherapy in lung cancer. Semin Cancer Biol. 2020;S1044-579X(20):30042. - PubMed
-
- Miller KD, Nogueira L, Mariotto AB, et al. Cancer treatment and survivorship statistics, 2019. CA Cancer J Clin. 2019;69(5):363–385. - PubMed
MeSH terms
Substances
LinkOut - more resources
Full Text Sources
Medical
