

NMR-based metabonomics reveals the dynamic effect of electro-acupuncture on central nervous system in gastric mucosal lesions (GML) rats
- PMID: 35313919
- PMCID: PMC8935774
- DOI: 10.1186/s13020-022-00593-9
NMR-based metabonomics reveals the dynamic effect of electro-acupuncture on central nervous system in gastric mucosal lesions (GML) rats
Abstract
Background: Gastric mucosal lesions (GML) are common in gastric diseases and seriously affect the quality of life. There are inevitable side effects in drug therapy. Acupuncture is an important part of traditional Chinese medicine. Electro-acupuncture (EA) has unique curative effect in treatment of GML. However, there are still few reports on the central mechanism of electro-acupuncture in treatment of GML. In this study, NMR metabonomics was used to explore the central metabolic change mechanism of electro-acupuncture in treatment of GML.
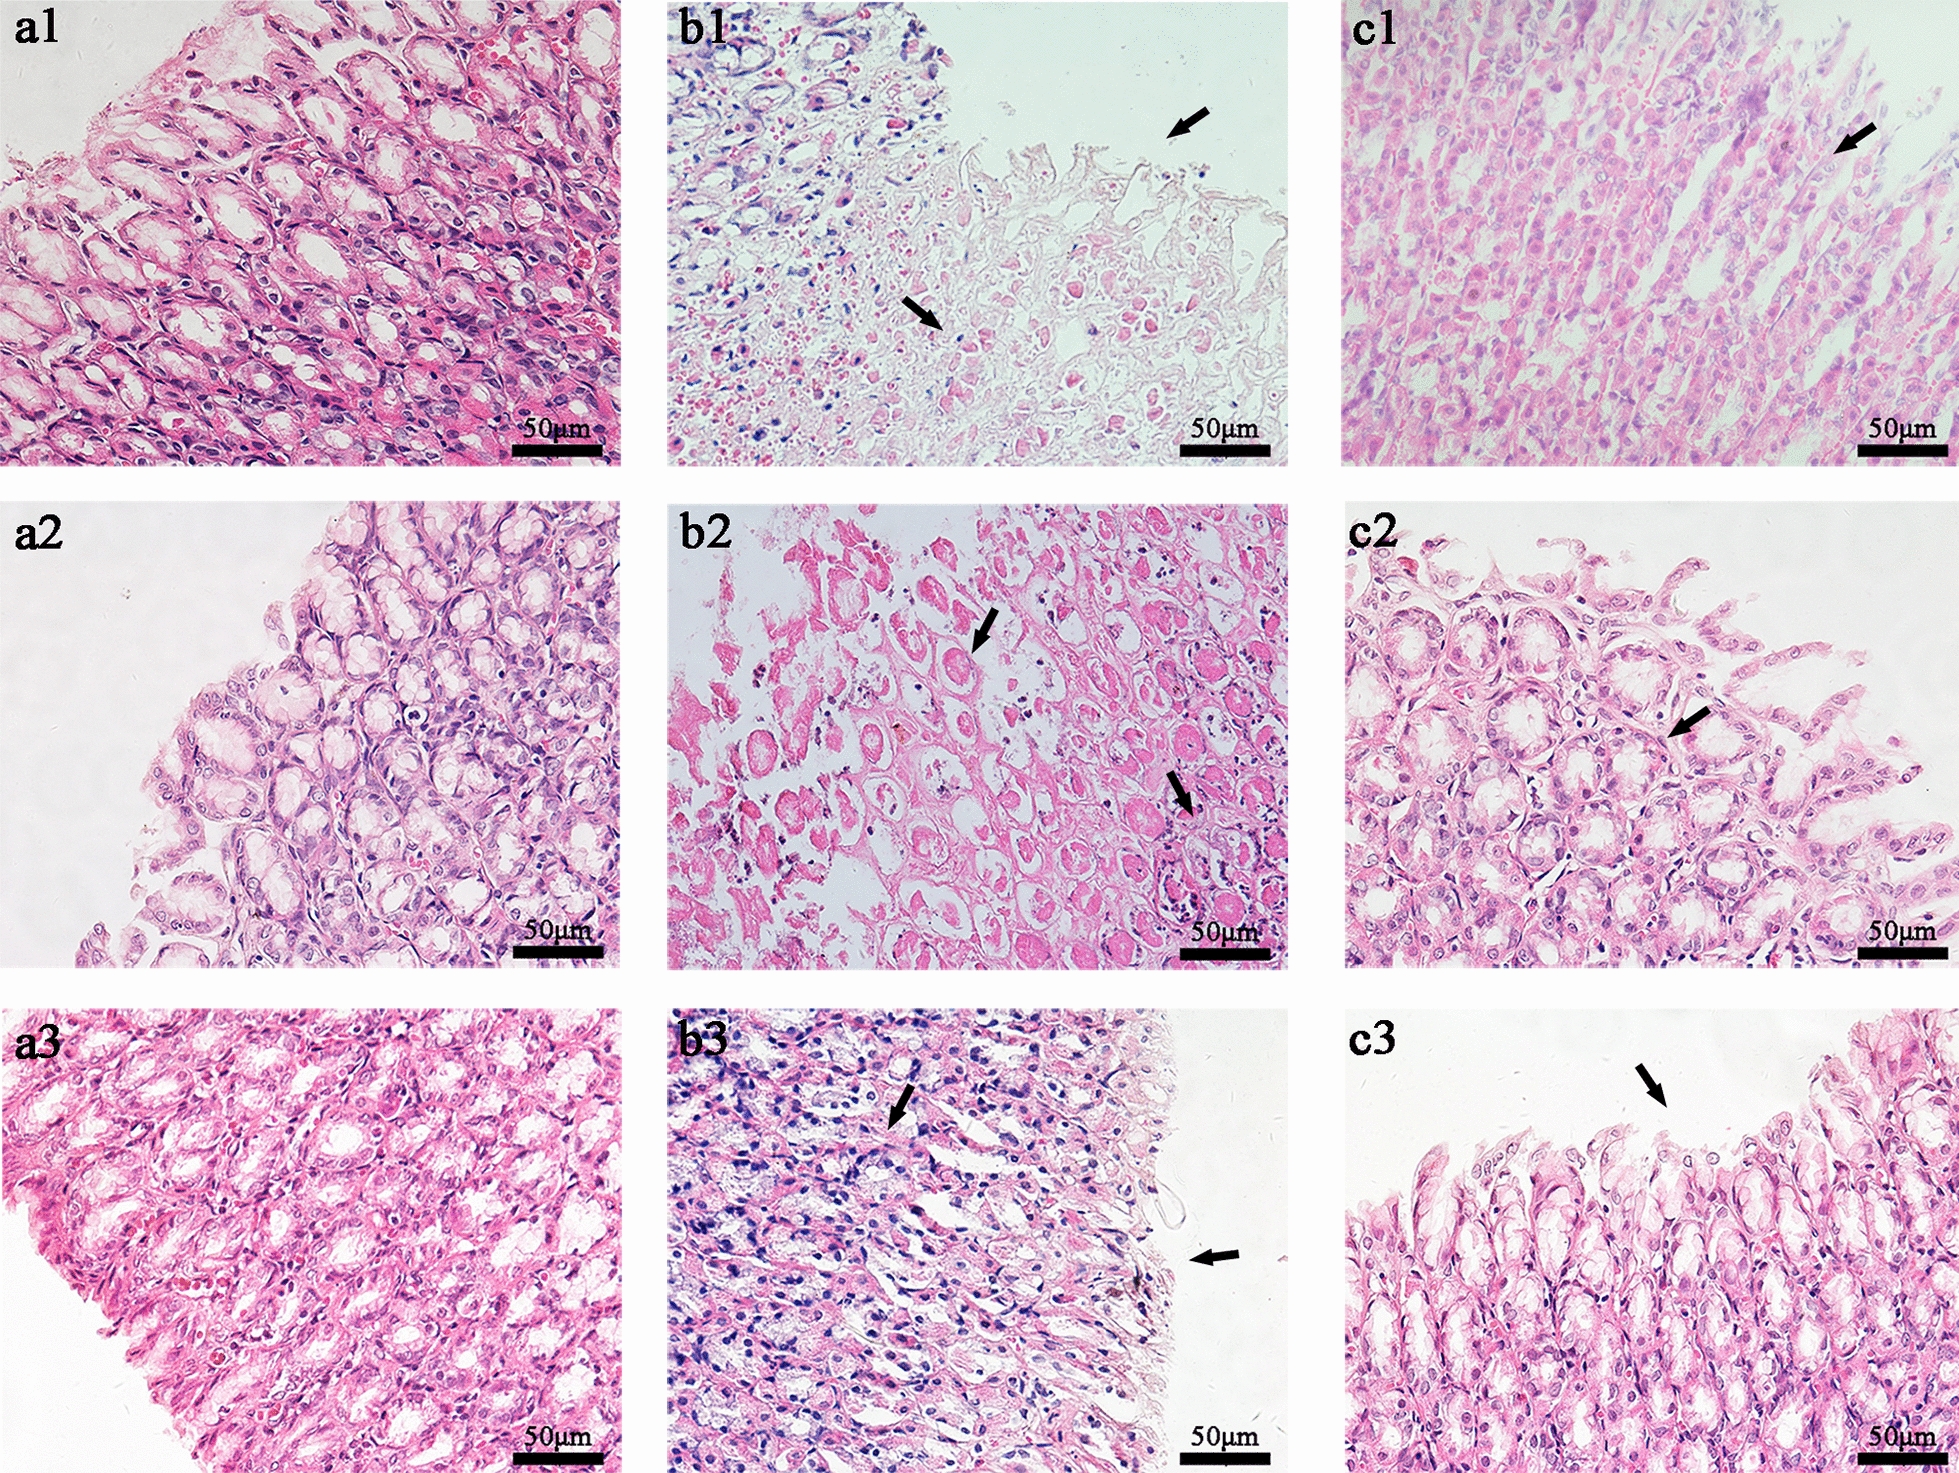
Methods: SD rats were randomly divided into Control, GML and EA groups. According to different intervention time, each group was further divided into 3 subgroups. This study mainly established GML model rats by 75% ethanol. Dynamic expressions of metabolites in cerebral cortex and medulla were observed by 1D 1H Nuclear Magnetic Resonance (NMR) metabolomics, combined with gastric mucosal histopathological examination to evaluate the time-effect relationship of electro-acupuncture at Zusanli (ST36) and Liangmen (ST21) points for 1 day, 4 days and 7 days treatment of GML.
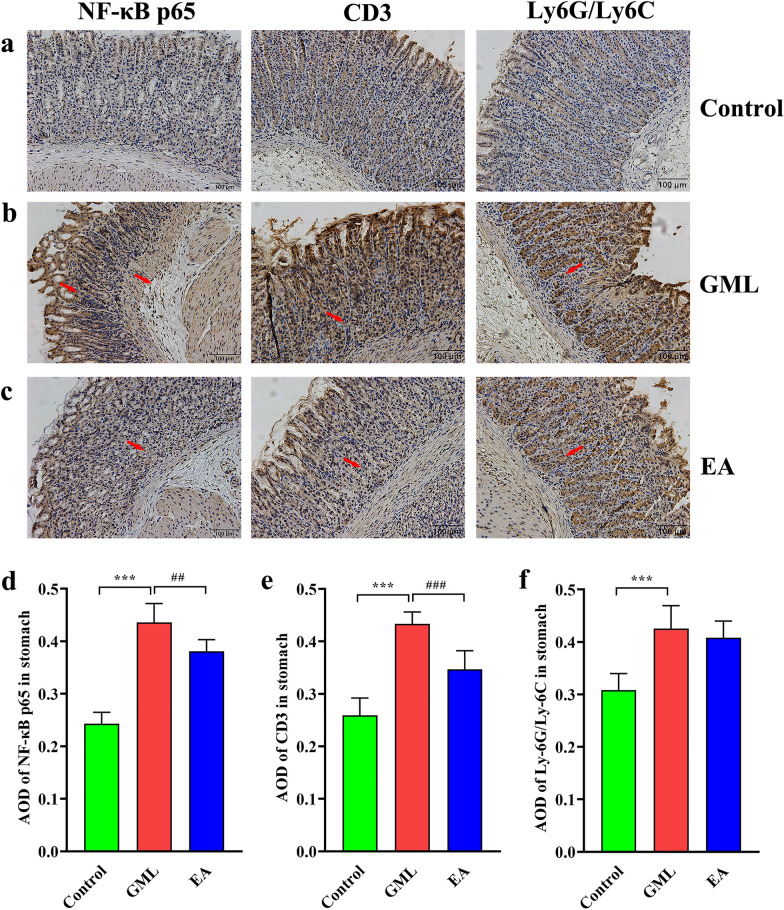
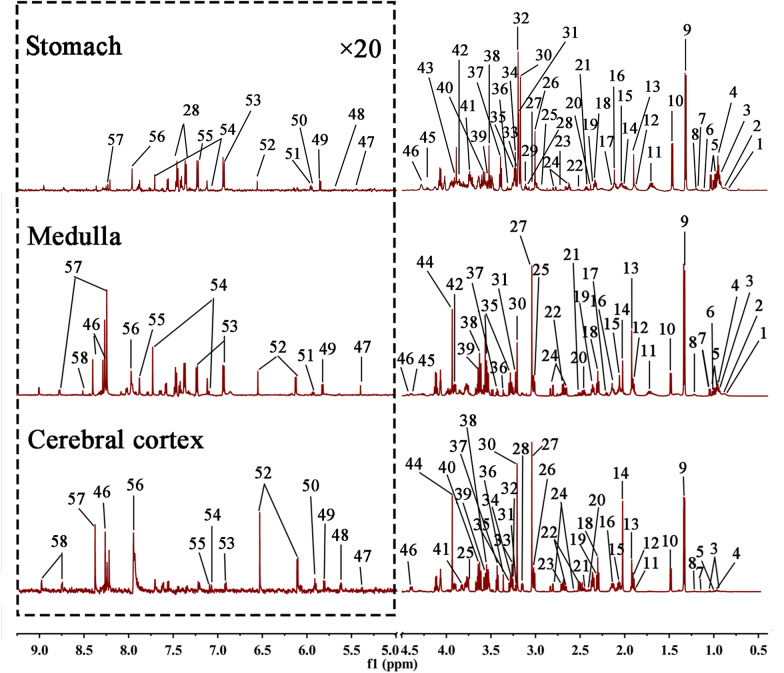
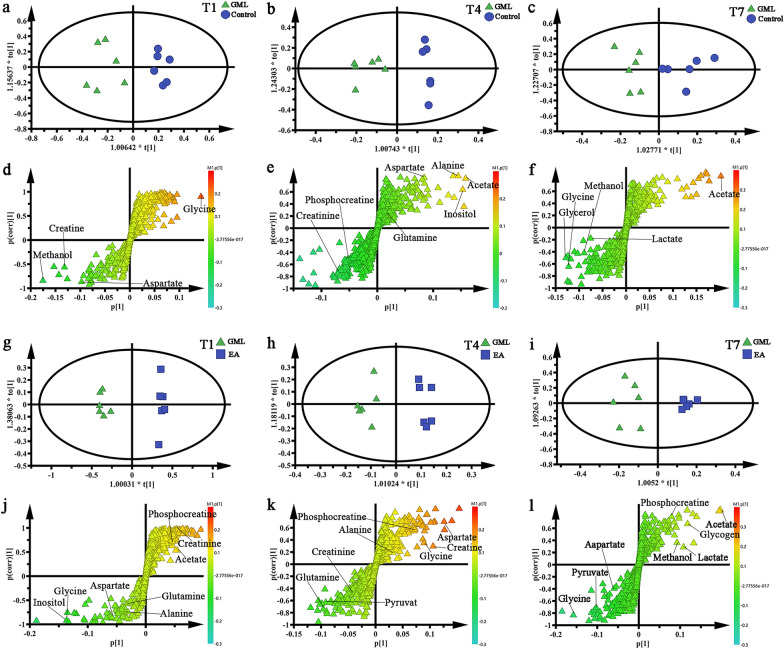
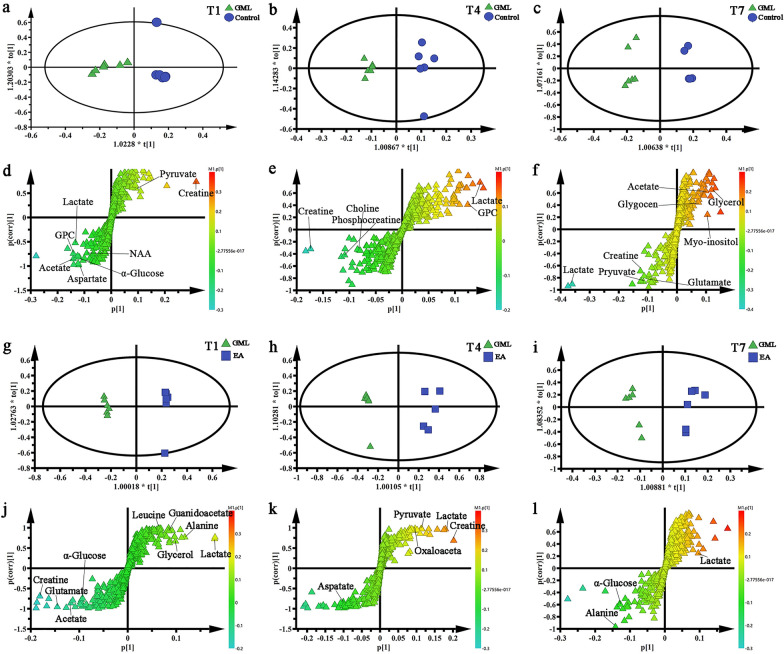
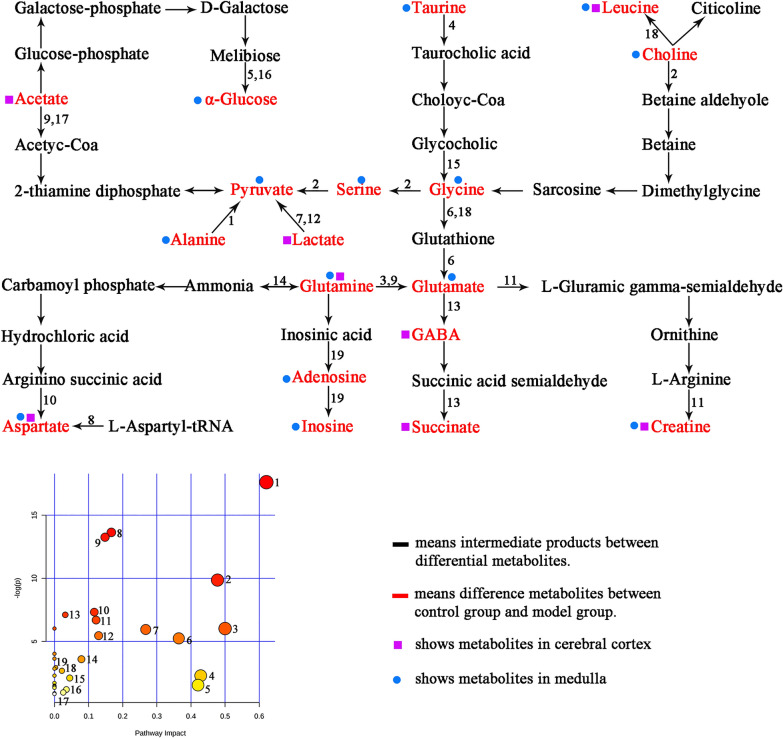
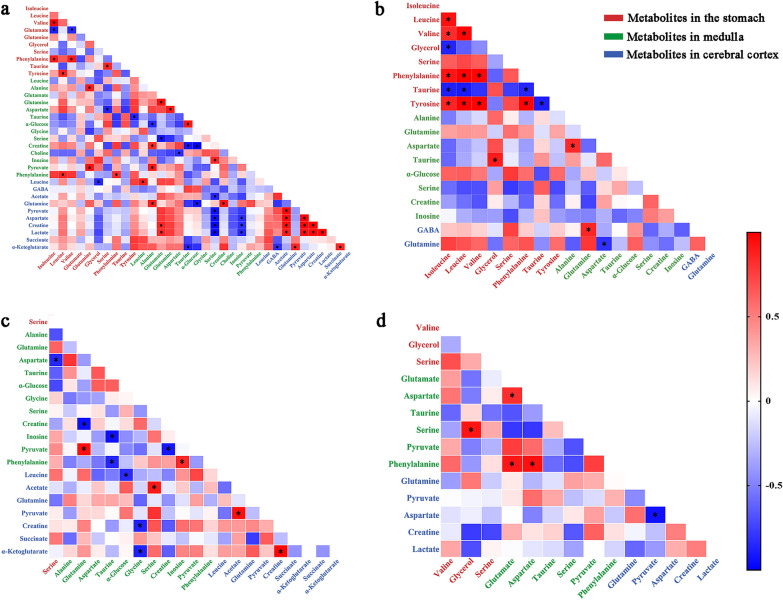
Results: The results showed that the repair effect of electro-acupuncture on gastric mucosal injury was the most obvious in 4 days and stable in 7 days, and 4 days electro-acupuncture can effectively inhibit GML gastric mucosal inflammation and the expression of inflammatory cells. Meanwhile, the NMR spectrum results of medulla and cerebral cortex showed that, 21 potential metabolites were identified to participate in the mechanism of pathogenesis of GML and the regulation of electro-acupuncture, including 15 in medulla and 10 in cerebral cortex. Metabolic pathway analysis showed that the differential metabolites involved 19 metabolic pathways, which could be divided into energy, neurotransmitters, cells and cell membrane and antioxidation according to their functions. The correlation analysis of stomach, medulla and cerebral cortex shows that the stimulation signal of GML may reach the cerebral cortex from the stomach through medulla, and electro-acupuncture can treat GML by regulating the central nervous system (CNS).
Conclusions: 4 days electro-acupuncture treatment can significantly improve gastric mucosal injury, and the curative effect tends to be stable in 7 days treatment. Meanwhile, the pathogenesis of GML and the efficacy of electro-acupuncture involve metabolic pathways such as energy, neurotransmitters, cells and antioxidation, and electro-acupuncture can treat GML by regulating CNS.
Keywords: Dynamic expression; Electro-acupuncture; Gastric mucosal lesions; NMR metabonomics.
© 2022. The Author(s).
Conflict of interest statement
The authors declare that they have no competing interests.
Figures
Similar articles
-
Dynamic observation and analysis of metabolic response to moxibustion stimulation on ethanol-induced gastric mucosal lesions (GML) rats.Chin Med. 2019 Oct 15;14:44. doi: 10.1186/s13020-019-0266-5. eCollection 2019. Chin Med. 2019. PMID: 31636695 Free PMC article.
-
[Endogenous metabolites involving effects of moxibustion on injured gastric mucosal tissue in rats with stomach heat or cold syndrome based on nuclear magnetic resonance spectroscopy].Zhen Ci Yan Jiu. 2020 Jun 25;45(6):446-53. doi: 10.13702/j.1000-0607.190480. Zhen Ci Yan Jiu. 2020. PMID: 32643880 Chinese.
-
(1) H NMR Metabolic Profiling of Biofluids from Rats with Gastric Mucosal Lesion and Electroacupuncture Treatment.Evid Based Complement Alternat Med. 2015;2015:801691. doi: 10.1155/2015/801691. Epub 2015 Jun 15. Evid Based Complement Alternat Med. 2015. PMID: 26170882 Free PMC article.
-
[The modulation of cerebral cortex and subcortical nuclei on NRM and their role in acupuncture analgesia].Zhen Ci Yan Jiu. 1996;21(1):4-11. Zhen Ci Yan Jiu. 1996. PMID: 9387347 Review. Chinese.
-
Visualization and Analysis of the Mapping Knowledge Domain of Acupuncture and Central Nervous System Cell Apoptosis.Evid Based Complement Alternat Med. 2022 Apr 14;2022:1751702. doi: 10.1155/2022/1751702. eCollection 2022. Evid Based Complement Alternat Med. 2022. PMID: 35463084 Free PMC article. Review.
Cited by
-
Metabolomics as a promising technology for investigating external therapy of traditional Chinese medicine: A review.Medicine (Baltimore). 2024 Nov 29;103(48):e40719. doi: 10.1097/MD.0000000000040719. Medicine (Baltimore). 2024. PMID: 39612392 Free PMC article. Review.
-
Effects of acupuncture on gastrointestinal diseases and its underlying mechanism: a literature review of animal studies.Front Med (Lausanne). 2023 Jun 7;10:1167356. doi: 10.3389/fmed.2023.1167356. eCollection 2023. Front Med (Lausanne). 2023. PMID: 37351066 Free PMC article. Review.
References
-
- Brzozowski T, Magierowska K, Magierowski M, et al. Recent advances in the gastric mucosal protection against stress-induced gastric lesions. Importance of renin-angiotensin vasoactive metabolites, gaseous mediators and appetite peptides. Curr Pharm Des. 2017;23(27):3910–22. - PubMed
-
- Repetto MG, Boveris A. Bioactivity of sesquiterpenes: compounds that protect from alcohol-induced gastric mucosal lesions and oxidative damage. Mini Rev Med Chem. 2010;10(7):615–623. - PubMed
-
- Hang X, Li J, Zhang Y, et al. Efficacy of frequently-used acupuncture methods for specific parts and conventional pharmaceutical interventions in treating post-stroke depression patients: A network meta-analysis. Complement Ther Clin Pract. 2021;45:101471. - PubMed
-
- Rabitti S, Giovanardi CM, Colussi D. Acupuncture and related therapies for the treatment of gastrointestinal diseases. J Clin Gastroenterol. 2021;55(3):207–217. - PubMed
Grants and funding
LinkOut - more resources
Full Text Sources
