

Sensor-based phenotyping of above-ground plant-pathogen interactions
- PMID: 35313920
- PMCID: PMC8935837
- DOI: 10.1186/s13007-022-00853-7
Sensor-based phenotyping of above-ground plant-pathogen interactions
Abstract
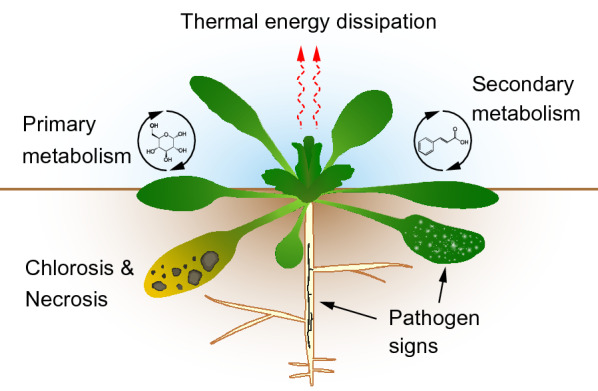
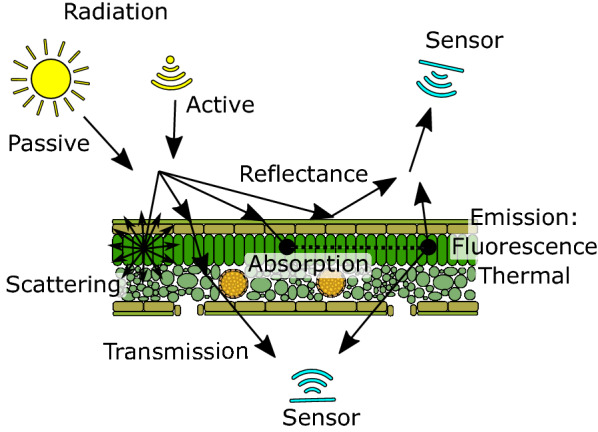
Plant pathogens cause yield losses in crops worldwide. Breeding for improved disease resistance and management by precision agriculture are two approaches to limit such yield losses. Both rely on detecting and quantifying signs and symptoms of plant disease. To achieve this, the field of plant phenotyping makes use of non-invasive sensor technology. Compared to invasive methods, this can offer improved throughput and allow for repeated measurements on living plants. Abiotic stress responses and yield components have been successfully measured with phenotyping technologies, whereas phenotyping methods for biotic stresses are less developed, despite the relevance of plant disease in crop production. The interactions between plants and pathogens can lead to a variety of signs (when the pathogen itself can be detected) and diverse symptoms (detectable responses of the plant). Here, we review the strengths and weaknesses of a broad range of sensor technologies that are being used for sensing of signs and symptoms on plant shoots, including monochrome, RGB, hyperspectral, fluorescence, chlorophyll fluorescence and thermal sensors, as well as Raman spectroscopy, X-ray computed tomography, and optical coherence tomography. We argue that choosing and combining appropriate sensors for each plant-pathosystem and measuring with sufficient spatial resolution can enable specific and accurate measurements of above-ground signs and symptoms of plant disease.
Keywords: Biotic stress; Imaging sensors; Phenotyping; Plant disease; Plant-pathogen interactions; Signs and symptoms.
© 2022. The Author(s).
Conflict of interest statement
The authors declare that they have no competing interests.
Figures
References
-
- D’Arcy CJ. Illustrated glossary of plant pathology. Plant Heal Instr. 2001 doi: 10.1094/PHI-I-2001-0219-01. - DOI
-
- Niks RE, Parlevliet JE, Lindhout P, Bai Y. Breeding crops with resistance to diseases and pests. The Netherlands: Wageningen Academic Publishers; 2019.
-
- Agrios GN. Plant pathology. Amsterdam: Elsevier; 2005. How pathogens attack plants; pp. 175–205.
-
- Agrios GN. Environmental factors that cause plant diseases. Plant Pathol. 2005 doi: 10.1016/b978-0-08-047378-9.50016-6. - DOI
Publication types
Grants and funding
- 16293/pathoview project, funded by rijk zwaan (de lier, netherlands) and the dutch research council (nwo)
- 16293/pathoview project, funded by rijk zwaan (de lier, netherlands) and the dutch research council (nwo)
- 16293/pathoview project, funded by rijk zwaan (de lier, netherlands) and the dutch research council (nwo)
LinkOut - more resources
Full Text Sources
