. 2022 Mar 21;15(1):30.
doi: 10.1186/s13045-022-01245-z.

Reductive TCA cycle catalyzed by wild-type IDH2 promotes acute myeloid leukemia and is a metabolic vulnerability for potential targeted therapy

Affiliations

Reductive TCA cycle catalyzed by wild-type IDH2 promotes acute myeloid leukemia and is a metabolic vulnerability for potential targeted therapy

Peiting Zeng et al. J Hematol Oncol. .

Abstract

Background: Isocitrate dehydrogenase-2 (IDH2) is a mitochondrial enzyme that catalyzes the metabolic conversion between isocitrate and alpha-ketoglutarate (α-KG) in the TCA cycle. IDH2 mutation is an oncogenic event in acute myeloid leukemia (AML) due to the generation of 2-hydroxyglutarate. However, the role of wild-type IDH2 in AML remains unknown, despite patients with it suffer worse clinical outcome than those harboring mutant type.

Methods: IDH2 expression in AML cell lines and patient samples was evaluated by RT-qPCR, western blotting and database analyses. The role of wild-type IDH2 in AML cell survival and proliferation was tested using genetic knockdown and pharmacological inhibition in AML cells and animal models. LC-MS, GC-MS, isotope metabolic tracing, and molecular analyses were performed to reveal the underlying mechanisms.

Results: We found that wild-type IDH2 was overexpressed in AML and played a major role in promoting leukemia cell survival and proliferation in vitro and in vivo. Metabolomic analyses revealed an active IDH2-mediated reductive TCA cycle that promoted the conversion of α-KG to isocitrate/citrate to facilitate glutamine utilization for lipid synthesis in AML cells. Suppression of wild-type IDH2 by shRNA resulted in elevated α-KG and decreased isocitrate/citrate, leading to reduced lipid synthesis, a significant decrease in c-Myc downregulated by α-KG, and an inhibition of AML viability and proliferation. Importantly, pharmacological inhibition of IDH2 showed significant therapeutic effect in mice inoculated with AML cells with wt-IDH2 and induced a downregulation of C-MYC in vivo.

Conclusions: Wt-IDH2 is an essential molecule for AML cell survival and proliferation by promoting conversion of α-KG to isocitrate for lipid synthesis and by upregulating c-Myc expression and could be a potential therapeutic target in AML.

Keywords: Acute myeloid leukemia; Alpha-ketoglutarate; Lipid synthesis; TCA cycle; Wild-type IDH2; c-Myc.


Conflict of interest statement

The authors declare that they have no competing interests.

Figures
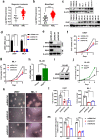
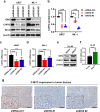
Fig. 1
Fig. 1
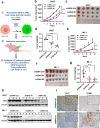
Over-expression of wild-type IDH2 in AML and its effect on leukemia cell proliferation. a Comparison of IDH2 mRNA levels in AML (n = 80) and normal cells (monocytes and neutrophils, n = 6), using the leukemia dataset (Stegmaier Leukemia datasets) available in the Oncomine database. b IDH2 mRNA levels in primary AML samples (n = 204) in comparison with normal cells (hematopoietic stem cells, n = 6; metamyelocytes, n = 3; band cells, n = 3; polymorphonuclear cells, n = 3; monocytes, n = 4) available in the BloodSpot datasets. c Western blotting of IDH2 in normal human peripheral blood mononuclear cells (PBMC #1–#3), AML cell lines and PBMCs from AML patients with wt-IDH2 (AML#1–#8), β-actin was used as a loading control. d Relative mRNA level of IDH2 in U937 and ML-1 cells transfected with control shRNA (shRNA-Ctrl) or IDH2 shRNA (shIDH2#1, shIDH2#2) was measured by RT-qPCR. e Western blotting analysis of IDH2 protein in U937 and ML-1 cells transfected with shRNA-Ctrl or IDH2 shRNA. f, g Measurement of cell proliferation in U937 and ML-1 cells expressing shRNA-Ctrl or IDH2 shRNA. h Relative IDH2 mRNA level in HL-60 cells transfected with control vector (Vector) or IDH2 over-expression vector (IDH2OE). Expression of mRNA was measured by RT-qPCR. i Western blotting analysis of IDH2 protein levels in HL-60 cells transfected with control vector or IDH2 over-expression vector. j Comparison of cell proliferation in HL-60 cells transfected with control vector or IDH2 over-expression vector. k, l Colony formation assay in U937 and ML-1 cells expressing shRNA-Ctrl or IDH2 shRNA. Colonies were counted under inverted microscope. m Comparison of percentage of Annexin V/ PI negative cells in U937 and ML-1 transfected with shRNA-Ctrl or IDH2 shRNA for 48 h. The original flow cytometry analysis data are presented as Additional file 3: Fig. S1h. n = 3, mean ± SD; *p < 0.05, **p < 0.01, ***p < 0.001
Fig. 2
Fig. 2
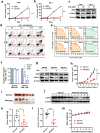
Impact of IDH2 knockdown on AML growth in vivo. a Outline of in vivo study design using AML cell models (U937 and ML-1) with shRNA-Ctrl and shIDH2#1 or shIDH2#2. bd Tumor growth in athymic nude mice inoculated with U937 cells harboring shRNA-Ctrl, shIDH2#1 or shIDH2#2 (n = 5 per group, mean ± SEM). Tumor sizes were measured every two days. At the end of the experiment, tumors were isolated, photographed and weighted. eg Tumor growth in athymic nude mice inoculated with ML-1 cells harboring shRNA-Ctrl, shIDH2#1 or shIDH2#2 (n = 7 per group, mean ± SD). Tumor sizes were measured every two days. Tumors were photographed and weighted at the end of the experiment. The star * in f indicates no tumor formation in this mouse. h Representative Western blotting of IDH2 protein expression in tumor tissues isolated from mice inoculated with AML cells harboring shRNA-Ctrl or IDH2 shRNA as indicated. i Left panel: representative images of Ki-67 IHC staining of tumor tissues from U937 xenografts with shRNA-Ctrl or IDH2 shRNA as indicated. The scale bars represent 50 μm; Right panel: apoptotic cells in tumor tissues of U937 xenografts with shRNA-Ctrl or IDH2 shRNA detected by terminal deoxynucleotidyl transferase dUTP nick end labeling (TUNEL) assay. The scale bars represent 100 μm. ***p < 0.001
Fig. 3
Fig. 3
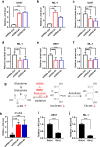
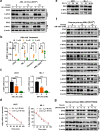
Suppression of IDH2 blocked the conversion of α-KG to isocitrate in reductive TCA cycle. a, b Quantitation of α-KG in U937 or ML-1 cells harboring shRNA-Ctrl, shIDH2#1 or shIDH2#2. c, d Levels of isocitrate in U937 or ML-1 cells harboring shRNA-Ctrl, shIDH2#1 or shIDH2#2. e, f Levels of citrate in U937 or ML-1 cells harboring shRNA-Ctrl, shIDH2#1 or shIDH2#2. g Schematic illustration of changes in α-KG, isocitrate, and citrate in AML cells after suppression of active reductive TCA flow using IDH2 shRNA. h Quantitation of α-KG in tumor tissues from mice bearing U937 xenografts harboring shRNA-Ctrl, shIDH2#1 or shIDH2#2. i, j Comparison of α-KG levels in U937 and ML-1 cells cultured with or without glutamine for 24 h. Gln (+): glutamine 2 mM, Gln (−): glutamine free. n = 3, mean ± SD, *p < 0.05, **p < 0.01, ***p < 0.001
Fig. 4
Fig. 4
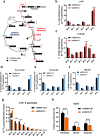
Glutamine metabolic flux analysis in AML cells with or without IDH2 knockdown. a Schematic of [U-13C5] glutamine metabolism tracing experiment. Open circles depict 12C atoms and filled circles depict 13C atoms. Metabolite abbreviations: Gln: glutamine, Glu: glutamate, α-KG: alpha-ketoglutarate, Isocit: isocitrate, Cit: citrate, AcCoA: acetyl-coenzyme A, FAs: fatty acid synthesis, Oac: oxaloacetate, Mal: malate, Fum: fumarate, Suc: succinate, Pyr: pyruvate, Asp: aspartate. The red arrows indicate the direction of changes in metabolites due to suppression of reductive TCA flow, while the blue arrows indicate the direction of changes in metabolites of the oxidative TCA segment. bf Mass isotopomer distribution of the TCA cycle metabolites in U937 cells harboring shRNA-Ctrl or IDH2 shRNA cultured in medium containing [U-13C5] glutamine for 24 h. g Mass isotopomer distribution of palmitate in U937 cells with shRNA-Ctrl or IDH2 shRNA after cultured in medium containing [U-13C5] glutamine for 24 h. h Percentage of newly synthesized palmitate, oleate and stearate in U937 cells with shRNA-Ctrl or IDH2 shRNA after cultured in medium containing [U-13C5] glutamine for 24 h. n = 3, mean ± SD, *p < 0.05, ***p < 0.001
Fig. 5
Fig. 5
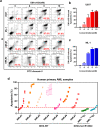
Cytotoxic effect of α-KG in AML cells with wild-type IDH2. a Induction of apoptosis by cell-permeable DM-αKG in AML cell lines (U937 and ML-1) and primary AML cells isolated from patients with wt-IDH2 (AML#1 and AML#2). Cells were treated with the indicated concentrations of DM-αKG for 48 h, and apoptosis was measured by flow cytometry analysis of annexin-V positivity. The number inside each panel shows the percentage of dead cells. b, c Quantitation of the concentration-dependent apoptosis induced by DM-αKG in U937 and ML-1 cells (n = 3, mean ± SD). d Apoptosis of human primary AML cells harboring wild-type (n = 7) or mutant IDH2 (IDH2-R140Q, n = 2) treated with various concentrations (2, 4, 6, 8 and 10 mM) of DM-αKG for 48 h. Apoptosis was measured by flow cytometry analysis of annexin-V positivity
Fig. 6
Fig. 6
Regulation of c-Myc expression by wild-type IDH2 in AML cells. a Effect of IDH2 knockdown on the expression of IDH2, C-MYC and its target gene Bcl-2 in U937 and ML-1 cells. Protein expression was analyzed by Western blotting. b Relative protein levels of C-MYC in U937 and ML-1 cells transfected with shRNA-Ctrl or shIDH2 vectors (#1 and #2). Data are representative of three separate experiments. c Relative mRNA level of C-MYC in U937 cells harboring shRNA-Ctrl or shIDH2 vectors. RNA expression was measured by RT-qPCR. d Relative mRNA level of C-MYC in ML-1 cells harboring shRNA-Ctrl or shIDH2 vectors. RNA expression was measured by RT-qPCR. e Expression of IDH2 protein and C-MYC protein in HL-60 cells transfected with control vector (Vector) or wt-IDH2 expression vector (IDH2OE), protein expression was detected by Western blotting. f Relative mRNA levels of C-MYC in HL-60 cells harboring control vector or IDH2OE vector, measured by RT-qPCR. g Representative images of C-MYC immunohistochemistry (IHC) staining of tumor tissues from U937 xenografts harboring shRNA-Ctrl or shIDH2 vectors (#1 or #2). The scale bars represent 100 μm. n = 3, mean ± SD, *p < 0.05, ***p < 0.001
Fig. 7
Fig. 7
Effect of α-KG on c-Myc expression in AML cell lines and primary leukemia cells. a Western blotting analysis of IDH2 and C-MYC protein expression in U937 and ML-1 cells treated with the indicated concentrations of DM-αKG for 6, 12 and 24 h. b Relative protein levels of C-MYC in AML cell lines (data from three separate experiments) and primary leukemia cells from AML patients with wild-type IDH2 (n = 4) treated in vitro with the indicated concentrations of DM-αKG for 12 h. *p < 0.05, **p < 0.01, ***p < 0.001. c Relative mRNA level of C-MYC in U937 and ML-1 cells treated with the indicated concentrations of DM-αKG for 6 h. RNA expression was measured by RT-qPCR. ***p < 0.001. d Effect of DM-αKG (4 mM) on c-Myc mRNA stability. Cells were pre-treated with DM-αKG for 4.5 h followed by incubation with 5 μg/mL actinomycin D for the indicated time periods (0, 15, 30, 45, 60 and 90 min). The mRNA degradation rate was estimated according to a published method [52]. e C-MYC protein expression in U937 and ML-1 cells cultured with or without glutamine (Gln) for 24–48 h as indicated. f Western blotting of IDH2 and C-MYC protein expression in primary leukemia cells isolated from 6 AML patients with wild-type IDH2 treated ex-vivo with the indicated concentrations of DM-αKG for 6, 12 and 24 h. g Western blotting analysis of IDH2 and C-MYC protein expression in human primary AML cells from two patients with mutant IDH2 treated ex-vivo with indicated concentrations of DM-αKG for 6, 12 and 24 h
Fig. 8
Fig. 8
Inhibition of IDH2 by AGI-6780 suppressed AML survival in vitro and in vivo. a, b Effect of AGI-6780 on cell proliferation in U937 and ML-1 cells. Cells were treated with AGI-6780 (10 µM) or solvent (DMSO), and cell numbers were counted at the indicated time points. Data are mean ± SD of three experiments. c Levels of protein expression of IDH2 and C-MYC in U937 and ML-1 cells treated with AGI-6780 (10 µM) or solvent (DMSO) for 24 h. d The indicated cell line were treated with AGI-6780 for 72 h, and cell viability was measured using MTS assay. e Primary leukemia cells from AML patients with wt-IDH2 (n = 4) and normal human bone marrow cells (HBMC) were treated ex vivo with the indicated concentrations of AGI-6780 for 72 h, and cell viability was measured using MTS assay. f Comparison of percentage of Annexin V/PI-negative cells in primary AML cells and primary normal bone marrow cells treated with 10–20 µM AGI-6780 for 48 h. The original flow cytometry analysis data are presented as Additional file 3: Fig. S8c, d. g Protein levels of IDH2 and C-MYC in primary AML cells treated with AGI-6780 (20 µM) or with solvent (DMSO) for 24 h. h Growth curves of AML xenografts in athymic nude mice inoculated with ML-1 cells harboring wt-IDH2 (n = 6 per group, mean ± SEM). Mice were treated with daily i.p. injection of AGI-6780 or solvent as indicated. i Photographs of gross tumors isolated from mice at the end of the experiment. j Western blot analysis of C-MYC expression in tumor tissues of ML-1 xenografts isolated from mice treated with AGI-6780 or solvent as indicated. k Tumor weights of each group at the end of the experiment (mean ± SEM). l Relative C-MYC protein levels in tumor tissues of mice treated with solvent (n = 6) or AGI-6780 (n = 6). m Mouse body weights (mean ± SD). Two-tailed unpaired student’s t test for a, b, f, h, k and l, *p < 0.05, ***p < 0.001
Fig. 9
Fig. 9
Schematic model depicting the key functions of wild-type IDH2 in AML cells and the impact of IDH2 suppression on α-KG metabolism, fatty acid synthesis, and c-Myc expression (see text for detail description)

Similar articles

Cited by

References

    1. Newell LF, Cook RJ. Advances in acute myeloid leukemia. BMJ. 2021;375:n2026. - PubMed
    1. Dutta R, Zhang TY, Köhnke T, Thomas D, Linde M, Gars E, Stafford M, Kaur S, Nakauchi Y, Yin R, et al. Enasidenib drives human erythroid differentiation independently of isocitrate dehydrogenase 2. J Clin Investig. 2020;130:1843–1849. - PMC - PubMed
    1. Daver N, Venugopal S, Ravandi F. FLT3 mutated acute myeloid leukemia: 2021 treatment algorithm. Blood Cancer J. 2021;11:104. - PMC - PubMed
    1. Medeiros BC, Fathi AT, DiNardo CD, Pollyea DA, Chan SM, Swords R. Isocitrate dehydrogenase mutations in myeloid malignancies. Leukemia. 2017;31:272–281. - PMC - PubMed
    1. Azzi G, Velez M, Mathias-Machado MC. Isocitrate dehydrogenase mutations in chondrosarcoma: the crossroads between cellular metabolism and oncogenesis. Curr Opin Oncol. 2014;26:403–407. - PubMed

Publication types