. 2022 Mar 21;13(1):109.
doi: 10.1186/s13287-022-02791-6.

Human umbilical cord-derived mesenchymal stem cells alleviate insulin resistance in diet-induced obese mice via an interaction with splenocytes

Affiliations

Human umbilical cord-derived mesenchymal stem cells alleviate insulin resistance in diet-induced obese mice via an interaction with splenocytes

Jing Xue et al. Stem Cell Res Ther. .

Abstract

Background: Previous research has demonstrated that the spleen plays an important role in mesenchymal stem cell (MSC)-mediated alleviation of acute inflammation, as MSC infusion increases the spleen-derived anti-inflammatory cytokine interleukin 10 (IL-10) levels. However, studies on splenic involvement in MSC-induced protection against chronic inflammatory diseases are limited. Obesity is characterized by chronic low-grade inflammation, a key driver of insulin resistance. This study aims to evaluate the effects of MSCs on obesity-related insulin resistance and explore the underlying mechanism, particularly regarding splenic involvement.

Methods: We induced obesity in mice by feeding them high-fat diets for 20 weeks. Human umbilical cord-derived MSCs (UC-MSCs) were systemically infused into the obese mice once per week for 6 weeks. Systemic glucose metabolic homeostasis and insulin sensitivity in epididymal adipose tissue (EAT) were evaluated. Then, we conducted in vivo blockade of IL-10 during UC-MSC infusion by intraperitoneally administrating an IL-10-neutralizing antibody twice per week. We also investigated the therapeutic effects of UC-MSCs on obese mice after removal of the spleen by splenectomy.

Results: UC-MSC infusions improved systemic metabolic homeostasis and alleviated insulin resistance in EAT but elicited no change in weight. Despite rare engraftment of UC-MSCs in EAT, UC-MSC infusions attenuated insulin resistance in EAT by polarizing macrophages into the M2 phenotype, coupled with elevated serum IL-10 levels. In vivo blockade of IL-10 blunted the effects of UC-MSCs on obese mice. Furthermore, UC-MSCs overwhelmingly homed to the spleen, and the ability of UC-MSCs to elevate serum IL-10 levels and alleviate insulin resistance was impaired in the absence of the spleen. Further in vivo and in vitro studies revealed that UC-MSCs promoted the capacity of regulatory T cells (Treg cells) to produce IL-10 in the spleen.

Conclusions: Our results demonstrated that UC-MSCs elevated serum IL-10 levels and subsequently promoted macrophage polarization, leading to alleviation of insulin resistance in EAT. The underlying mechanism was that UC-MSCs improved the capacity of Treg cells to produce IL-10 in the spleen. Our findings indicated that the spleen played a critical role in amplifying MSC-mediated immunomodulatory effects, which may contribute to maximizing MSC efficacy in clinical applications in the future.

Keywords: Insulin resistance; Macrophage; Mesenchymal stem cells; Obesity; Regulatory T cell; Spleen.


Conflict of interest statement

The authors declare that they have no competing interests.

Figures

Fig. 1
Fig. 1
Multiple UC-MSC infusions resulted in a subtle improvement in systemic metabolic homeostasis in HFD-fed mice. Eight-week-old male C57BL/6J mice were fed a HFD for 20 weeks to induce obesity. Then, the obese mice were randomly treated with an infusion of 0.2 ml of PBS (referred to as the HFD group) or an infusion of 1 × 106 UC-MSCs suspended in 0.2 ml of PBS once per week for 6 weeks (referred to as the MSC group). Mice fed a normal chow diet were used as controls (referred to as the Nor group). One week after the last infusion of UC-MSCs, the mice were sacrificed. The weight (a) and random blood glucose levels (b) of mice were measured once per week. After the last infusion of UC-MSCs, glucose tolerance and insulin tolerance were assessed by an IPGTT (c) and IPITT (d), respectively. e The area under the curve of the IPGTT was calculated. f The area under the curve of the IPITT was calculated. The fasting glucose levels (g) and the fasting insulin levels (h) were detected after the last infusion of UC-MSCs. The HOMA-IR score was calculated (i). Values of ai are the means ± SDs; n = 6 mice per group; *P < 0.05, **P < 0.01. UC-MSCs, human umbilical cord-derived mesenchymal stem cells; HFD, high-fat diets; PBS phosphate-buffered saline; IPGTT, intraperitoneal glucose tolerance test; IPITT, intraperitoneal insulin tolerance test
Fig. 2
Fig. 2
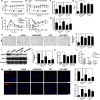
Multiple UC-MSC infusions alleviated insulin resistance and inflammation of epididymal adipose tissue in HFD-fed mice. a Representative H&E staining of epididymal adipose tissue from the Nor, HFD and MSC groups. Scale bar = 100 μm. b The size of adipocytes was evaluated via digital image analysis. c Weight of inguinal adipose tissue. d Weight of epididymal adipose tissue. e Immunoblotting analysis of p-AKT and total AKT expression in epididymal adipose tissue. The ratios of p-AKT to total AKT were quantitated (f). g Real-time polymerase chain reaction analysis of inflammation-related gene expression in epididymal adipose tissue. The results are presented relative to those of normal mice, which were set as 1. Values are the mean ± SD; n = 6 mice per group, *P < 0.05; **P < 0.01
Fig. 3
Fig. 3
Multiple UC-MSC infusions promoted macrophage polarization towards the M2 phenotype in epididymal adipose tissues. a Representative Fizz1-positive cells (M2 macrophage marker) in epididymal adipose tissue analysed by immunofluorescence and quantification of Fizz1-positive cells. Scale bar = 100 μm. b Representative iNOS-positive cells (M1 macrophage marker) in epididymal adipose tissue analysed by immunofluorescence and quantification of iNOS-positive cells. Scale bar = 100 μm. Values in a and b were determined by assessing cells manually from at least five sections of each slide, at least 3 slides per mouse, and at least 6 mice per group. c Immunoblotting analysis of Arg1 expression in epididymal adipose tissue. Relative protein levels were quantified by the ratio of Arg1 to β-actin (d). e Real-time polymerase chain reaction analysis of macrophage phenotype-related gene expression in epididymal adipose tissue. The results are presented relative to those of normal mice, which were set as 1. Values are the mean ± SD; n = 6 mice per group, *P < 0.05; **P < 0.01
Fig. 4
Fig. 4
Multiple UC-MSC infusions elevated the levels of IL-10 in serum, adipose tissue and the spleen. The serum levels of IL-10 (a), IL-1β (b), IL-6 (c), TNF-α (d) and MCP-1 (e) were determined by AIMPLEX assay. IL-10 protein expression in epididymal adipose tissue (f) and the spleen (g) was measured by ELISA. Values are the mean ± SD; n = 6 mice per group, *P < 0.05; **P < 0.01
Fig. 5
Fig. 5
IL-10 neutralization attenuated UC-MSC-induced alleviation of insulin resistance and macrophage polarization in epididymal adipose tissue. HFD-induced obese mice were randomly divided into the HFD group, MSC group and MSC + IL-10Ab group. The MSC group and MSC + IL-10Ab group both received UC-MSC infusions once per week for 6 weeks. During UC-MSC infusion, the MSC + IL-10Ab group and MSC group were intraperitoneally administered a neutralizing anti-IL-10 antibody or the corresponding isotype control IgG twice per week. The HFD group received PBS infusions. Mice fed a normal chow diet were used as controls (referred to as the Nor group). One week after the last infusion of UC-MSCs, the mice were sacrificed. a Weight of the mice. b Random blood glucose levels of the mice. c The fasting glucose levels after the last infusion of UC-MSCs were detected. The HOMA-IR score was calculated (d). After the last infusion of UC-MSCs, glucose tolerance and insulin tolerance were assessed by an IPGTT (e) and IPITT (f), respectively. g Weight of epididymal adipose tissue. h Representative H&E staining of epididymal adipose tissue from the Nor, HFD, MSC and MSC + IL-10Ab groups. Scale bar = 100 μm. i The size of adipocytes was evaluated via digital image analysis. j Immunoblotting analysis of p-AKT and total AKT expression in epididymal adipose tissue; the ratios of p-AKT to total AKT were quantitated. k Real-time polymerase chain reaction analysis of macrophage phenotype-related gene expression in epididymal adipose tissue. l Representative Fizz1-positive cells and iNOS-positive cells in epididymal adipose tissue analysed by immunofluorescence and quantification of Fizz1-positive or iNOS-positive cells. Scale bar = 50 μm. Values in l were determined by assessing cells manually from at least five sections of each slide, at least 3 slides per mouse, and at least 6 mice per group. Values of ah are the means ± SDs; n = 6 mice per group; *P < 0.05, **P < 0.01
Fig. 6
Fig. 6
Splenectomy dampened UC-MSC-induced mitigation of insulin resistance in epididymal adipose tissue. HFD-induced obese mice underwent splenectomy or sham operation. After 3 weeks of recovery, mice that underwent splenectomy were infused with UC-MSCs (referred to as the SPX + MSC group) or PBS (referred to as the SPX group) once per week for 6 weeks. Similarly, mice that underwent sham operation were infused with UC-MSCs (referred to as the SHAM + MSC group) or PBS (referred to as the SHAM group) once per week for 6 weeks. Mice fed a normal chow diet were used as controls (referred to as the Nor group). a Weight of the mice. b Random blood glucose levels of the mice. c The fasting glucose levels after the last infusion of UC-MSCs were detected. The HOMA-IR score was calculated (d). After the last infusion of UC-MSCs, an IPGTT (e) and IPITT (f) were performed to evaluate glucose tolerance and insulin tolerance, respectively. g Serum levels of IL-10. h Representative H&E staining of epididymal adipose tissue; the size of adipocytes was evaluated via digital image analysis. Scale bar = 100 μm. k Weight of epididymal adipose tissue. l Real-time polymerase chain reaction analysis of macrophage phenotype-related gene expression in epididymal adipose tissue. i Immunoblotting analysis of p-AKT and total AKT expression in epididymal adipose tissue; the ratios of p-AKT to total AKT were quantitated (j). m Representative Fizz1-positive cells and iNOS-positive cells in epididymal adipose tissue analysed by immunofluorescence and quantification of Fizz1-positive or iNOS-positive cells. Scale bar = 50 μm. Values in m were determined by assessing cells manually from at least five sections of each slide, at least 3 slides per mouse, and at least 6 mice per group. Values of ah are the means ± SDs; n = 6 mice per group; *P < 0.05, **P < 0.01
Fig. 7
Fig. 7
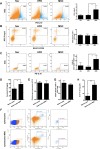
UC-MSCs increase IL-10 expression in Treg cells in the spleen. HFD-induced obese mice were randomly divided into an MSC group (received UC-MSC infusion once per week for 6 weeks) and an HFD group (received corresponding PBS infusions). Mice fed a normal chow diet were used as controls (referred to as the Nor group). One week after the last UC-MSC infusion, the mice were sacrificed, and the spleen was harvested. Then, splenocytes were extracted from the spleen and detected by flow cytometry (a, b, c). a The percentage of IL-10+ cells among total splenocytes. b The percentage of CD25+Foxp3+ cells among CD4+splenocytes. c The percentage of IL-10+ cells among CD4+CD25+Foxp3+ cells. n = 6 mice per group. dh Splenocytes collected from HFD-fed obese mice were co-cultured with UC-MSCs via a Transwell system or cultured alone for 24 h, followed by removing the UC-MSCs and stimulating the splenocytes with ConA for 72 h. During the whole period, the splenocytes were cultured with RPMI 1640 medium supplemented with murine recombinant interleukin-2 (20 U/ml). The levels of IL-10 in splenocyte supernatant were detected by ELISA (d). The IL-10 gene expression in the splenocytes was detected by real-time polymerase chain reaction analysis (e). The percentage of CD25+Foxp3+ cells among CD4+ splenocytes and the percentage of IL-10+ cells among CD4+CD25+Foxp3+ cells were detected by flow cytometry (f, g, h). Values are the means ± SDs of three individual experiments, *P < 0.05, **P < 0.01

Similar articles

Cited by

References

    1. Petersen MC, Shulman GI. Mechanisms of insulin action and insulin resistance. Physiol Rev. 2018;98(4):2133–2223. - PMC - PubMed
    1. Czech MP. Insulin action and resistance in obesity and type 2 diabetes. Nat Med. 2017;23(7):804–814. - PMC - PubMed
    1. Olefsky JM, Glass CK. Macrophages, inflammation, and insulin resistance. Annu Rev Physiol. 2010;72:219–246. - PubMed
    1. Murray PJ, Allen JE, Biswas SK, Fisher EA, Gilroy DW, Goerdt S, et al. Macrophage activation and polarization: nomenclature and experimental guidelines. Immunity. 2014;41(1):14–20. - PMC - PubMed
    1. Martinez FO, Gordon S. The M1 and M2 paradigm of macrophage activation: time for reassessment. F1000prime Rep;2014;6:13. - PMC - PubMed

Publication types

LinkOut - more resources