. 2022 Mar 21;13(1):120.
doi: 10.1186/s13287-022-02799-y.

Thyroid hormone enhances stem cell maintenance and promotes lineage-specific differentiation in human embryonic stem cells

Affiliations

Thyroid hormone enhances stem cell maintenance and promotes lineage-specific differentiation in human embryonic stem cells

Chunhao Deng et al. Stem Cell Res Ther. .

Abstract

Background: Thyroid hormone triiodothyronine (T3) is essential for embryogenesis and is commonly used during in vitro fertilization to ensure successful implantation. However, the regulatory mechanisms of T3 during early embryogenesis are largely unknown.

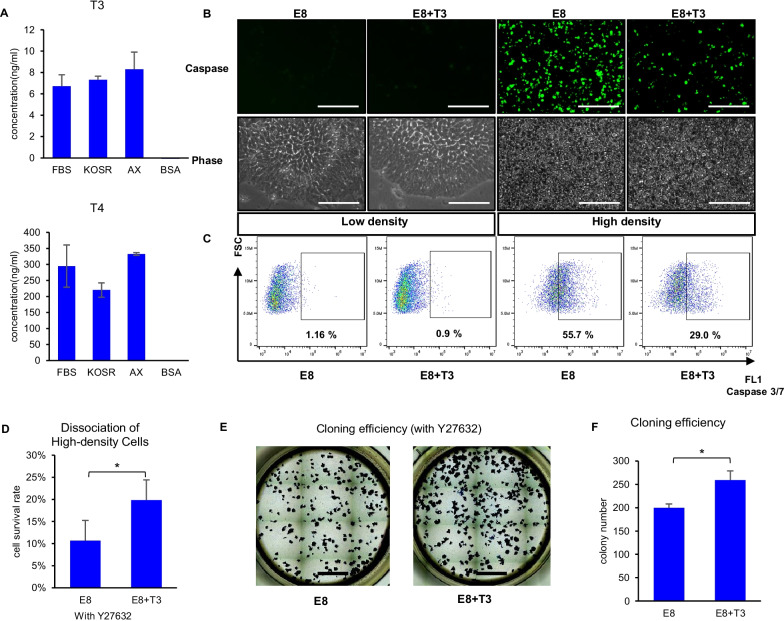
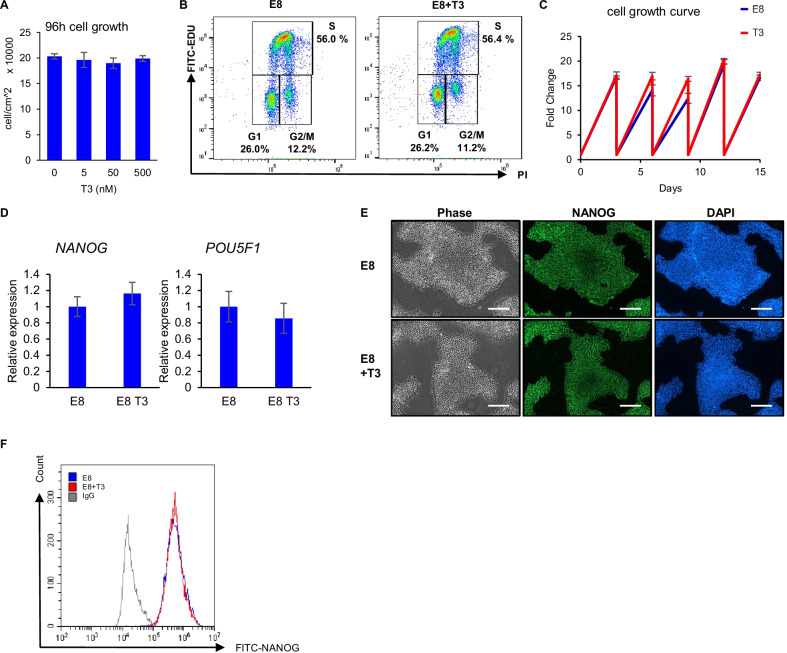
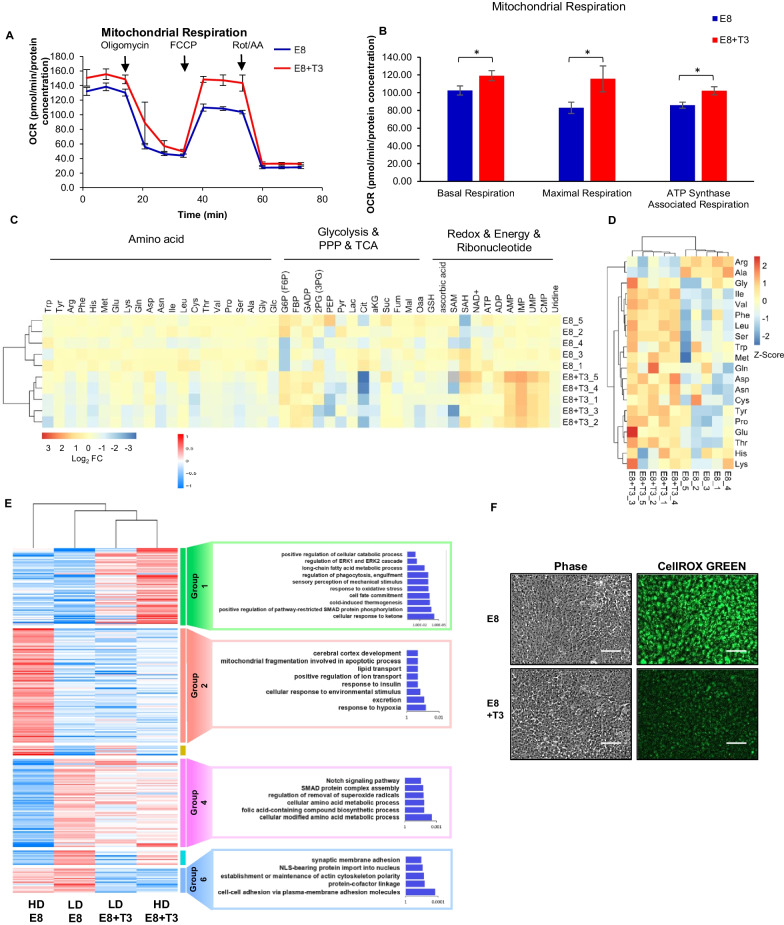
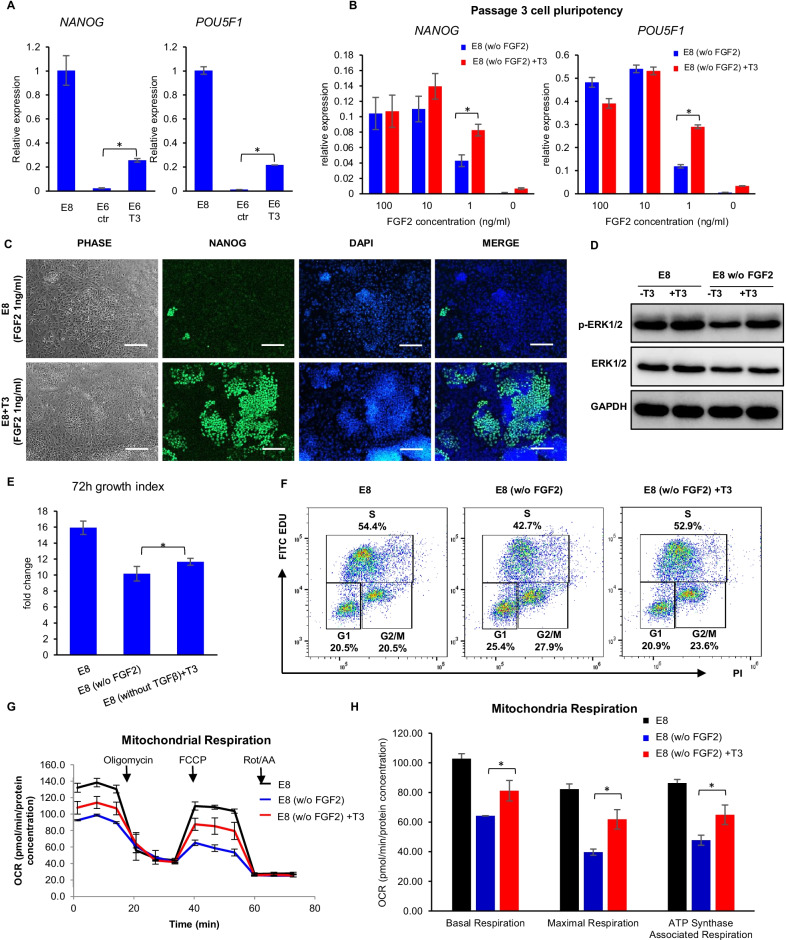
Method: To study the impact of T3 on hPSCs, cell survival and growth were evaluated by measurement of cell growth curve, cloning efficiency, survival after passaging, cell apoptosis, and cell cycle status. Pluripotency was evaluated by RT-qPCR, immunostaining and FACS analysis of pluripotency markers. Metabolic status was analyzed using LC-MS/MS and Seahorse XF Cell Mito Stress Test. Global gene expression was analyzed using RNA-seq. To study the impact of T3 on lineage-specific differentiation, cells were subjected to T3 treatment during differentiation, and the outcome was evaluated using RT-qPCR, immunostaining and FACS analysis of lineage-specific markers.

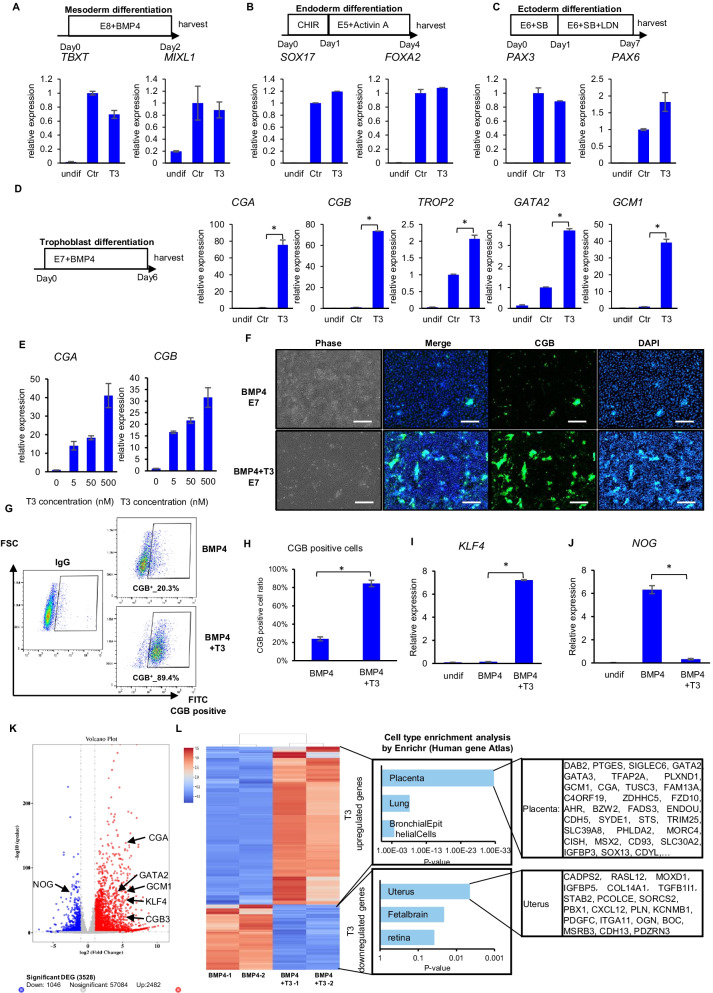
Results: In this report, we use human pluripotent stem cells (hPSCs) to show that T3 is beneficial for stem cell maintenance and promotes trophoblast differentiation. T3 enhances culture consistency by improving cell survival and passaging efficiency. It also modulates cellular metabolism and promotes energy production through oxidative phosphorylation. T3 helps maintain pluripotency by promoting ERK and SMAD2 signaling and reduces FGF2 dependence in chemically defined culture. Under BMP4 induction, T3 significantly enhances trophoblast differentiation.

Conclusion: In summary, our study reveals the impact of T3 on stem cell culture through signal transduction and metabolism and highlights its potential role in improving stem cell applications.

Keywords: Cell culture; Pluripotency; Thyroid Hormone; Triiodothyronine (T3); Trophoblast; hPSCs.


Conflict of interest statement

C.D. and G.C. filed a patent application based on the application of thyroid hormones in hPSC culture medium. The authors declare that they have no other competing interests.

Figures

Fig. 1
Fig. 1
Thyroid hormone T3 improves hPSC high-density survival and cloning efficiency. A Concentration of thyroid hormone T3 and T4 in different medium supplements at commonly used concentrations, measured by ELISA. n = 3 biological repeats. B, C Impact of T3 on cell apoptosis in high- and low-density culture treated with or without T3 for 3 days, measured with caspase 3/7 green detection reagent as shown in fluorescence images (B) and FACS data (C). Scale bar, 100 μm. Data are representative of three independent experiments. D T3 enhanced hESC survival after passaging from high-density culture. H1 cells were cultured in E8 or E8 + 500 nM T3 for 3 days until cells reach over 90% confluence, then passaged to a new plate and counted on the next day. n = 3 biological repeats, *P < 0.05. E, F T3 improved cloning efficiency. H1 cells were cultured in E8 or E8 + 500 nM T3 for 3 days and then collected using EDTA for seeding. 500 cells were seeded in each well of a 12-well plate and cultured in E8 or E8 with 500 nM T3 for 6 days. Alkaline phosphatase staining was used to visualize (E) and count the colonies (F). Scale bar, 5 mm. n = 3 biological repeats, *P < 0.05
Fig. 2
Fig. 2
T3 is compatible with long-term hESC maintenance in E8 medium. A hESC growth with or without T3. 10,000 H1 cells were seeded in each well of a 24-well plate on day 0 and cultured in E8 or E8 with T3 at different concentrations with daily medium change. Cell count was determined on day 4. n = 3 biological repeats. B hESC cell cycle profile measured by Click-iT® EdU Flow Cytometry Assay Kit, following pre-treatment with T3 for 3 days. Data are representative of three independent experiments. C Continuous expansion of hESCs in the presence of T3. H1 cells were cultured in E8 or E8 with T3 (500 nM) medium in 12-well plates for 5 passages, with 30,000 cells seeded at each passage. Cell counts were determined prior to passaging and normalized to the number seeded. n = 3 biological repeats for each time point. D Expression of pluripotency markers NANOG and POU5F1 and in H1 cells cultured with or without T3 for five passages, determined by RT-qPCR. GAPDH was used as internal control, and the gene expression was normalized to the level in E8 culture. ns, not significant. Data are representative of three independent experiments. E Immunostaining of NANOG in H1 cells cultured with or without T3 for five passages. Scale bar, 200 μm. F FACS analysis of NANOG+ cells in H1 cells cultured with or without T3 for five passages. Data representative of three independent experiments
Fig. 3
Fig. 3
T3 modulates hESC metabolism and gene expression. A, B T3 modulates hESC mitochondrial respiration. H1 cells treated with E8 or E8 + T3 (500 nM) for 3 days were seeded into the assay plate, cultured for one more day with the same treatment and subjected to the test with T3 added into the assay medium in corresponding wells. Oxygen consumption rate (OCR) of H1 hESCs measured with Mito Stress Test using Seahorse XFe96 analyzer (A), basal respiration, maximal respiration and ATP Synthase-Associated Respiration calculated from the assay results in panel A (B). n ≥ 3, *P < 0.05. C Heatmap of intracellular levels of metabolites quantified by LC–MS/MS. Data are shown as log2 fold change of the peak area of corresponding metabolite normalized to the control group (E8). n = 5. Red color indicates upregulation and blue downregulation. Gray represents the compound was not detected in the assay. D Heatmap of amino acids consumption in culture medium, quantified by LC–MS/MS. Data are shown as Z-Score of the peak area of corresponding metabolite. n = 5. Red color indicates more secretion/less consumption, while blue color indicates less secretion/more consumption. E RNA-seq analysis of the effect of T3 in high-density (HD, > 90% confluence) and low-density (LD, < 70% confluence) H1 culture. Cells were treated with or without T3 (500 nM) for 3 days. Left, heatmap of RNA-seq DEG. Right, GO term analysis based on clustered genes. F T3 reduces ROS level in hESCs. hESC ROS level was detected by CellROX green kit. Scale bar, 100 μm
Fig. 4
Fig. 4
T3 promotes pluripotency under suboptimal conditions. A Impact of T3 on spontaneous differentiation. FGF2 and TGFβ were withdrawn from H1 cell culture at 30–40% confluence, and cells were allowed to spontaneously differentiate for 14 days. Medium was changed every two days, and pluripotency markers NANOG and POU5F1 were analyzed by RT-PCR on day 14. GAPDH was used as internal control, and the gene expression were normalized to the levels in E8 culture. Data are representative of three independent experiments. B Impact of T3 on pluripotency at low FGF2 concentrations. H1 cells were cultured in E8 medium with different concentrations of FGF2 with or without T3 for 3 passages before analysis by RT-PCR. Gene expression levels were normalized to GAPDH. Data are representative of two independent experiments. C Immunostaining of NANOG in H1 cells cultured for 3 passages in E8 medium with 1 ng/ml FGF2 in the presence or absence of T3. Scale bar, 200 μm. D Western blot analysis of ERK1/2 (Thr202/Tyr204) phosphorylation. H1 cells were cultured in E8 medium with or without T3 for 4 days with passaging on day 3 and then changed to E8 medium with or without FGF2 for another 24 h before collection for analysis. GAPDH was used as loading control. Data are representative of three independent experiments. E T3 promoted hESC growth in the absence of FGF2. H1 cells were cultured with or without FGF2 or T3 (500 nM) for 3 days. n = 6 biological repeats. *P < 0.05. F Impact of T3 on cell cycle profiles in the absence of FGF2. H1 cells were cultured with or without FGF2 or T3 (500 nM) for 3 days. Data are representative of three independent experiments. G, H T3 enhances hESC mitochondrial respiration in the medium without FGF2. H1 cells cultured with or without FGF2, the impact of T3 on oxygen consumption rate (OCR) measured by Mito Stress Test (G). Basal respiration, maximal respiration and ATP Synthase-Associated Respiration calculated from the assay results in panel G (H). n ≥ 3, *, P < 0.05
Fig. 5
Fig. 5
T3 promotes trophoblast differentiation in hESCs. AD Effects of T3 on lineage-specific differentiation. Top, schematic drawings of the differentiation protocols. Bottom, analysis of lineage-specific marker genes by RT-qPCR. TBXT and MIXL1 for mesoderm (A), SOX17 and FOXA2 for endoderm (B), PAX3 and PAX6 for ectoderm (C) and CGA, CGB, GCM1, GATA2 and TROP2 for trophoblast (D). GAPDH was used as internal reference, and all the gene expression levels were normalized to control (Ctr). Data are representative of three independent experiments, *P < 0.05. E5, E8 medium without TGFβ, FGF2 or insulin. E6, E8 medium without TGFβ or FGF2. E7, E8 medium without FGF2. Undif, undifferentiated cells. E Dose-dependent effect of T3 on BMP4-induced trophoblast differentiation. H1 cells were differentiated toward trophoblast linage under BMP4 treatment with different concentrations of T3 for 6 days. Expression of CGA and CGB was measured by RT-qPCR. GAPDH was used as internal control, and the gene expression levels were normalized to the sample without T3. Data are representative of three independent experiments. F Immunostaining showing CGB expression on day 7 of differentiation toward trophoblast lineage with or without T3 (500 nM). Scale bar, 200 µm. G, H FACS analysis of CGB+ cells on day 7 of differentiation. hESCs were induced toward trophoblast lineage by BMP4 with or without T3 (500 nM). n = 3 biological repeats, *P < 0.05. I, J mRNA levels of KLF4 and NOG on day 6 of trophoblast differentiation with or without T3 treatment, measured by RT-qPCR. GAPDH was used as internal control. Data are representative of three independent experiments, *P < 0.05. Undif, undifferentiated cells. K, L RNA-seq analysis of the effect of T3 in BMP4 induced cell differentiation. hESC was differentiated toward trophoblast under 6 days of BMP4 treatment with or without 500 nM T3. RNA-seq DEGs were visualized by volcano map (K), and cell-type enrichment analysis for T3 upregulated and downregulated genes were performed by Enrichr website (L)

Similar articles

Cited by

References

    1. Ludwig TE, Kujak A, Rauti A, Andrzejewski S, Langbehn S, Mayfield J, Fuller J, Yashiro Y, Hara Y, Bhattacharyya A. 20 Years of human pluripotent stem cell research: it all started with five lines. Cell Stem Cell. 2018;23(5):644–648. doi: 10.1016/j.stem.2018.10.009. - DOI - PubMed
    1. Liu W, Deng C, Godoy-Parejo C, Zhang Y, Chen G. Developments in cell culture systems for human pluripotent stem cells. World J Stem Cells. 2019;11(11):968–981. doi: 10.4252/wjsc.v11.i11.968. - DOI - PMC - PubMed
    1. Chen G, Gulbranson DR, Yu P, Hou Z, Thomson JA. Thermal stability of fibroblast growth factor protein is a determinant factor in regulating self-renewal, differentiation, and reprogramming in human pluripotent stem cells. Stem cells. 2012;30(4):623–630. doi: 10.1002/stem.1021. - DOI - PMC - PubMed
    1. Chen G, Gulbranson DR, Hou Z, Bolin JM, Ruotti V, Probasco MD, Smuga-Otto K, Howden SE, Diol NR, Propson NE, et al. Chemically defined conditions for human iPSC derivation and culture. Nat Methods. 2011;8(5):424–429. doi: 10.1038/nmeth.1593. - DOI - PMC - PubMed
    1. Xu C, Inokuma MS, Denham J, Golds K, Kundu P, Gold JD, Carpenter MK. Feeder-free growth of undifferentiated human embryonic stem cells. Nat Biotechnol. 2001;19(10):971–974. doi: 10.1038/nbt1001-971. - DOI - PubMed

Publication types

Substances

LinkOut - more resources