

Identification of differentially expressed genes and signaling pathways with Candida infection by bioinformatics analysis
- PMID: 35314002
- PMCID: PMC8935812
- DOI: 10.1186/s40001-022-00651-w
Identification of differentially expressed genes and signaling pathways with Candida infection by bioinformatics analysis
Abstract
Background: Opportunistic Candida species causes severe infections when the human immune system is weakened, leading to high mortality.
Methods: In our study, bioinformatics analysis was used to study the high-throughput sequencing data of samples infected with four kinds of Candida species. And the hub genes were obtained by statistical analysis.
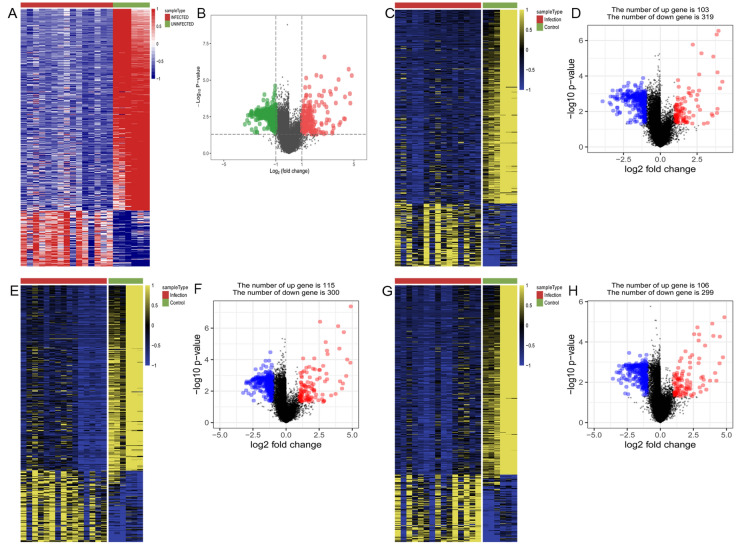
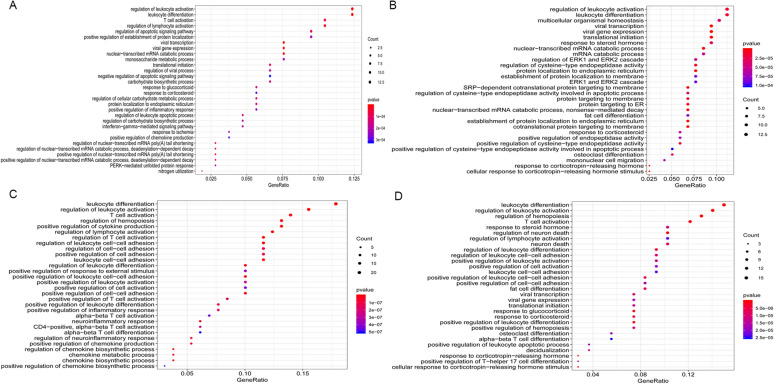
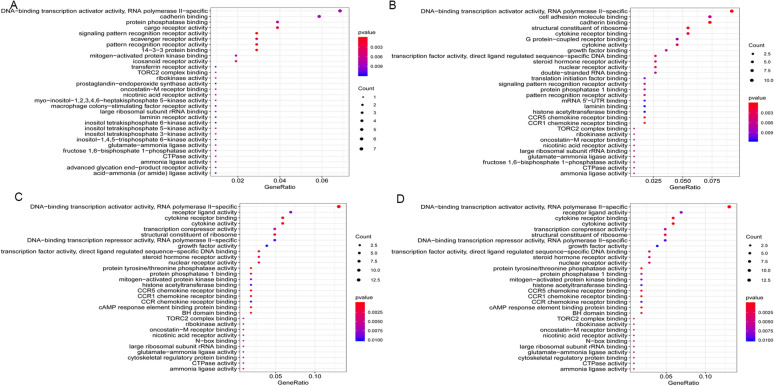
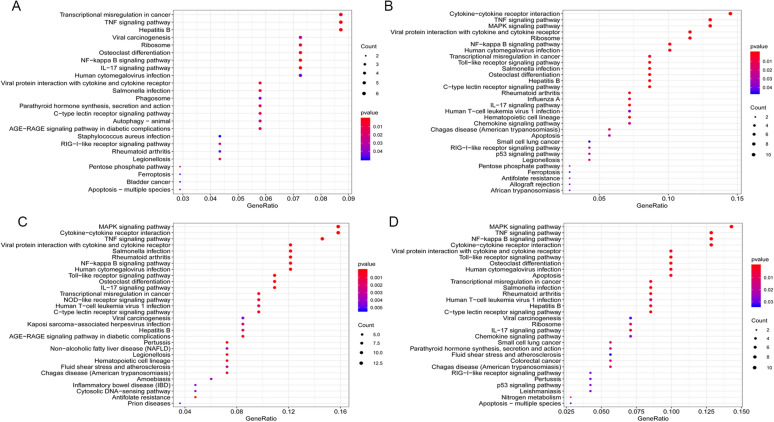
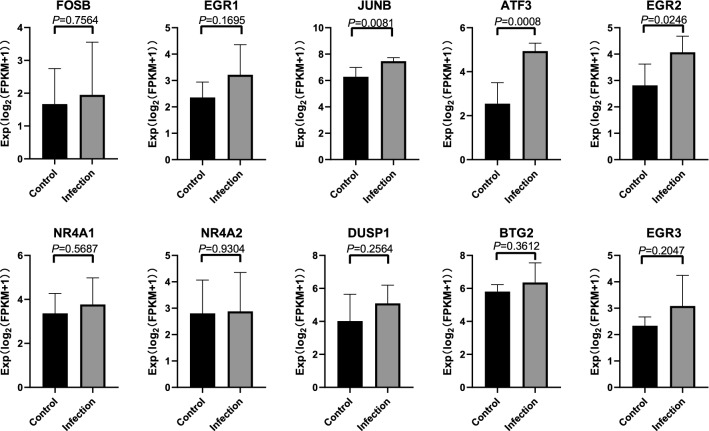
Results: A total of 547, 422, 415 and 405 differentially expressed genes (DEGs) of Candida albicans, Candida glabrata, Candida parapsilosis and Candida tropicalis groups were obtained, respectively. A total of 216 DEGs were obtained after taking intersections of DEGs from the four groups. A protein-protein interaction (PPI) network was established using these 216 genes. The top 10 hub genes (FOSB, EGR1, JUNB, ATF3, EGR2, NR4A1, NR4A2, DUSP1, BTG2, and EGR3) were acquired through calculation by the cytoHubba plug-in in Cytoscape software. Validated by the sequencing data of peripheral blood, JUNB, ATF3 and EGR2 genes were significant statistical significance.
Conclusions: In conclusion, our study demonstrated the potential pathogenic genes in Candida species and their underlying mechanisms by bioinformatic analysis methods. Further, after statistical validation, JUNB, ATF3 and EGR2 genes were attained, which may be used as potential biomarkers with Candida species infection.
Keywords: Bioinformatics analysis; Candida; Differentially expressed genes; High-throughput sequencing; Signaling pathways.
© 2022. The Author(s).
Conflict of interest statement
The authors declare that they have no competing interests.
Figures


Similar articles
-
FTIR and Raman Spectroscopy-Based Biochemical Profiling Reflects Genomic Diversity of Clinical Candida Isolates That May Be Useful for Diagnosis and Targeted Therapy of Candidiasis.Int J Mol Sci. 2019 Feb 25;20(4):988. doi: 10.3390/ijms20040988. Int J Mol Sci. 2019. PMID: 30823514 Free PMC article.
-
Identification of the Crucial Gene in Overflow Arteriovenous Fistula by Bioinformatics Analysis.Front Physiol. 2021 Aug 4;12:621830. doi: 10.3389/fphys.2021.621830. eCollection 2021. Front Physiol. 2021. PMID: 34421628 Free PMC article.
-
Emergence of non-Candida albicans species: Epidemiology, phylogeny and fluconazole susceptibility profile.J Mycol Med. 2018 Mar;28(1):51-58. doi: 10.1016/j.mycmed.2017.12.008. Epub 2018 Feb 1. J Mycol Med. 2018. PMID: 29366545
-
Candida glabrata, Candida parapsilosis and Candida tropicalis: biology, epidemiology, pathogenicity and antifungal resistance.FEMS Microbiol Rev. 2012 Mar;36(2):288-305. doi: 10.1111/j.1574-6976.2011.00278.x. Epub 2011 Jun 6. FEMS Microbiol Rev. 2012. PMID: 21569057 Review.
-
Two unlike cousins: Candida albicans and C. glabrata infection strategies.Cell Microbiol. 2013 May;15(5):701-8. doi: 10.1111/cmi.12091. Epub 2013 Jan 14. Cell Microbiol. 2013. PMID: 23253282 Free PMC article. Review.
Cited by
-
Transcriptomic meta-analysis to identify potential antifungal targets in Candida albicans.BMC Microbiol. 2024 Feb 27;24(1):66. doi: 10.1186/s12866-024-03213-8. BMC Microbiol. 2024. PMID: 38413885 Free PMC article.
-
Coexpression network analysis of human candida infection reveals key modules and hub genes responsible for host-pathogen interactions.Front Genet. 2022 Nov 22;13:917636. doi: 10.3389/fgene.2022.917636. eCollection 2022. Front Genet. 2022. PMID: 36482897 Free PMC article.
-
The Dual Roles of Activating Transcription Factor 3 (ATF3) in Inflammation, Apoptosis, Ferroptosis, and Pathogen Infection Responses.Int J Mol Sci. 2024 Jan 9;25(2):824. doi: 10.3390/ijms25020824. Int J Mol Sci. 2024. PMID: 38255898 Free PMC article. Review.
-
Computational prediction of Homo sapiens-Candida albicans protein-protein interactions reveal key virulence factors using dual RNA-Seq data analysis.Arch Microbiol. 2025 Apr 6;207(5):115. doi: 10.1007/s00203-025-04312-4. Arch Microbiol. 2025. PMID: 40188396
References
-
- Sardi JCO, Scorzoni L, Bernardi T, Fusco-Almeida AM, Mendes Giannini MJS. Candida species: current epidemiology, pathogenicity, biofilm formation, natural antifungal products and new therapeutic options. J Med Microbiol. 2013;62(Pt 1):10–24. - PubMed
-
- Pfaller MA, Castanheira M. Nosocomial candidiasis: antifungal stewardship and the importance of rapid diagnosis. Med Mycol. 2016;54(1):1–22. - PubMed
Publication types
MeSH terms
Substances
Grants and funding
LinkOut - more resources
Full Text Sources
Medical
Miscellaneous
