. 2022 May;298(5):101849.
doi: 10.1016/j.jbc.2022.101849. Epub 2022 Mar 18.

Mycobacterium tuberculosis encodes a YhhN family membrane protein with lysoplasmalogenase activity that protects against toxic host lysolipids

Affiliations

Mycobacterium tuberculosis encodes a YhhN family membrane protein with lysoplasmalogenase activity that protects against toxic host lysolipids

Marianne S Jurkowitz et al. J Biol Chem. 2022 May.

Abstract

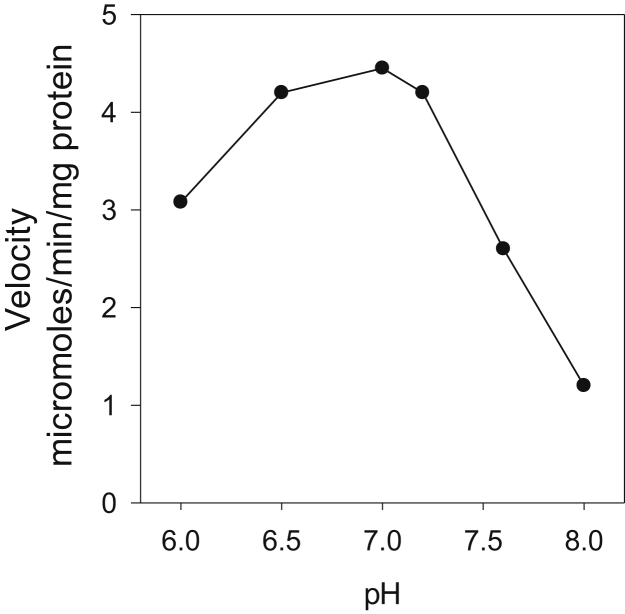
The pathogen Mycobacterium tuberculosis (M.tb) resides in human macrophages, wherein it exploits host lipids for survival. However, little is known about the interaction between M.tb and macrophage plasmalogens, a subclass of glycerophospholipids with a vinyl ether bond at the sn-1 position of the glycerol backbone. Lysoplasmalogens, produced from plasmalogens by hydrolysis at the sn-2 carbon by phospholipase A2, are potentially toxic but can be broken down by host lysoplasmalogenase, an integral membrane protein of the YhhN family that hydrolyzes the vinyl ether bond to release a fatty aldehyde and glycerophospho-ethanolamine or glycerophospho-choline. Curiously, M.tb encodes its own YhhN protein (MtbYhhN), despite having no endogenous plasmalogens. To understand the purpose of this protein, the gene for MtbYhhN (Rv1401) was cloned and expressed in Mycobacterium smegmatis (M.smeg). We found the partially purified protein exhibited abundant lysoplasmalogenase activity specific for lysoplasmenylethanolamine or lysoplasmenylcholine (pLPC) (Vmax∼15.5 μmol/min/mg; Km∼83 μM). Based on cell density, we determined that lysoplasmenylethanolamine, pLPC, lysophosphatidylcholine, and lysophosphatidylethanolamine were not toxic to M.smeg cells, but pLPC and LPC were highly toxic to M.smeg spheroplasts, which are cell wall-deficient mycobacterial forms. Importantly, spheroplasts prepared from M.smeg cells overexpressing MtbYhhN were protected from membrane disruption/lysis by pLPC, which was rapidly depleted from the media. Finally, we found that overexpression of full-length MtbYhhN in M.smeg increased its survival within human macrophages by 2.6-fold compared to vector controls. These data support the hypothesis that MtbYhhN protein confers a growth advantage for mycobacteria in macrophages by cleaving toxic host pLPC into potentially energy-producing products.

Keywords: Mycobacterium smegmatis; Mycobacterium tuberculosis Rv1401 gene; YhhN protein; cell injury and protection; cell wall–deficient; lysoplasmalogen/lysophospholipid; lysoplasmalogenase; macrophage; phospholipase A; spheroplasts.


Conflict of interest statement

Conflict of interest The authors declare that they have no conflicts of interest with the contents of this article

Figures

Figure 1
Figure 1
Pathways for plasmalogen metabolism in macrophages.
Figure 2
Figure 2
Purification of the MtbYhhN protein of 261 amino acids.A, Elution profile from a Mono Q anion exchange column. B, Elution profile from a hydroxyapatite (CHT2) column. Lysoplasmalogenase activities (filled circles) were determined by the coupled enzyme spectrophotometric assay and expressed in nmol/min/fraction. The substrate was 400 μM pLPC. Protein levels (open circles) were determined by Bradford assay and are given in μg/fraction. The dashed line represents the salt gradient. These elution profiles are shown for one purification that is representative of three. pLPC, lysoplasmenylcholine.
Figure 3
Figure 3
SDS-PAGE analysis of the 261-aa MtbYhhN protein during purification. The 4 to 20% polyacrylamide gel was stained with Coomassie. The arrows point to enriched bands at 38 and 23 kDa that were cut out of lane nine and submitted for proteomics analysis. Lanes 1 and 10, protein ladder; Lane 2, solubilized membrane fraction that was loaded onto Mono Q (19.3 units); Lane 3, Mono Q fraction 26 (9.6 units); Lane 4, Mono Q fractions 27 to 32 (32.8 units); Lane 5, Mono Q fraction 34 (14 units); Lane 6, hydroxyl apatite (HA) fractions 47 to 48 (28.7 units); Lane 7, HA fractions 49, 50 (163.8 units); Lane 8, HA fractions 51 to 52 (172.5 units); Lane 9, HA fractions 54 to 58 (50.7 units).
Figure 4
Figure 4
Lysoplasmalogenase activity as a function of substrate concentration. Reaction velocities were determined by coupled enzyme spectrophotometric assay. Substrates were pLPC (filled circles) or pLPE (open circles). One microgram of enzyme from the hydroxyl apatite column–pooled fractions 49 to 52 was added per 0.52 ml of reaction mixture. Each point represents the average of two duplicate assays, and the standard deviations were less than 20%. The experiment was typical of three experiments, using pooled fraction from a hydroxyapatite column similar to fractions 49 to 52, but from a different enzyme purification preparation. pLPC, lysoplasmenylcholine; pLPE, lysoplasmenylethanolamine.
Figure 5
Figure 5
Effect of varying pH on the hydrolysis of lysoplasmalogen (pLPC) by partially purified M.tb lysoplasmalogenase. The coupled enzyme assay was used with 80 mM 3-(N-morpholino)ethansulfonic acid (NaOH) for pH 5.5 to 6.7 and 80 mM glycylglycine (NaOH) for pH 7.5 to 7.9. Two micrograms of a partially purified fraction from the hydroxyapatite column were added per 0.5 ml of incubation reaction mixture. The concentration of pLPC was 300 μM. Data are shown from one experiment representative of three experiments. pLPC, lysoplasmenylcholine.
Figure 6
Figure 6
Competitive inhibition of M.tb lysoplasmalogenase by lysophosphatidic acid (LPA). Lysoplasmalogenase activity as a function of lysoplasmalogen concentration in the presence of different concentrations of LPA at pH 7.0: 0 μM (filled circles), 47 μM (open circles), 94 μM (open triangles), and 185 μM (filled squares). The enzyme activity was measured using the coupled enzyme assay. The enzyme source was 1.5 μg protein of a pooled fraction from a hydroxyapatite column similar to fractions 49 to 52, but from a different enzyme purification preparation. Data are shown from one experiment that is representative of three.
Figure 7
Figure 7
The effects of lysoplasmenylphospholipids on growth of mycobacterial cells and the effects of lysoplasmenyl- and lysophosphatidyl-phospholipids and SDS on suspensions of mycobacterial cells. The effects of pLPC and pLPE on the growth of M. smegmatis mc2155/pSMT3 (vector control: VC) cells (A) and mc2155/pSMT3Rv1401(1–261) [Rv1401] cells (B). The cells were growing in 7H9 media containing 0.5% glycerol and 11 mM glucose at pH 6.6, with and without 200 μM pLPC or pLPE. Overnight cultures of M.smeg cells were inoculated into the media to give an initial OD600 between 0.12 and 0.16. The means and S.D.s of eight experiments are shown in A and B. The cells were incubated at 170 rpm and 37 °C. Aliquots were removed at indicated times for reading on a spectrophotometer. The standard error bars are shown, and the number of experiments was 7 to 9. C, vector control and Rv1401-overexpressing cells are incubated in 7H9 media at an initial OD600 of 0.53 to 0.54. The 7H9 media was either pH 6.6 or pH 5.9. The latter pH was adjusted by addition of 20 mM MES (morpholino-sulfonic acid). The cells were treated with 200 μM pLPC, pLPE, or LPC, or 0.25% sodium dodecylsulfate (SDS), at the arrow. These experiments are representative of 3 to 5 experiments. Only one line is shown, indicating there was no effect on OD600 by any of these compounds—the cells were resistant to lysis and at both pH 6.6 and pH 5.9. pLPC, lysoplasmenylcholine; pLPE, lysoplasmenylethanolamine.
Figure 8
Figure 8
The effects of lysoplasmenylcholine (pLPC) and lysoplasmenylethanolamine (pLPE) on OD600of mc2155/pSMT3 (vector control; VC) and mc2155/pSMT3Rv1401(1–261) [Rv1401] spheroplasts. The concentrations of pLPC and pLPE (in mM) remaining in the media are shown in lower parts of graphs AC. In A, B, and C, pLPC causes sharp decreases in OD600 of vector control (VC) spheroplasts (solid lines) that is dependent on the concentration of pLPC. The Rv1401 spheroplasts (dashed lines) have significantly smaller decreases in OD600 than the VC spheroplasts at each level of pLPC. C, the lack of effect of 200 μM pLPE on the OD600 of VC (filled triangles) and Rv1401 (unfilled triangles) spheroplasts. In (B), the effects of adding pLPC to VC (red solid line) and to Rv1401 (red dashed line) spheroplasts incubated in SMM media at pH 5.9 are shown in red. AC, show the levels of pLPC (diamonds) or pLPE (triangles) remaining in the media following its addition at the arrows and rapid pulse centrifugation to remove spheroplasts from the media. These studies show the rapid depletion of pLPC from the medium in the Rv1401-expressing spheroplasts (unfilled diamonds). In (C) the level of pLPE is also rapidly depleted from the media in the Rv1401 spheroplasts (unfilled triangles), indicating that it is also catabolized by the MtbYhhN protein. D, addition of pLPC in four doses of 25 μM each to VC spheroplasts causes the same decrease in OD600 as when 100 μM is added as a single dose. However, when the pLPC is delivered in four doses to the Rv1401 spheroplasts, the total decrease in OD600 is much less than when delivered as a single bolus (B). These spheroplasts were suspended in SMM (500 mM sucrose, 20 mM MgCl2, 20 mM Na Maleate, pH 6.6 or pH 5.9). The OD600 measurements were determined using spectrophotometry in a Beckman DU 65 spectrophotometer. The concentrations of pLPC or pLPE remaining in the media were determined by the coupled enzyme assay. Data are shown from one experiment that is representative of seven experiments measuring OD600 and of three experiments measuring concentrations of pLPC and pLPE in media. pLPC, lysoplasmenylcholine; pLPE, lysoplasmenylethanolamine.
Figure 9
Figure 9
The effects of acyl-linked lysophospholipids—lysophosphatidylcholine (LPC) and lysophosphatidylethanolamine (LPE)—and of the detergent, sodium dodecylsulfate (SDS), on the OD600of suspensions of spheroplasts derived from M. smegmatis mc2155/pSMT3 (vector control: VC) and mc2155/pSMT3Rv1401(1–261) [Rv1401] cells.A, 200 μM lysophosphatidylcholine (LPC) causes a sharp decline in the OD600 of both VC (filled circles) and Rv1401 spheroplasts (unfilled circles). 200 μM lysophosphatidylethanolamine (LPE), similar to lysoplasmenylethanolamine (pLPE), does not affect the OD600 of VC (filled triangles) or Rv1401 (unfilled triangles) spheroplasts. Arrow indicates the addition of LPLs. B, 0.25%. SDS, added at arrows, causes immediate drop in OD600 of both VC (filled circles) and Rv1401 (unfilled circles) spheroplasts. Data are shown from one experiment that is representative of five experiments.
Figure 10
Figure 10
Photomicrographs of mc2155/pSMT3 (vector control or VC) cells and spheroplasts and of mc2155/pSMT3Rv1401(1–261) [Rv1401] cells and spheroplasts. The cells were suspended in 7H9 media supplemented with 0.5% glycerol and 11 mM glucose. The spheroplasts were suspended in SMM (500 mM sucrose, 20 mM MgCl2, 20 mM Na Maleate, pH 6.6). The OD600 measurements were determined using spectrophotometry in a Beckman DU 65 spectrophotometer. A and B, mc2155/pSMT3 (VC) and mc2155/pSMT3Rv1401(1–261) cells, respectively: These are control cells with no treatment. C and D, untreated VC and Rv1401 spheroplasts, respectively. These spheroplasts were subsequently treated with the slow addition of 100 μM pLPC (Fig. 8D). E, microscopy of the VC spheroplasts within 10 min following treatment with pLPC; note the lack of spheroplasts. F, the Rv1401 spheroplasts 10 min following treatment with pLPC, with many spheroplasts, similar to the untreated Rv1401 spheroplasts (D). G and H, control VC and Rv1401 spheroplasts, respectively, that have been treated with 0.25% SDS. Both panels show relatively bare fields, with tiny particles that are possibly lipid micelles. The aliquots for microscopy were taken from the experiment shown in (D). The bar is 5 μm. Magnification was 100x with oil immersion.
Figure 11
Figure 11
Comparison of reversion and growth in mc2155/pSMT3 (vector control) and in mc2155/pSMT3Rv1401(1–261) [Rv1401] spheroplasts following treatment with pLPC. The vector control and Rv1401 spheroplasts were incubated in 7H9 media with 300 mM sucrose (to maintain isotonicity), 0.5% glycerol, and 1% glucose. The initial OD600 of spheroplast suspensions was around 0.5 nm. The spheroplasts were then treated with pLPC; μM: 0 (filled circles), 50 pLPC (unfilled circles), 100 (filled triangles), and 175 (unfilled triangles). The 5 min OD600 values were recorded near the 0 time points. Subsequently, 0.52-ml aliquots were transferred to cuvettes at indicated time points over 83 h, and the OD600 was measured. A, empty vector control spheroplasts. B, Rv1401 spheroplasts overexpressing MtbYhhN protein. The OD600 of the treated Rv1401spheroplasts are increasing at faster rates than the VC-treated spheroplasts. Data are shown from one experiment that is representative of three experiments.
Figure 12
Figure 12
Effects of expression of full-length active MtbYhhN protein (261 amino acids) in M.smeg bacterial cells on their intracellular viability in human macrophages. Human macrophages (MDMs) were infected with either mc2155/pSMT3 (vector control; filled circles) or mc2155/pSMT3Rv1401(1–261) expressing MtbYhhN protein of 261 amino acids (RV1401–261 amino acids; filled triangles). Infected macrophages were lysed at different time points of incubation (2, 6, and 24 h) and lysates plated for bacterial growth and bacterial number counted in CFUs. Significant difference in intracellular growth was observed between M.smeg expressing MtbYhhN protein of 261 amino acids and M.smeg containing empty vector control (∗∗ p = 0.0035; ∗∗∗∗ p = <0.0001 [2-way ANOVA; Tukey’s test]). Each point is the mean of three incubations. The experiment is representative of three experiments. CFUs, colony-forming units.
Figure 13
Figure 13
Predicted structure of the MtbYhhN protein of 261 amino acids using covariation analysis and Rosetta energy minimization modeling programs developed by the Baker Laboratory (42, 43). A and C, lateral views with periplasmic side at the top and the cytoplasmic side at the bottom. B and D, the structures have been rotated by 90o to show the periplasmic side facing the reader. The eight transmembrane helices are numbered in A and B. In B, the highly conserved residues that cluster in the interior to form a putative active site (36) are shown with side chains in stick form and labeled. C and D, show coevolving residue pairs connected by green bonds for distances between coevolving residue pairs less than 5 Å and yellow bonds for distance less than 10 Å.

Similar articles

Cited by

References

    1. Rohde K., Yates R.M., Purdy G.E., Russell D.G. Mycobacterium tuberculosis and the environment within the phagosome. Immunol. Rev. 2007;210:37–54. - PubMed
    1. Sturgill-Koszycki S., Schlesinger P.H., Chakraborty P., Haddix P.L., Collins H.L., Fok A.K., Allen R.D., G luck S.L., Heuser J., Russell D.G. Lack of acidification in Mycobacterium phagosomes produced by exclusion of the vesicular proton-ATPase. Nature. 2004;263:678–681. - PubMed
    1. Vergne I., Fratti R.A., Hill P.J., Chua J., Belisle J., Deretic V. Mycobacterium tuberculosis Phagosome maturation arrest: Mycobacterial phosphatidylinositol analog phosphatidylinositol mannoside stimulates early endosomal fusion. Mol. Biol. Cell. 2004;15:751–760. - PMC - PubMed
    1. Clemens D.L., Horwitz M.A. Characterization of the Mycobacterium tuberculosis phagosome and evidence that phagosomal maturation is inhibited. J. Exp. Med. 1995;181:257–270. - PMC - PubMed
    1. Weiss G., Schwaible U.E. Macrophage defense mechanisms against intracellular bacteria. Immunol. Rev. 2015;264:182–203. - PMC - PubMed

Publication types