. 2022 Apr:173:150-159.
doi: 10.1016/j.ejpb.2022.03.001. Epub 2022 Mar 21.

Safety, efficacy and delivery of multiple nucleoside analogs via drug encapsulated carbon (DECON) based sustained drug release platform

Affiliations

Safety, efficacy and delivery of multiple nucleoside analogs via drug encapsulated carbon (DECON) based sustained drug release platform

Tejabhiram Yadavalli et al. Eur J Pharm Biopharm. 2022 Apr.

Abstract

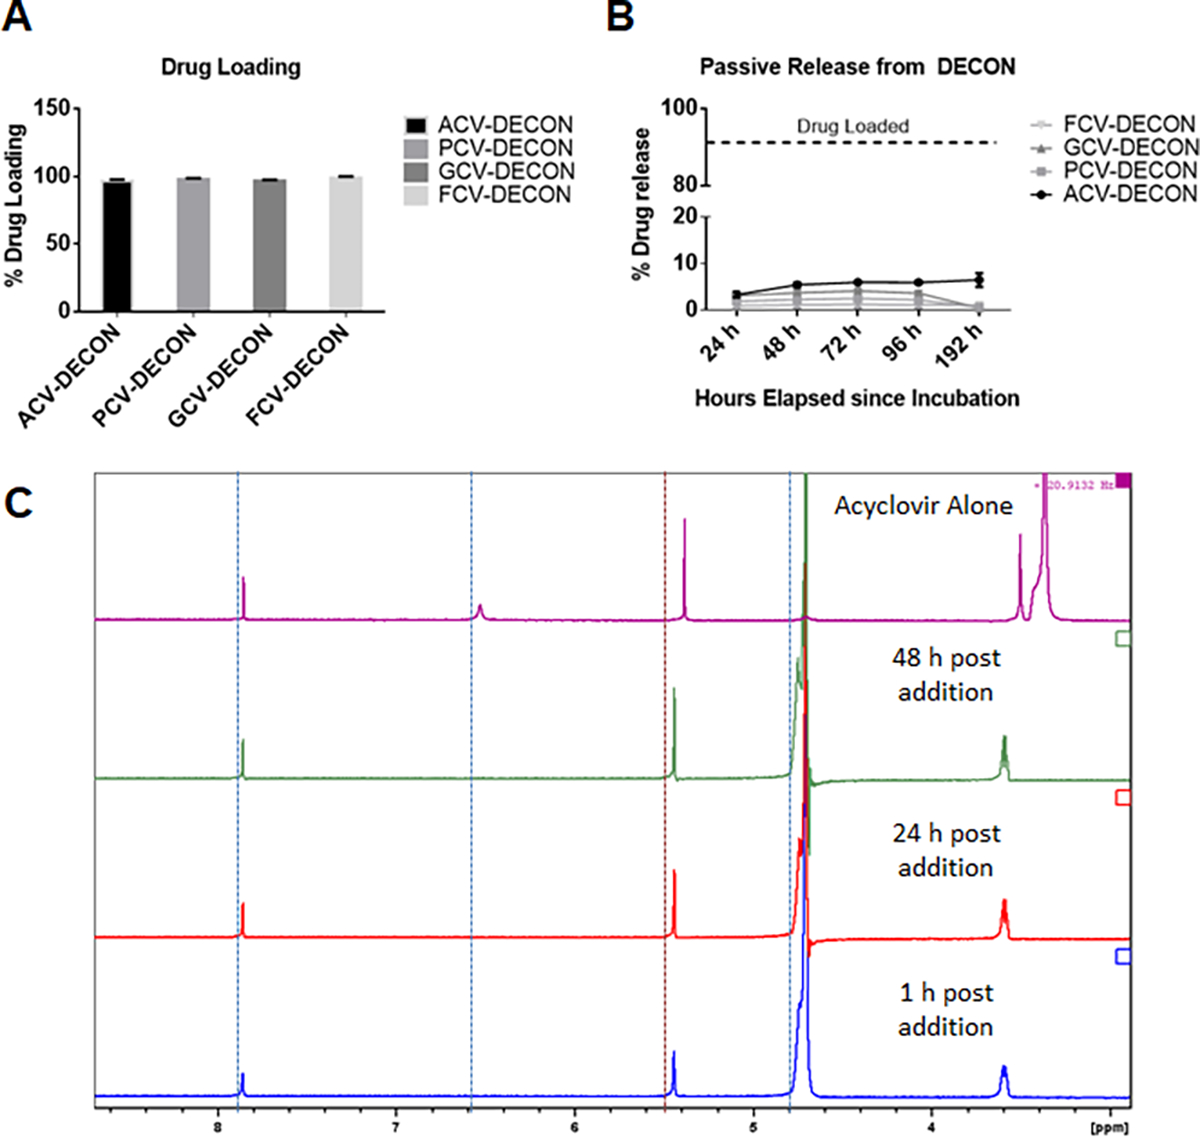
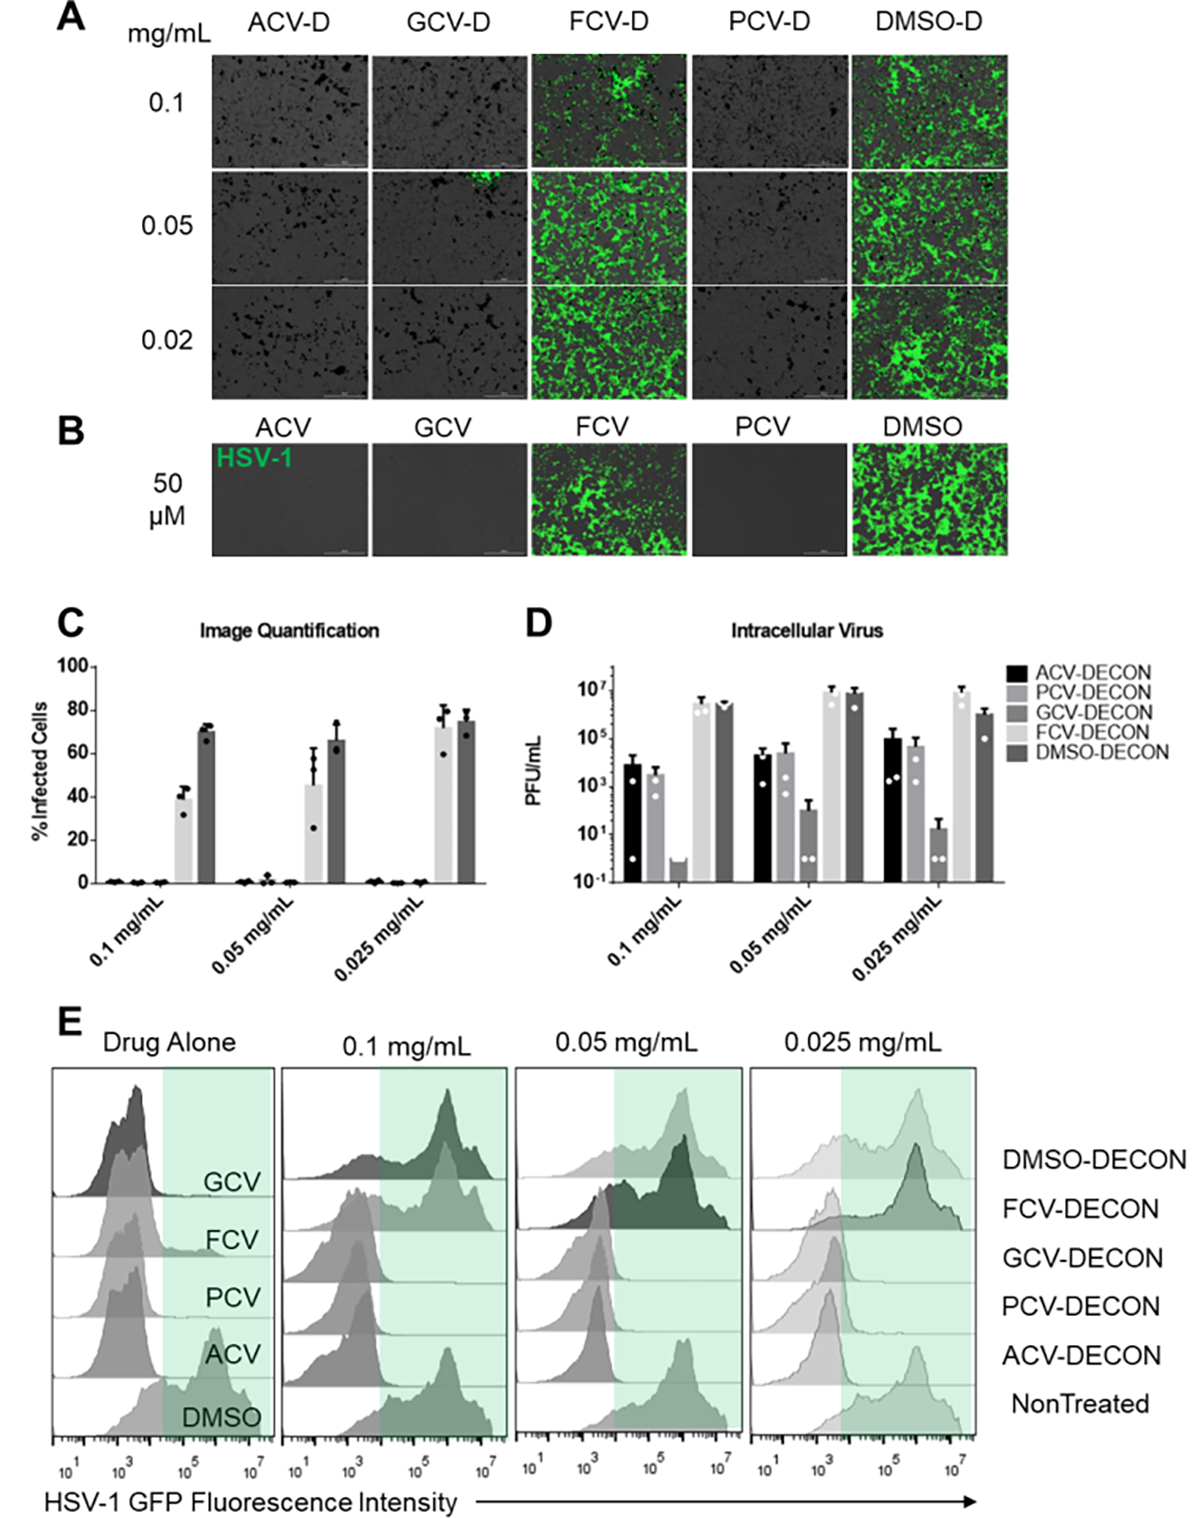
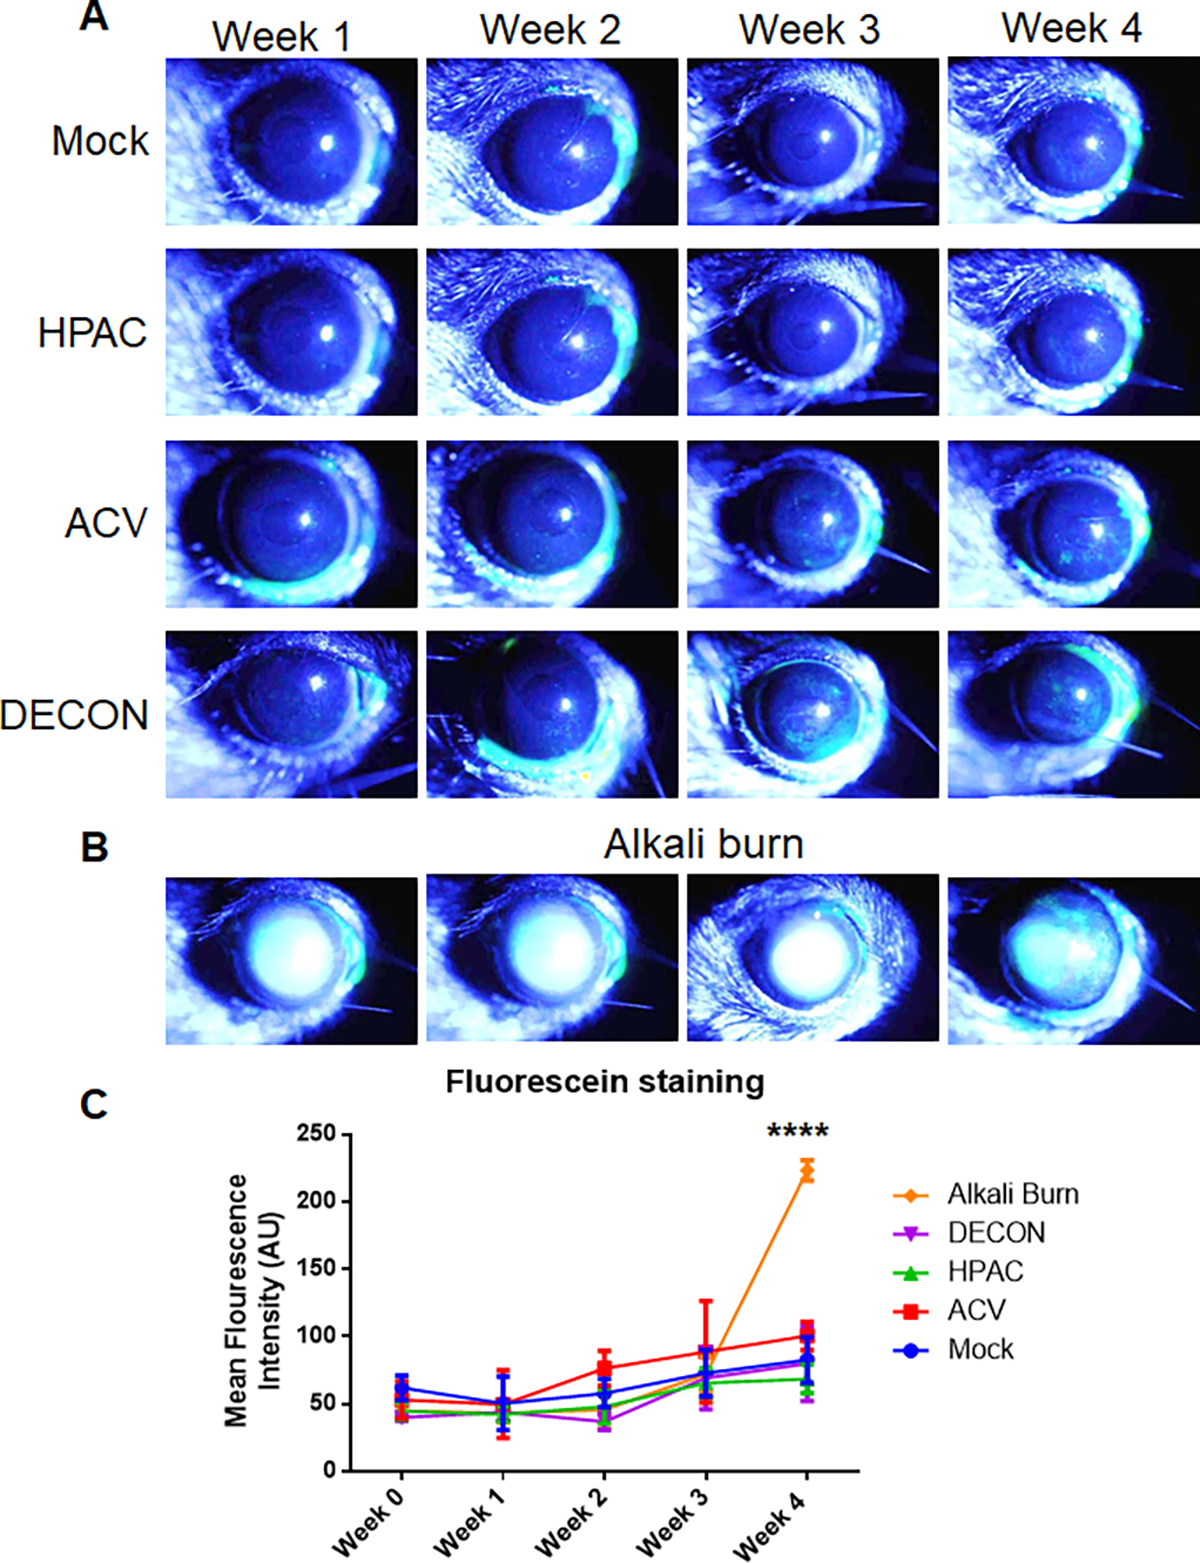
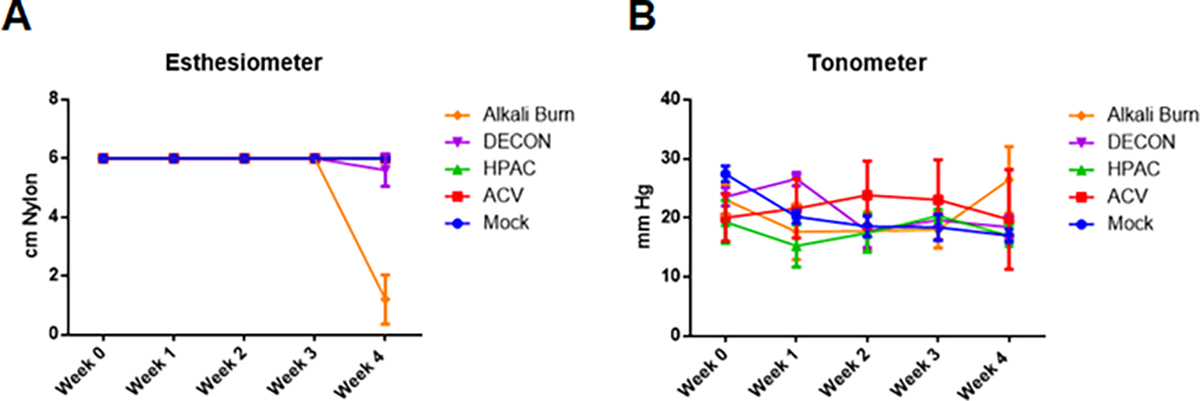
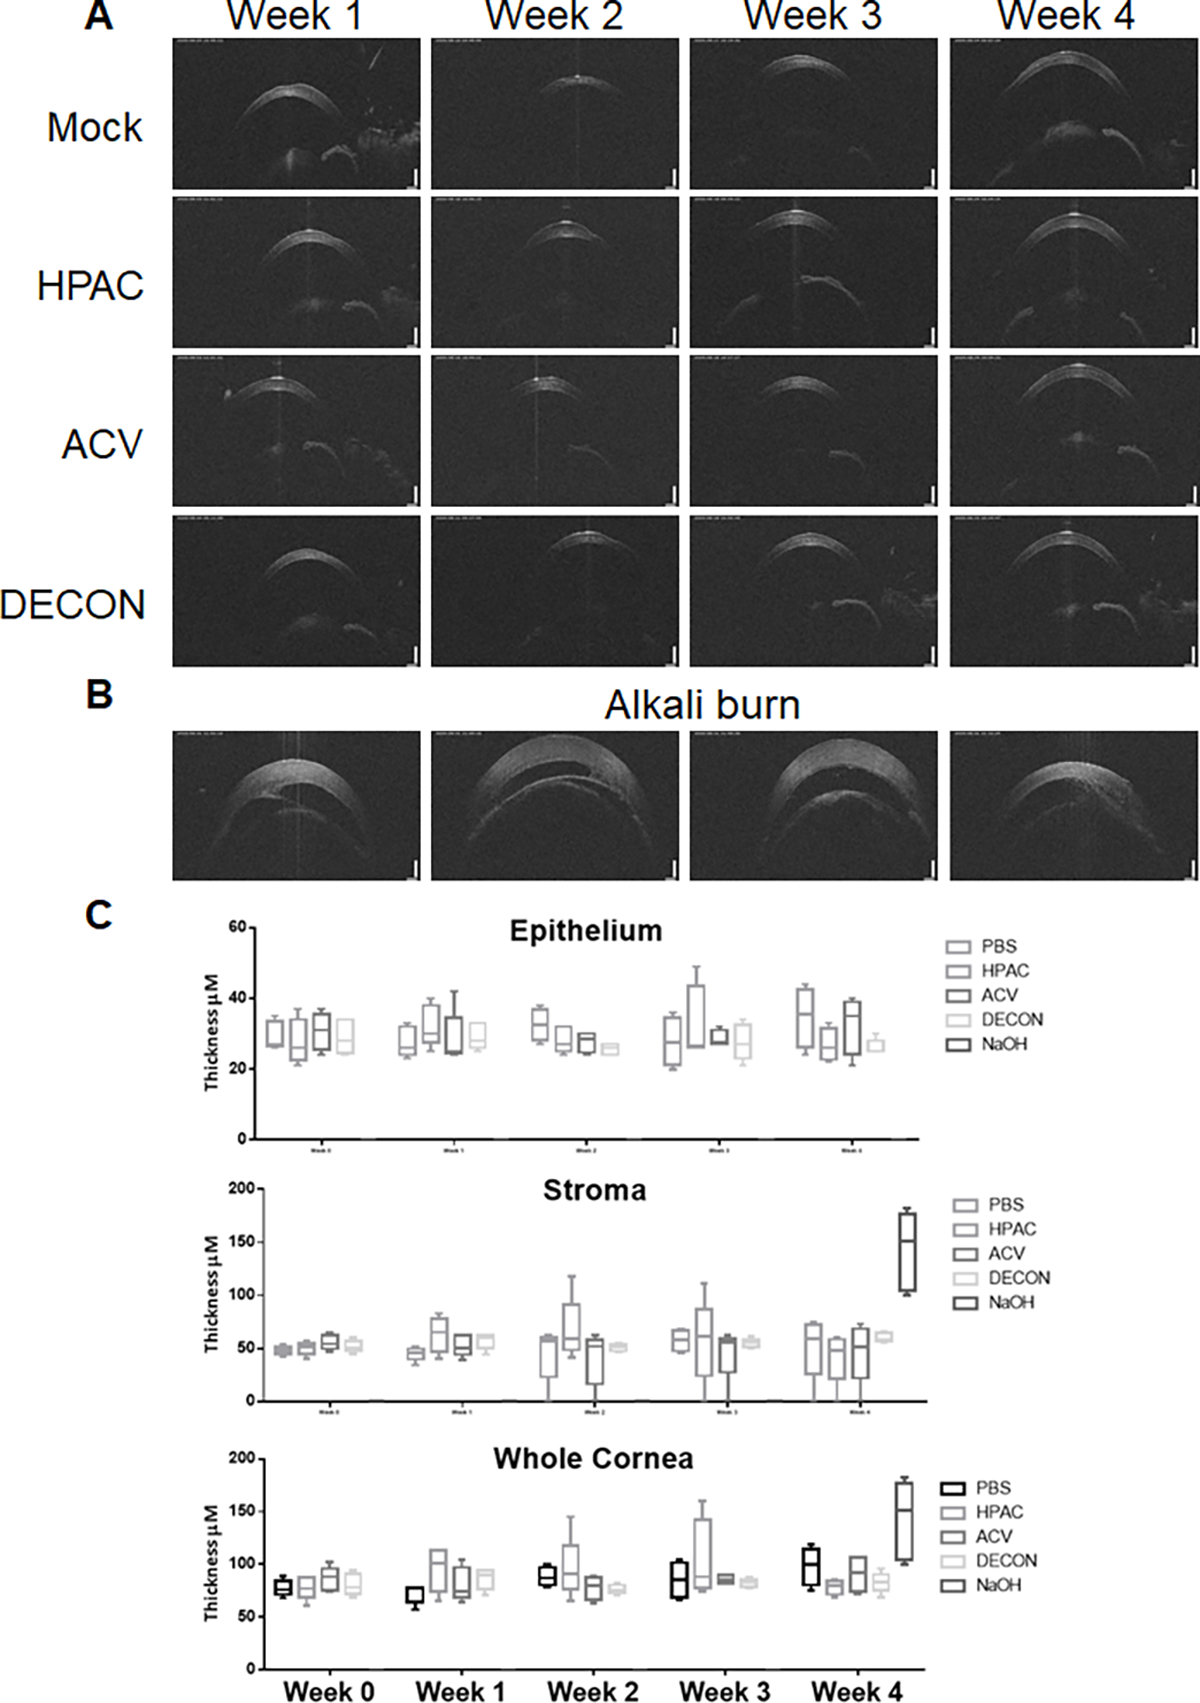
Acyclovir and similar nucleoside analogs form an essential frontline treatment for various herpesvirus infections of the eye. However, these drugs have low ocular retention when delivered topically and need to be administered several times every day. We have previously demonstrated that acyclovir loaded into activated carbon can be used to significantly decrease dosage frequency in a murine model of ocular infection. In this study, we demonstrate that other nucleoside analogs such as ganciclovir, penciclovir and famciclovir have excellent loading and release profile similar to acyclovir. Similarly we also demonstrate that nucleoside analog loaded carbons termed DECON are effective at very low concentrations in treating active viral infection of human corneal epithelial cells. In this study, using a variety of techniques to evaluate corneal dryness, nerve sensitivity, intraocular pressure, corneal thickness, and somatic inflammation, we report that DECON is well tolerated after administration three times daily over the course of four weeks.

Keywords: Activated carbon; Acyclovir; Herpes simplex virus; Nucleoside analogs; Ocular toxicity; Topical delivery.


Conflict of interest statement

Conflicts of interest

There are no conflicts to declare.

Figures

Fig 1.
Fig 1.. Evaluation of drug loading and release from DECON.
10 μL of 50 mM ACV, PCV, GCV or FCV were incubated with 0 or 1 mg/mL of activated carbon particles dispersed in PBS at room temperature overnight. (A) Post incubation, the activated carbon was separated from the PBS solution by centrifugation. This supernatant contained any drug that was not loaded into the carbon and sent for mass spectrometric evaluation. Triplicate results showing extent of drug loaded onto the carbon by the evaluation of non-loaded drug in the supernatant. (B) Activated carbon particles were washed with PBS 3 times prior to resuspending them in fresh PBS for a period of 24, 48, 72 or 96 hours. The samples at the specified time were centrifuged at 10,000g and the supernatant was evaluated for the extent of drug released from the carbon via mass spectrometry. (C) One dimensional proton spectrum of residual acyclovir in solution of D2O after the addition of activated carbon. The 1D proton spectra are displayed in order, from bottom to top: 2 mM acyclovir in the presence of 0.1 mg/mL activated carbon at 1, 24, and 48 hours after mixing. At the very top, is the 1D proton spectrum of acyclovir in D2O alone.
Fig 2.
Fig 2.. In vitro antiviral activity of ACV, PCV, GCV and FCV loaded DECON.
Human corneal epithelial (HCE) cells were infected with HSV-1 17 GFP, a GFP producing reporter virus at an MOI of 0.1. ACV, GCV FCV or PCV loaded DECON along with DMSO loaded DECON at shown concentrations was added therapeutically at 2 hours post infection and incubated for the next 22 hours.(A) Representative fluorescent images showing extent of infected cells (green) in each treatment group. (B) As a positive control, ACV, GCV, FCV and PCV were added at 2 hours post infection and imaged at 24 hours post infection. (C) Quantitative analysis of the fluorescence seen from 3 images taken from triplicate experiments. (D) Plaque assay data representing extent of infectious virus present in the cells post treatment with various DECON particles at different concentrations. (E) Flow cytometry data represented as histograms showing extent of infected cells based on GFP fluorescence recorded due to HSV-1 infection. Green panel in each of the data sets segregates the HSV-1 positive population from those non-infected.
Figure 3.
Figure 3.. DECON treatment does not significantly impact corneal dryness.
Over 4 weeks, DECON, HPAC, ACV, and PBS (mock) were administered 3 times a day. NaOH was introduced during week 4 to a separate group of mice as a control. (A) Anesthetized mice were placed in a holder and imaged weekly with a slit-lamp to visualize the whole corneas. A drop of fluorescein dye was instilled on the corneal surface followed by manual blinking of the eye. The eyes were then washed with artificial tears, dried and representative corneal images were procured in the GFP channel. Green staining represents fluorescein retention on the ocular surface which is an indirect indicator of corneal dryness. (B) An identical imaging process was followed for the NaOH treated mice, one week after the first administration of base. Images in A and B have been over exposed to be able to view minute differences between the groups. (C) Quantitative analysis of the fluorescein dye was performed using an unbiased method in ImageJ software. The values were interpreted such that greater mean fluorescence intensity (AU) was considered drier.
Figure 4.
Figure 4.. DECON treatment has no effect on ocular sensitivity or intraocular pressure.
Over 4 weeks, DECON, HPAC, ACV, and PBS (mock) were administered 3 times a day. NaOH was introduced during week 4 to a separate group of mice as a control. (A) Once a week, corneal sensitivity was assessed with an esthesiometer on wake mice. Values were interpreted such that a lower number indicated lower corneal sensitivity. (B) Once a week, intraocular pressure (IOP) was measured with a tonometer, averaged across triplicates. The device was calibrated specifically for use in murine models such that an increase in mmHg indicated an increase in IOP.
Figure 5.
Figure 5.. OCT imaging revealed no increase in corneal thickness following four week administration of DECON.
(A) Anesthetized mice were placed onto a holder and analyzed with an OCT probe weekly. On the first day of measurement, light intensity, focus, angle, and contrast were standardized and held constant for the duration of experimentation. (B) The same procedure was repeated for the alkali burn group at week 4, one week after administration of NaOH. (C) A box and whisker plot of the data taken during each week of experimentation was generated for epithelial, stromal, and aggregate corneal thickness.

Similar articles

Cited by

References

    1. Tsatsos M et al. Herpes simplex virus keratitis: an update of the pathogenesis and current treatment with oral and topical antiviral agents – comment. Clin. Exp. Ophthalmol. 45, 932 (2017). - PubMed
    1. Lairson DR, Begley CE, Reynolds TF & Wilhelmus KR Prevention of herpes simplex virus eye disease: a cost-effectiveness analysis. Arch. Ophthalmol. 121, 108–112 (2003). - PubMed
    1. Song X et al. A Multi-Center, Cross-Sectional Study on the Burden of Infectious Keratitis in China. PloS one 9, e113843 (2014). - PMC - PubMed
    1. Marchi S, Trombetta CM, Gasparini R, Temperton N & Montomoli E Epidemiology of herpes simplex virus type 1 and 2 in Italy: a seroprevalence study from 2000 to 2014. J Prev Med Hyg 58, E27–E33 (2017). - PMC - PubMed
    1. Sukik L, Alyafei M, Harfouche M & Abu-Raddad LJ Herpes simplex virus type 1 epidemiology in Latin America and the Caribbean: Systematic review and meta-analytics. PLoS One 14 (2019). - PMC - PubMed