

GIRK3 deletion facilitates kappa opioid signaling in chondrocytes, delays vascularization and promotes bone lengthening in mice
- PMID: 35314385
- PMCID: PMC9035100
- DOI: 10.1016/j.bone.2022.116391
GIRK3 deletion facilitates kappa opioid signaling in chondrocytes, delays vascularization and promotes bone lengthening in mice
Abstract
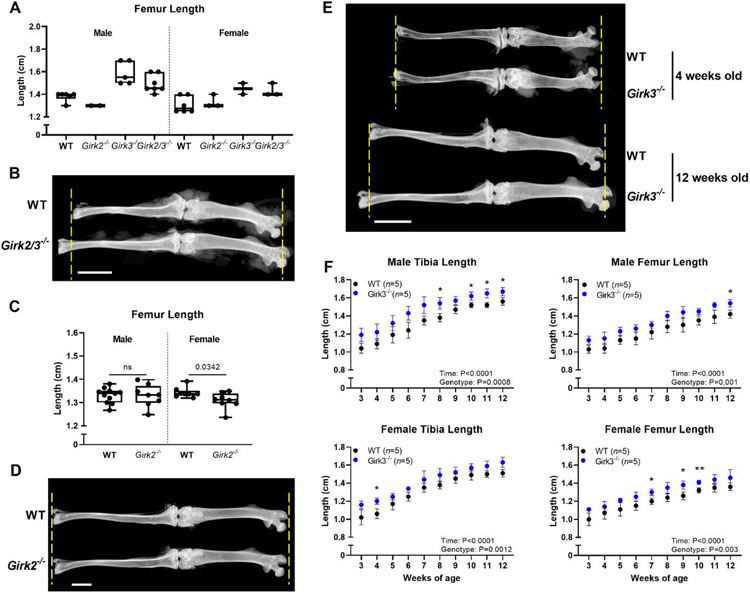
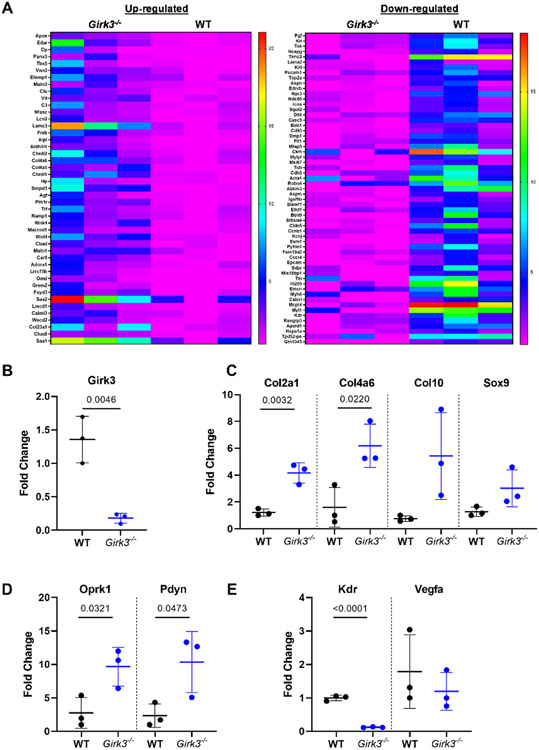
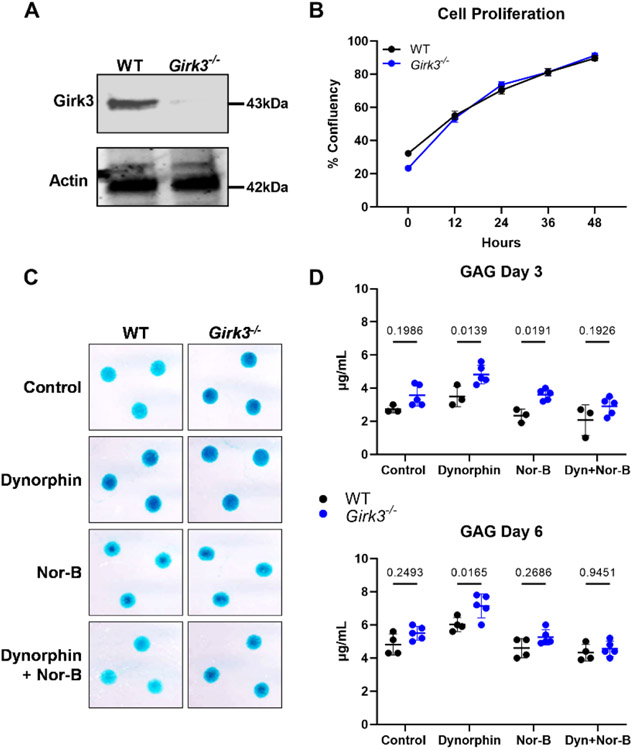
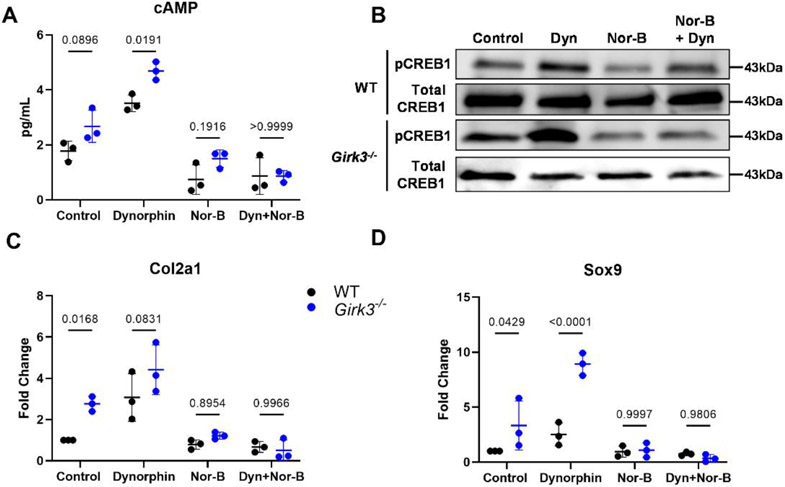
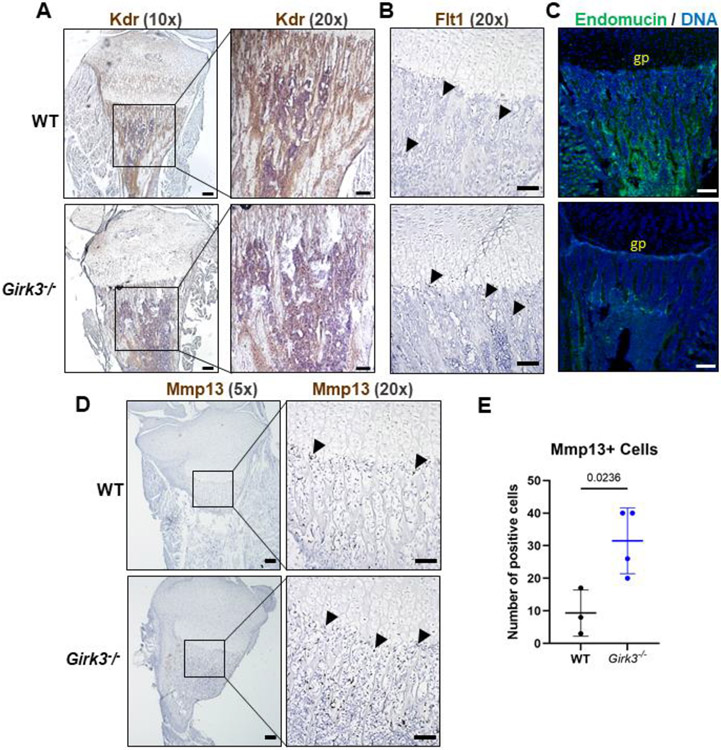
Long bones are formed and repaired through the process of endochondral ossification. Activation of G protein-coupled receptor (GPCR) signaling pathways is crucial for skeletal development and long bone growth. G protein-gated inwardly-rectifying K+ (GIRK) channel genes are key functional components and effectors of GPCR signaling pathways in excitable cells of the heart and brain, but their roles in non-excitable cells that directly contribute to endochondral bone formation have not been studied. In this study, we analyzed skeletal phenotypes of Girk2-/-, Girk3-/- and Girk2/3-/- mice. Bones from 12-week-old Girk2-/- mice were normal in length, but femurs and tibiae from Girk3-/- and Girk2/3-/- mice were longer than age-matched controls at 12-weeks-old. Epiphyseal chondrocytes from 5-day-old Girk3-/- mice expressed higher levels of genes involved in collagen chain trimerization and collagen fibril assembly, lower levels of genes encoding VEGF receptors, and produced larger micromasses than wildtype chondrocytes in vitro. Girk3-/- chondrocytes were also more responsive to the kappa opioid receptor (KOR) ligand dynorphin, as evidenced by greater pCREB expression, greater cAMP and GAG production, and upregulation of Col2a1 and Sox9 transcripts. Imaging studies showed that Kdr (Vegfr2) and endomucin expression was dramatically reduced in bones from young Girk3-/- mice, supporting a role for delayed vasculogenesis and extended postnatal endochondral bone growth. Together these data indicate that GIRK3 controls several processes involved in bone lengthening.
Keywords: Cartilage; Development; G protein; GPCR; K(+) channel; Kappa opioid.
Copyright © 2022 Elsevier Inc. All rights reserved.
Figures
Similar articles
-
Functional and biochemical evidence for G-protein-gated inwardly rectifying K+ (GIRK) channels composed of GIRK2 and GIRK3.J Biol Chem. 2000 Nov 17;275(46):36211-6. doi: 10.1074/jbc.M007087200. J Biol Chem. 2000. PMID: 10956667
-
Developmental regulation of G protein-gated inwardly-rectifying K+ (GIRK/Kir3) channel subunits in the brain.Eur J Neurosci. 2011 Dec;34(11):1724-36. doi: 10.1111/j.1460-9568.2011.07886.x. Epub 2011 Nov 18. Eur J Neurosci. 2011. PMID: 22098295 Free PMC article.
-
Evidence that neuronal G-protein-gated inwardly rectifying K+ channels are activated by G beta gamma subunits and function as heteromultimers.Proc Natl Acad Sci U S A. 1995 Jul 3;92(14):6542-6. doi: 10.1073/pnas.92.14.6542. Proc Natl Acad Sci U S A. 1995. PMID: 7604029 Free PMC article.
-
Molecular mechanisms of analgesia induced by opioids and ethanol: is the GIRK channel one of the keys?Neurosci Res. 2002 Oct;44(2):121-131. doi: 10.1016/s0168-0102(02)00094-9. Neurosci Res. 2002. PMID: 12354627 Review.
-
Bone tissue and histological and molecular events during development of the long bones.Ann Anat. 2021 May;235:151704. doi: 10.1016/j.aanat.2021.151704. Epub 2021 Feb 16. Ann Anat. 2021. PMID: 33600952 Review.
Cited by
-
Girk3 deletion increases osteoblast maturation and bone mass accrual in adult male mice.JBMR Plus. 2024 Aug 4;8(10):ziae108. doi: 10.1093/jbmrpl/ziae108. eCollection 2024 Oct. JBMR Plus. 2024. PMID: 39228688 Free PMC article.
-
Polydopamine Nanocomposite Hydrogel for Drug Slow-Release in Bone Defect Repair: A Review of Research Advances.Gels. 2025 Mar 8;11(3):190. doi: 10.3390/gels11030190. Gels. 2025. PMID: 40136895 Free PMC article. Review.
-
Postnatal deletion of Phlpp1 in chondrocytes delays post-traumatic osteoarthritis in male mice.Osteoarthr Cartil Open. 2024 Sep 27;7(1):100525. doi: 10.1016/j.ocarto.2024.100525. eCollection 2025 Mar. Osteoarthr Cartil Open. 2024. PMID: 39811690 Free PMC article.
-
Molecular roles in membrane receptor signaling pathways and cascade reactions in chondrocytes: a review.J Mol Histol. 2025 Feb 23;56(2):94. doi: 10.1007/s10735-025-10368-9. J Mol Histol. 2025. PMID: 39988650 Review.
-
Phlpp1 alters the murine chondrocyte phospho-proteome during endochondral bone formation.Bone. 2024 Dec;189:117265. doi: 10.1016/j.bone.2024.117265. Epub 2024 Sep 29. Bone. 2024. PMID: 39349089
References
-
- Kronenberg HM, Developmental regulation of the growth plate. Nature, 2003. 423(6937): p. 332–6. - PubMed
-
- Hall BK and Miyake T, All for one and one for all: condensations and the initiation of skeletal development. Bioessays, 2000. 22(2): p. 138–47. - PubMed
-
- Carpio LR and Westendorf JJ, Histone Deacetylases in Cartilage Homeostasis and Osteoarthritis. Curr Rheumatol Rep, 2016. 18(8): p. 52. - PubMed
Publication types
MeSH terms
Substances
Grants and funding
LinkOut - more resources
Full Text Sources
Molecular Biology Databases
Research Materials
