

Systematic review and meta-analysis of medicine use studies in Ethiopia using the WHO patient care indicators with an emphasis on the availability of prescribed medicines
- PMID: 35314470
- PMCID: PMC8938701
- DOI: 10.1136/bmjopen-2021-054521
Systematic review and meta-analysis of medicine use studies in Ethiopia using the WHO patient care indicators with an emphasis on the availability of prescribed medicines
Abstract
Objective: To collate the findings of studies on patient care indicators in Ethiopia using the WHO/International Network for Rational Use of Drugs indicators with a focus on the availability of medicines to patients.
Design: Systematic review and meta-analysis.
Data sources: Embase, Global Index Medicus, Google Scholar, Medline (via PubMed) and Web of Science.
Eligibility criteria: Medicine use studies employing the WHO patient care indicators across health facilities in Ethiopia.
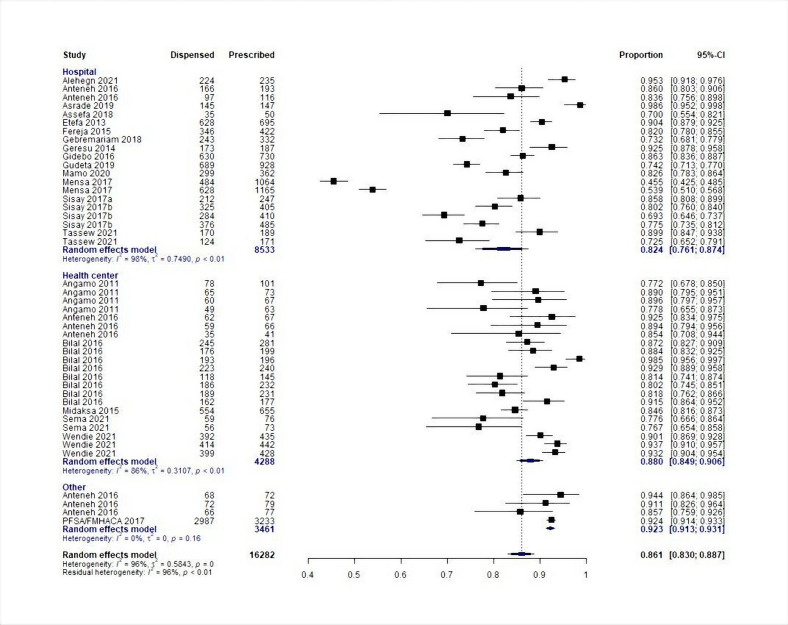
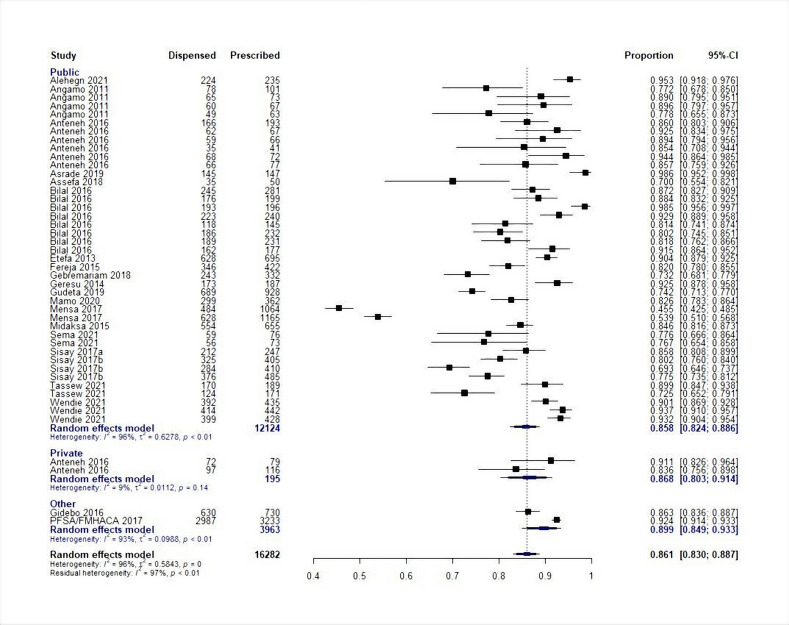
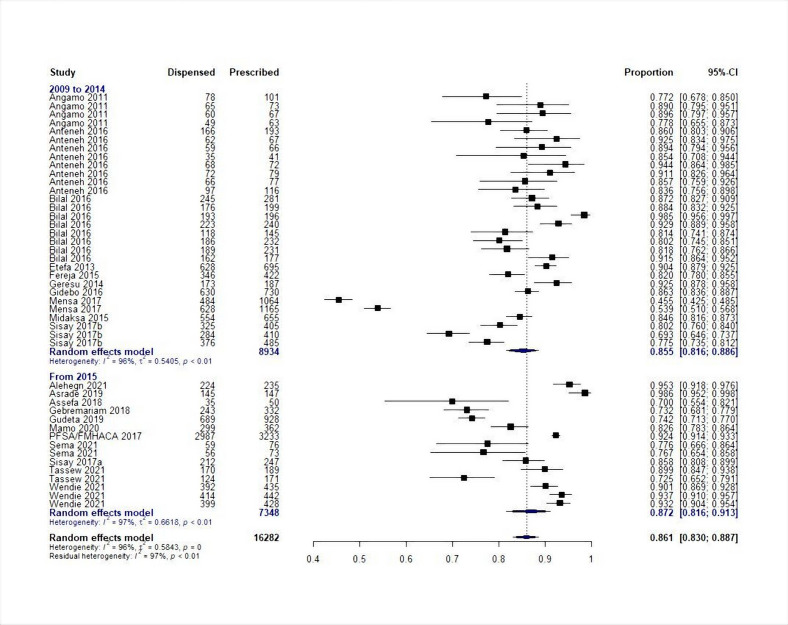
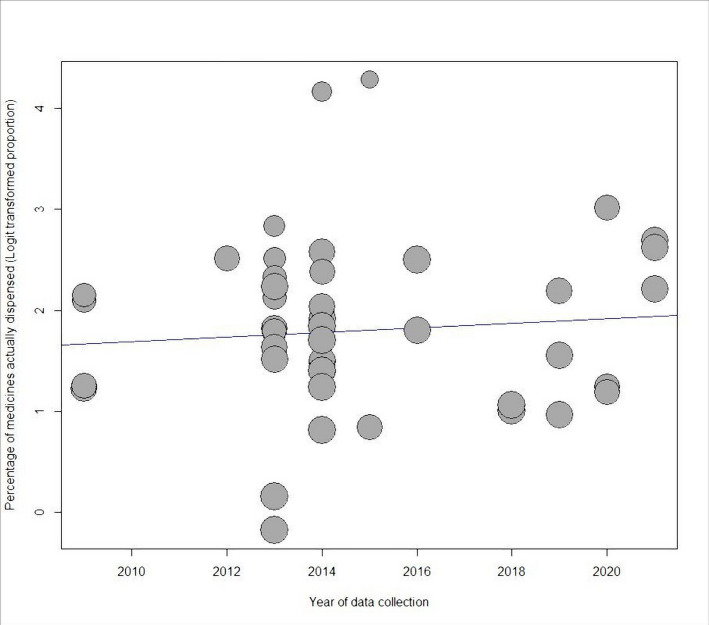
Data extraction and synthesis: Descriptive summary of the indicators and a random-effects meta-analysis were performed for quantitative synthesis of findings on the percentage of medicines actually dispensed. Meta-regression was performed to assess the moderator effects of different attributes of the studies.
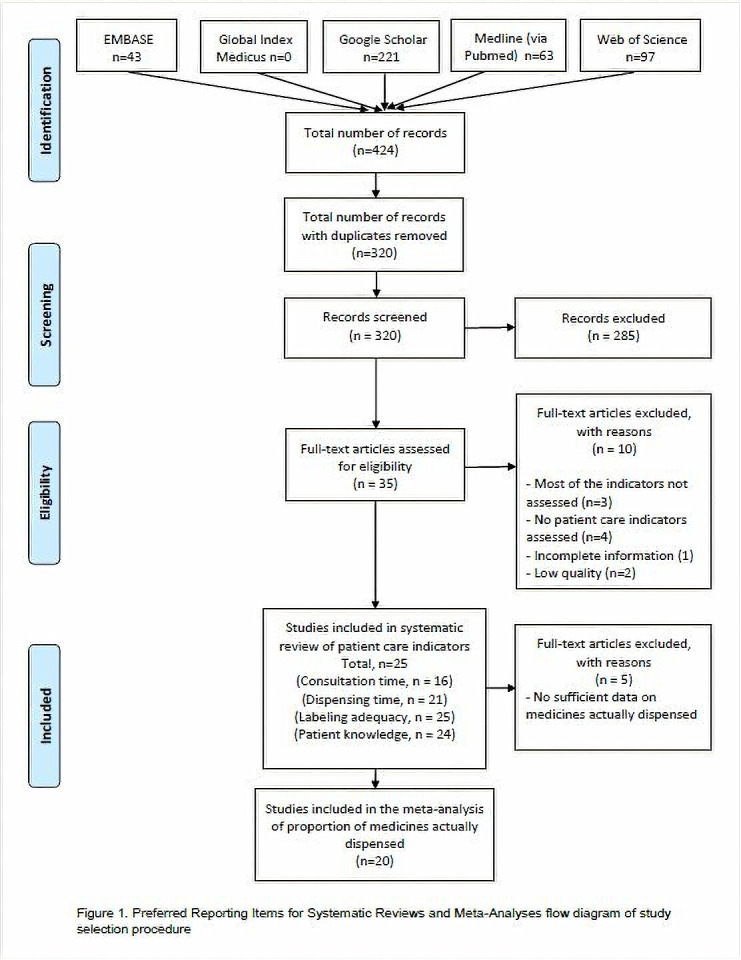
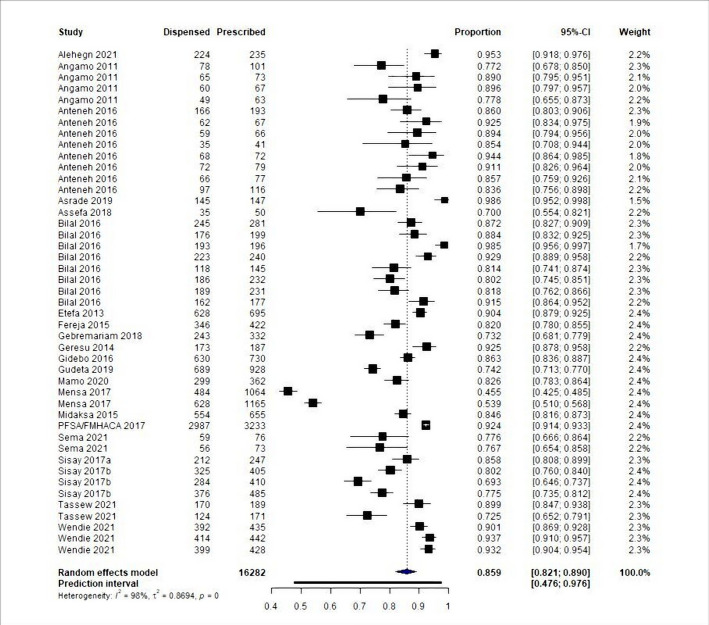
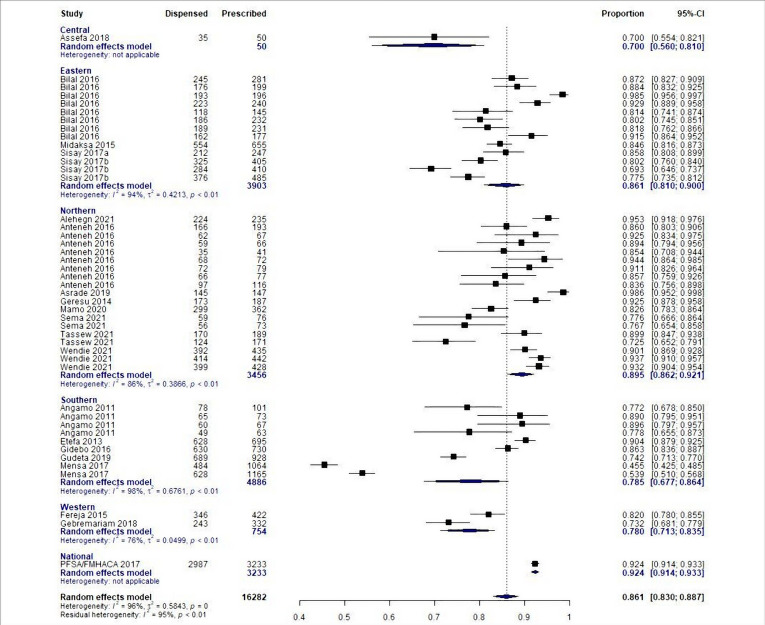
Results: A total of 25 studies conducted in 155 health facilities with 11 703 patient exit interviews were included. The median value of average consultation time was 5.1 min (25th-75th: 4.2-6.6) and that of average dispensing time was 78 s (25th-75th: 54.9-120.0). The median percentage of medicines with adequate labelling was 22.4% (25th-75th: 5.6%-50.0%). A concerning trend of decreasing dispensing times and adequacy of labelling were observed in more recent studies. The median percentage of patients with adequate knowledge of dosage schedules of medicines was 70.0% (25th-75th: 52.5%-81.0%). In the meta-analysis, the pooled estimate of medicine availability was 85.9% (95% CI: 82.1% to 89.0%). The multivariable meta-regression showed that geographical area and quality of study were statistically significant predictors of medicine availability.
Conclusion: Short consultation and dispensing times, inadequate labelling, inadequate knowledge of patients on medicines and suboptimal availability of medicines were identified in health facilities of Ethiopia. Studies aimed at further exploration of the individual indicators like problems of inadequate labelling and patients' knowledge of dispensed medicines are crucial to determine the specific reasons and improve medicine use.
Prospero registration number: CRD42020157274.
Keywords: clinical governance; health policy; health services administration & management; infection control; protocols & guidelines; quality in healthcare.
© Author(s) (or their employer(s)) 2022. Re-use permitted under CC BY-NC. No commercial re-use. See rights and permissions. Published by BMJ.
Conflict of interest statement
Competing interests: None declared.
Figures
Similar articles
-
Assessment of medicines use pattern using World Health Organization's Prescribing, Patient Care and Health facility indicators in selected health facilities in eastern Ethiopia.BMC Health Serv Res. 2016 Apr 23;16:144. doi: 10.1186/s12913-016-1414-6. BMC Health Serv Res. 2016. PMID: 27106610 Free PMC article.
-
Drug use pattern using WHO core drug use indicators in public health centers of Dessie, North-East Ethiopia.BMC Med Inform Decis Mak. 2021 Jun 25;21(1):197. doi: 10.1186/s12911-021-01530-w. BMC Med Inform Decis Mak. 2021. PMID: 34172067 Free PMC article.
-
Assessment of medicine use among outpatients at healthcare facilities in Ethiopia using the WHO's prescribing indicators with a focus on antibiotics: a systematic review and meta-analysis.J Antimicrob Chemother. 2020 Aug 1;75(8):2044-2058. doi: 10.1093/jac/dkaa124. J Antimicrob Chemother. 2020. PMID: 32437516
-
The Pattern of Medicine Use in Ethiopia Using the WHO Core Drug Use Indicators.Biomed Res Int. 2021 Dec 24;2021:7041926. doi: 10.1155/2021/7041926. eCollection 2021. Biomed Res Int. 2021. PMID: 34980999 Free PMC article.
-
A cross sectional comparison of drug use indicators using WHO methodology in primary level hospitals participating in an Auditable Pharmaceutical Transactions and Services program versus non-APTS primary hospitals in Southern Ethiopia.PLoS One. 2019 Oct 7;14(10):e0223523. doi: 10.1371/journal.pone.0223523. eCollection 2019. PLoS One. 2019. PMID: 31589641 Free PMC article.
Cited by
-
Exit knowledge about dispensed medications and associated factors among outpatients served in public hospital pharmacies and private pharmacies in Ethiopia: a systematic review and meta-analysis.BMJ Open. 2025 May 2;15(5):e099347. doi: 10.1136/bmjopen-2025-099347. BMJ Open. 2025. PMID: 40316350 Free PMC article.
-
An analysis of the essential medicines policy in primary care: Findings from MedMinas project.Front Pharmacol. 2022 Oct 17;13:953329. doi: 10.3389/fphar.2022.953329. eCollection 2022. Front Pharmacol. 2022. PMID: 36324686 Free PMC article.
References
-
- World Health Organization . The rational use of drugs : report of the Conference of Experts, Nairobi, 25-29 November 1985. World Health Organization, 1987.
-
- World Health Organization . Promoting rational use of medicines : core components, 2002. Available: https://apps.who.int/iris/handle/10665/67438 [Accessed 8 Aug 2020].
-
- World Health Organization . Action Programme on Essential Drugs and Vaccines. How to investigate drug use in health facilities : selected drug use indicators, 1993. Available: https://apps.who.int/iris/handle/10665/60519
-
- Ntirenganya RP, Nyirazinyoye L, Ntaganira J. Assessment of patient care indicators in three district hospitals in rural Rwanda: a cross-sectional study. IOSR Journal Of Pharmacy 2018;8:36–9.
-
- Britt H, Valenti L, Miller G. Time for care. length of general practice consultations in Australia. Aust Fam Physician 2002;31:876–80. - PubMed
Publication types
MeSH terms
LinkOut - more resources
Full Text Sources