. 2023 Jan 1;30(1):74-86.
doi: 10.5551/jat.60921. Epub 2022 Mar 19.

Acute Cholesterol-Lowering Effect of Exendin-4 in Ldlr-/- and C57BL/6J Mice

Affiliations

Acute Cholesterol-Lowering Effect of Exendin-4 in Ldlr-/- and C57BL/6J Mice

Mika Hori et al. J Atheroscler Thromb. .

Abstract

Aims: We previously reported that glucagon-like peptide-1 receptor agonists (GLP-1RAs) reduced serum low-density lipoprotein cholesterol (LDL-C) levels in patients with type 2 diabetes mellitus receiving statins, which increased LDL receptor (LDLR) expression. Nevertheless, it remains unclear how much LDLR expression contributes to the LDL-C-lowering effect of GLP-1RAs. We examined the effect of a GLP-1RA, namely, exendin-4, on serum LDL-C levels and its mechanism in Ldlr-/- and C57BL/6J mice.

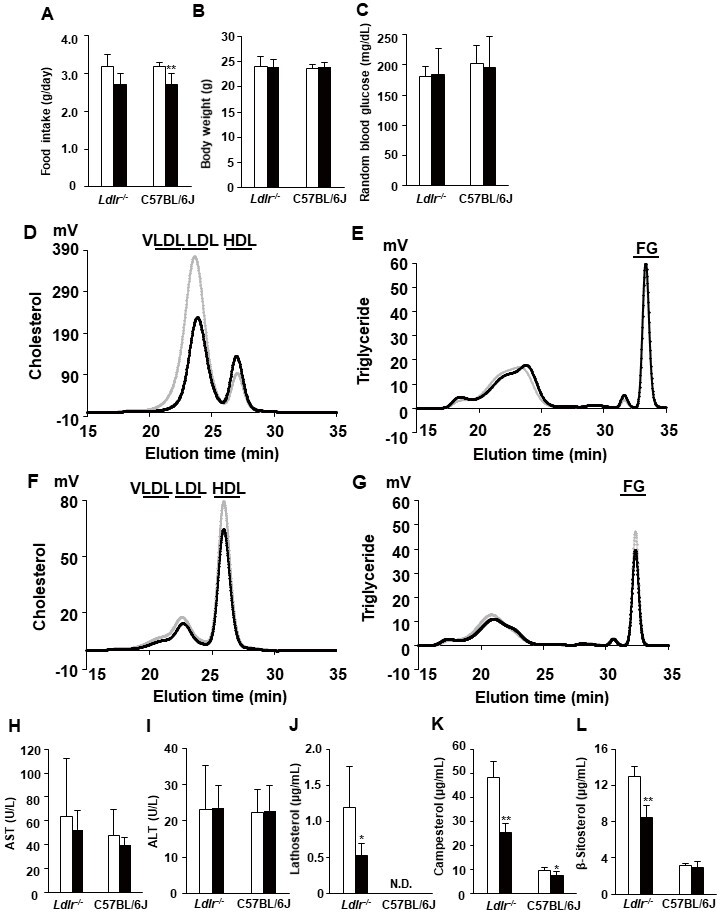
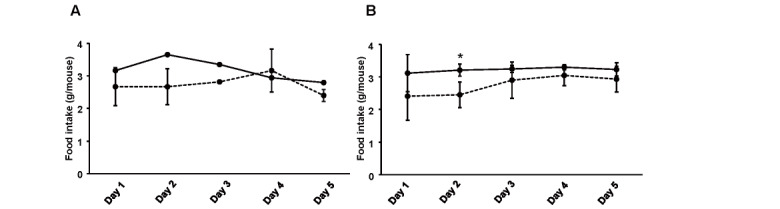
Methods: Ten-week-old Ldlr-/- and C57BL/6J mice received exendin-4 or saline for 5 days, and serum lipid profiles and hepatic lipid levels were examined. Cholesterol metabolism-related gene expression and protein levels in the liver and ileum and the fecal bile acid (BA) composition were also examined.

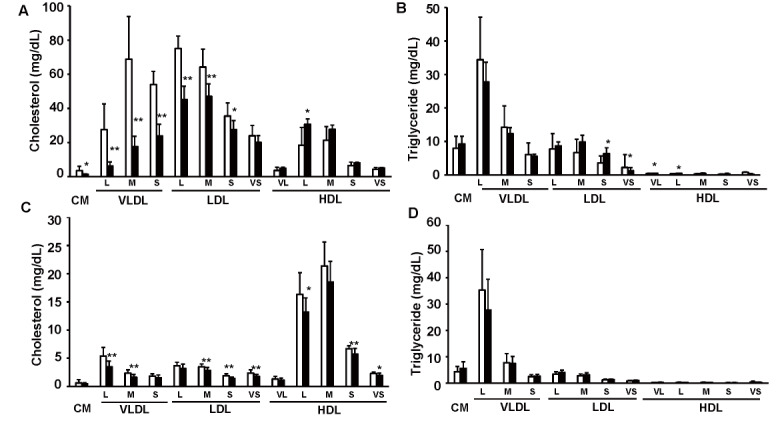
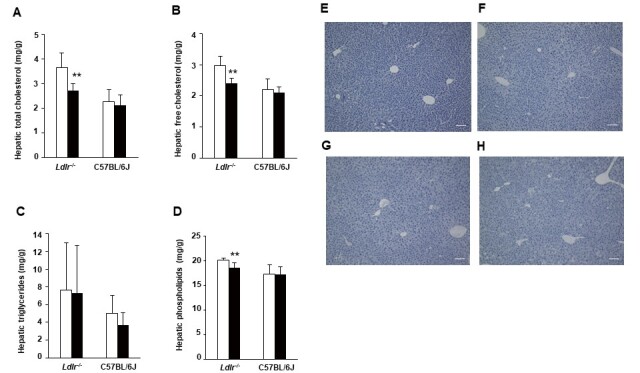
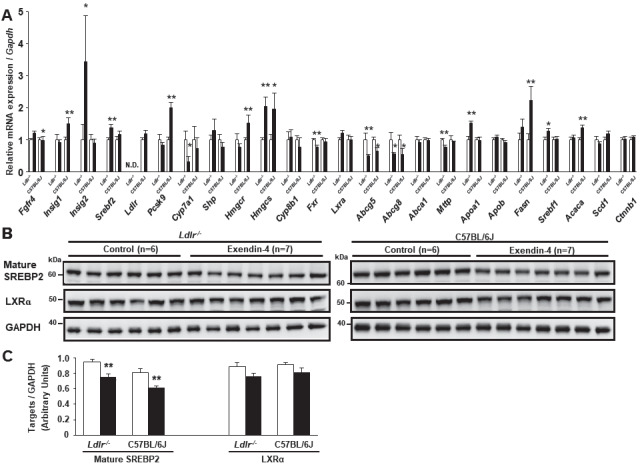
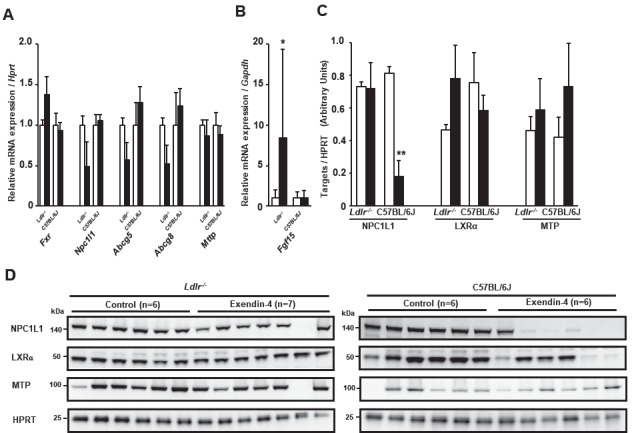
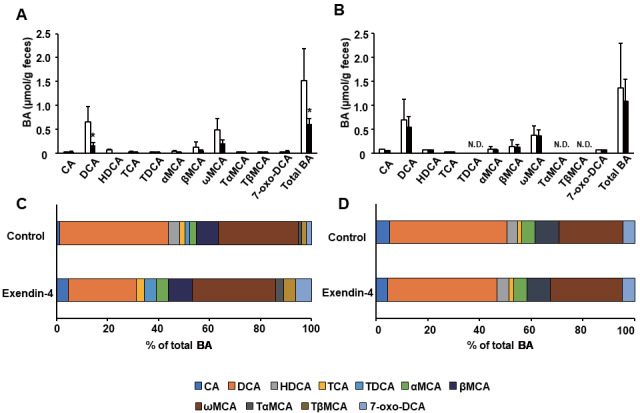
Results: Exendin-4 treatment significantly decreased serum very-low-density lipoprotein cholesterol (VLDL-C) and LDL-C levels and mature hepatic SREBP2 levels and increased hepatic Insig1/2 mRNA expression in both mouse strains. In Ldlr-/- mice, exendin-4 treatment also significantly decreased hepatic cholesterol levels and fecal BA excretion, decreased hepatic Cyp7a1 mRNA expression, and increased small intestinal Fgf15 mRNA expression. In C57BL/6J mice, exendin-4 treatment significantly decreased small intestinal NPC1L1 levels.

Conclusions: Our findings demonstrate that exendin-4 treatment decreased serum VLDL-C and LDL-C levels in a manner that was independent of LDLR. Exendin-4 treatment might decrease serum cholesterol levels by lowering hepatic SREBP2 levels and cholesterol absorption in Ldlr-/- and C57BL/6J mice. Exendin-4 treatment might decrease cholesterol absorption by different mechanisms in Ldlr-/- and C57BL/6J mice.

Keywords: Cholesterol absorption; GLP-1 receptor agonist; LDL-cholesterol; Ldlr-deficient mice; SREBP2; VLDL-cholesterol.


Figures

Fig.1. Characteristics and serum lipid profiles in saline (control)- and exendin-4-treated <i>Ldlr</i><sup>−/−</sup> and C57BL/6J mice
Fig.1. Characteristics and serum lipid profiles in saline (control)- and exendin-4-treated Ldlr−/− and C57BL/6J mice
The average food intake (A) and body weight (B) and random blood glucose levels (C) in exendin-4-treated (n=10 Ldlr−/− mice and n=13 C57BL/6J mice; black columns) and saline-treated (n=11 Ldlr−/− mice and n=13 C57BL/6J mice; white columns) mice. Cholesterol and triglyceride profiles of serum lipoproteins by gel filtration HPLC in exendin-4-treated (n=7; black line) and saline-treated (n=7; gray line) Ldlr−/− mice (D, E) and exendin-4-treated (n=4; black line) and saline-treated (n=4; gray line) C57BL/6J mice (F, G). Serum AST (H) and ALT (I) levels were assessed in exendin-4-treated (n=10 Ldlr−/− mice and n=13 C57BL/6J mice; black columns) and saline-treated (n=9 Ldlr−/− mice and n=13 C57BL/6J mice; white columns) mice. Serum concentrations of lathosterol (J), campesterol (K), and β-sitosterol (L) in exendin-4-treated (n=5; black columns) and saline-treated (n=5; white columns) Ldlr−/− and C57BL/6J mice. The values (D-G) are the means of four or seven animals per group. p<0.05 and **p<0.01 vs. the control group as calculated by unpaired t-test. AST, aspartate aminotransferase; ALT, alanine aminotransferase. VLDL, very-low-density lipoprotein cholesterol; LDL, low-density lipoprotein cholesterol; HDL, high-density lipoprotein cholesterol; FG, free glycerol.
Supplemental Fig.1.
Supplemental Fig.1.
Food intake for 5 days in Ldlr-/- (A) and C57BL/6J (B) mice
Supplemental Fig.2. Cholesterol and triglyceride distributions among serum lipoprotein subclasses in <i>Ldlr</i><sup>-/-</sup> and C57BL/6J mice
Supplemental Fig.2. Cholesterol and triglyceride distributions among serum lipoprotein subclasses in Ldlr-/- and C57BL/6J mice
Cholesterol and triglyceride profiles in serum lipoproteins in exendin-4-treated (n=7; black columns) and saline-treated (n=7; white columns) Ldlr-/- mice (A, B) and exendin-4- treated (n=13; black columns) and saline-treated (n=13; white columns) C57BL/6J mice (C, D). p<0.05 and **p<0.01 vs. the control group as calculated by unpaired t test. These values are the mean±SD. CM: chylomicron; VLDL: very-low-density lipoprotein cholesterol; LDL: low-density lipoprotein cholesterol; HDL: high-density lipoprotein cholesterol. VL: very large; L: large; M: medium; S: small; VS: very small
Fig.2. Hepatic levels of lipids and histological sections in <i>Ldlr</i><sup>−/−</sup> and C57BL/6J mice
Fig.2. Hepatic levels of lipids and histological sections in Ldlr−/− and C57BL/6J mice
Hepatic levels of total cholesterol (A), free cholesterol (B), triglycerides (C), and phospholipids (D) in exendin-4-treated (n=7 Ldlr−/− mice and n=4 C57BL/6J mice; black columns) and saline-treated (n=7 Ldlr−/− mice and n=4 C57BL/6J mice; white columns) mice. Representative sections of mouse livers stained with Oil Red O in control-treated (E) and exendin-4-treated (F) Ldlr−/− mice and saline-treated (G) and exendin-4-treated (H) C57BL/6J mice. The values of hepatic lipids levels are the mean±SD. **p<0.01 vs. the control group as calculated using unpaired t-test.
Fig.3. Levels of hepatic mRNA expression and protein associated with cholesterol synthesis, catabolism, and excretion in <i>Ldlr</i><sup>−/−</sup> and C57BL/6J mice
Fig.3. Levels of hepatic mRNA expression and protein associated with cholesterol synthesis, catabolism, and excretion in Ldlr−/− and C57BL/6J mice
Hepatic mRNA expression in exendin-4-treated (n=11 Ldlr−/− mice and n=8 C57BL/6J mice; black columns) and saline (control)-treated (n=10 Ldlr−/− mice and n=8 C57BL/6J mice; white columns) mice (A). Hepatic expression of Srebf2, Pcsk9, Hmgcs, Lxra, Abcg5, Abcg8, Abca1, Mttp, Apob, Fasn, and Srebf1 was assessed in seven control and seven exendin-4-treated Ldlr−/− mice. Western blots for hepatic mature SREBP2 and LXRα were performed in Ldlr−/− and C57BL/6J mice (B, C). Each protein level was assessed via western blotting normalized to the level of GAPDH in Ldlr−/− and C57BL/6J mice treated with exendin-4 (n=7; black columns) or saline (n=6; white columns). These values are the mean±SE. p<0.05 and **p<0.01 vs. the control group as calculated by unpaired t-test. Similar results were obtained in two or three independent experiments (B, C). N.D., not detected.
Fig.4. Levels of small intestinal mRNA expression and protein associated with cholesterol absorption in <i>Ldlr</i><sup>−/−</sup> and C57BL/6J mice
Fig.4. Levels of small intestinal mRNA expression and protein associated with cholesterol absorption in Ldlr−/− and C57BL/6J mice
Small intestinal mRNA expression in exendin-4-treated (n=11 Ldlr−/− mice and n=8 C57BL/6J mice; black columns) and saline (control)-treated (n=10 in Ldlr−/− mice and n=8 in C57BL/6J mice; white columns) mice (A, B). Western blots for small intestinal NPC1L1, LXRα, and MTP were performed in Ldlr−/− and C57BL/6J mice (C, D). Protein levels of small intestinal NPC1L1, MTP, and LXRα were assessed by western blotting normalized to the level of HPRT in Ldlr−/− and C57BL/6J mice treated with exendin-4 (n=6 or 7; black columns) or saline (n=6; white columns). These values are the mean±SE. Similar results were obtained in two independent experiments (C, D). p<0.05 and **p<0.01 vs. the control group in A and C, as calculated by unpaired t-test, and in B, as calculated by the Wilcoxon rank-sum test.
Fig.5. Bile acid profile of the feces of <i>Ldlr</i><sup>−/−</sup> and C57BL/6J mice treated with saline (control) or exendin-4
Fig.5. Bile acid profile of the feces of Ldlr−/− and C57BL/6J mice treated with saline (control) or exendin-4
The bile acid (BA) composition was determined via LC-Q-TOF/MS. The BA composition in (A) exendin-4-treated (n=4; black columns) and saline-treated (n=4; white columns) Ldlr−/− mice, and (B) exendin-4-treated (n=5; black columns) and saline-treated (n=5; white columns) C57BL/6J mice. Total BA levels were calculated as the sum of the level of each BA. These values are the mean±SD. (A, B) The level of each BA is shown as the percentage of the total BA level (C, D). p<0.05 vs. the control group, as calculated by unpaired t-test. Some BAs were below the detection limit. N.D., not detected.

Similar articles

Cited by

References

    1. MacDonald PE, El-Kholy W, Riedel MJ, Salapatek AM, Light PE and Wheeler MB: The multiple actions of GLP-1 on the process of glucose-stimulated insulin secretion. Diabetes, 2002; 51 Suppl 3: S434-442 - PubMed
    1. Yamato E, Noma Y, Tahara Y, Ikegami H, Yamamoto Y, Cha T, Yoneda H, Ogihara T, Ohboshi C, Hirota M and Shima K: Suppression of synthesis and release of glucagon by glucagon-like peptide-1 (7-36 amide) without affect on mRNA level in isolated rat islets. Biochem Biophys Res Commun, 1990; 167: 431-437 - PubMed
    1. Viswanathan P, Chaudhuri A, Bhatia R, Al-Atrash F, Mohanty P and Dandona P: Exenatide therapy in obese patients with type 2 diabetes mellitus treated with insulin. Endocr Pract, 2007; 13: 444-450 - PubMed
    1. Klonoff DC, Buse JB, Nielsen LL, Guan X, Bowlus CL, Holcombe JH, Wintle ME and Maggs DG: Exenatide effects on diabetes, obesity, cardiovascular risk factors and hepatic biomarkers in patients with type 2 diabetes treated for at least 3 years. Curr Med Res Opin, 2008; 24: 275-286 - PubMed
    1. Horton ES, Silberman C, Davis KL and Berria R: Weight loss, glycemic control, and changes in cardiovascular biomarkers in patients with type 2 diabetes receiving incretin therapies or insulin in a large cohort database. Diabetes Care, 2010; 33: 1759-1765 - PMC - PubMed