. 2022 Mar 4;12(2):132-142.
doi: 10.3390/audiolres12020016.

Is Skull-Vibration-Induced Nystagmus Modified with Aging?

Affiliations

Is Skull-Vibration-Induced Nystagmus Modified with Aging?

Giampiero Neri et al. Audiol Res. .

Abstract

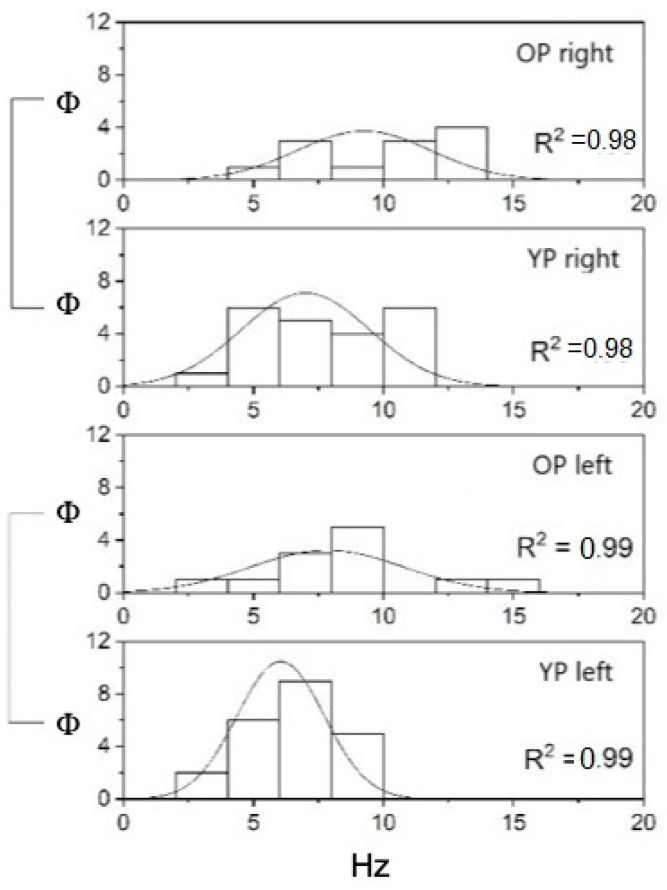
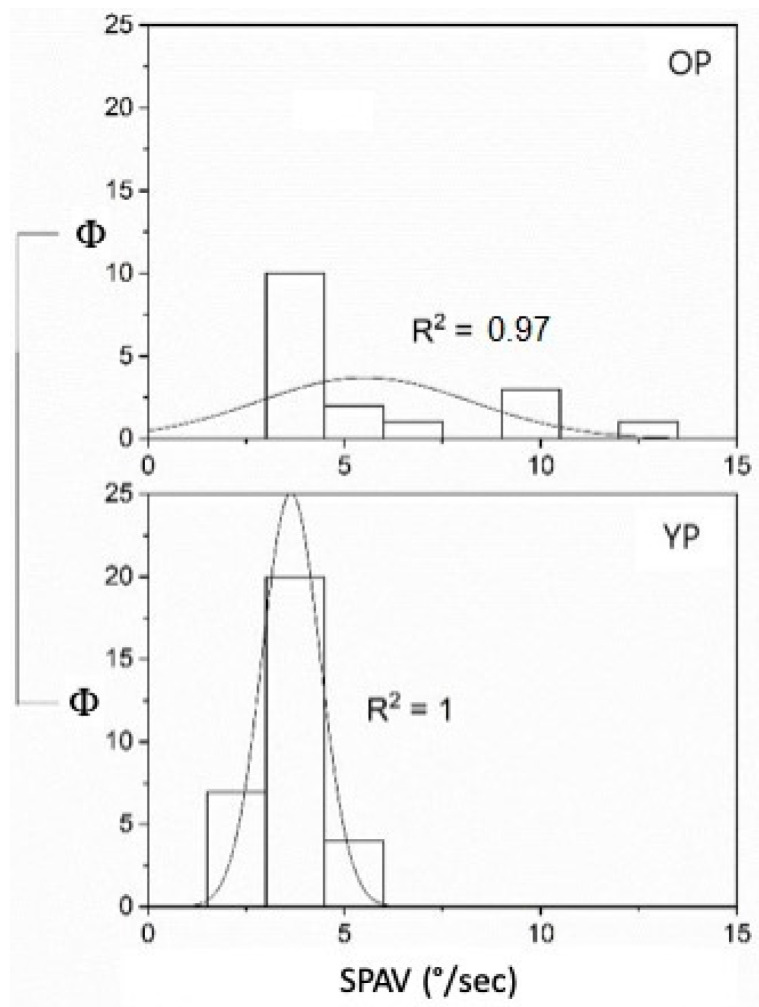
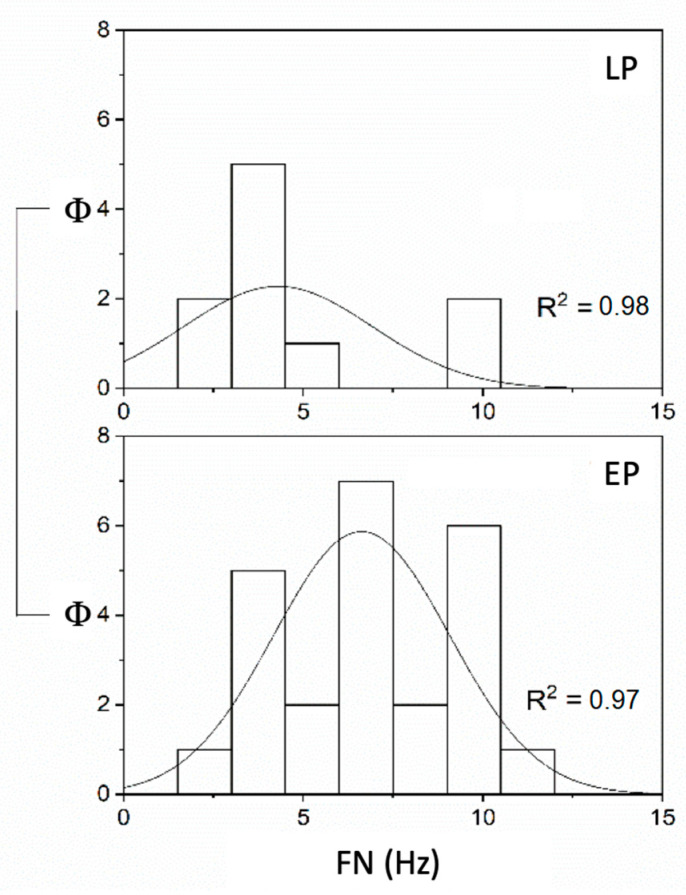
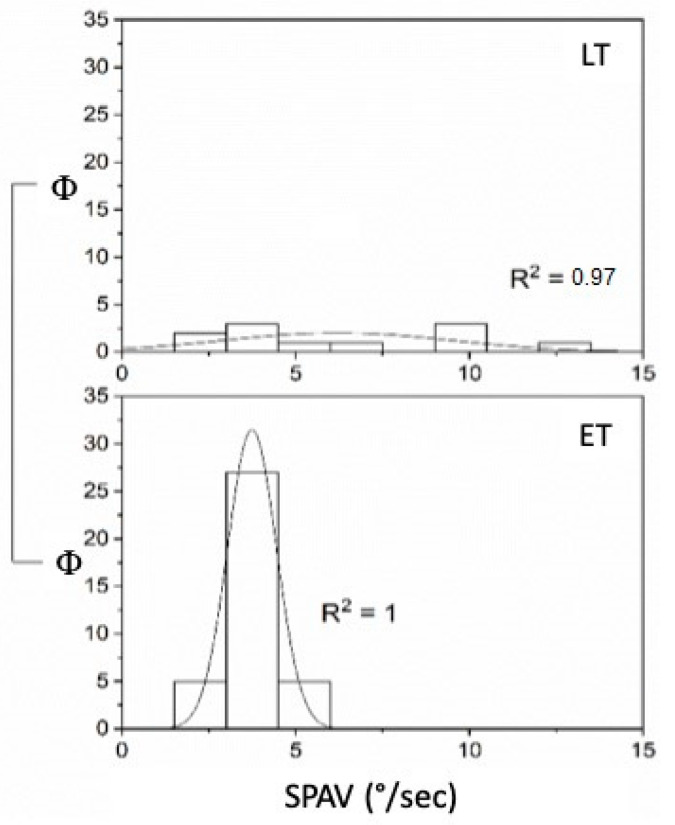
Background: Despite clinical practice utilizing the Dumas test (SVINT), some questions remain unanswered, including the age-related changes in frequency (FN) and slow-phase angular velocity (SPAV). This study aims to retrospectively evaluate their variations in subjects affected by unilateral peripheral vestibular loss (UPVL).

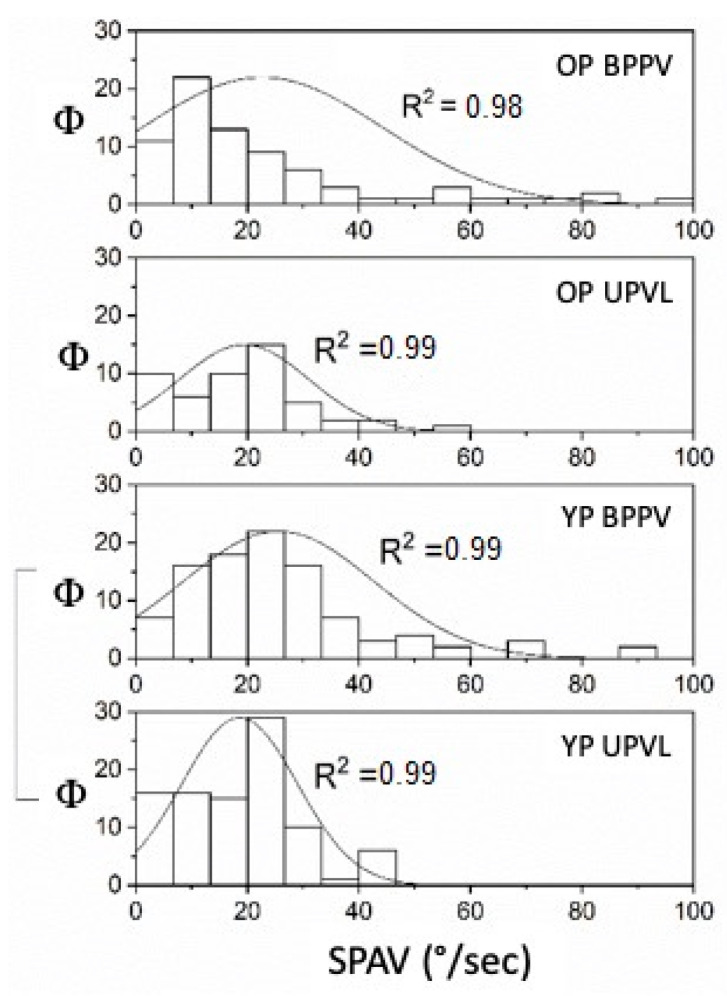
Methods: We evaluated the selected samples based on the results of the SVINT, the results of the vestibular-evoked potentials (C-VEMP and O-VEMP), and the results of the head impulse test (HIT) and we compared the results against the age of the patients. We calculated the timing between the onset of UPVL and clinical evaluation in days. The presence or absence of VEMP indicated the UPVL severity. UPVL and BPPV patients with spontaneous or pseudo-spontaneous nystagmus were compared.

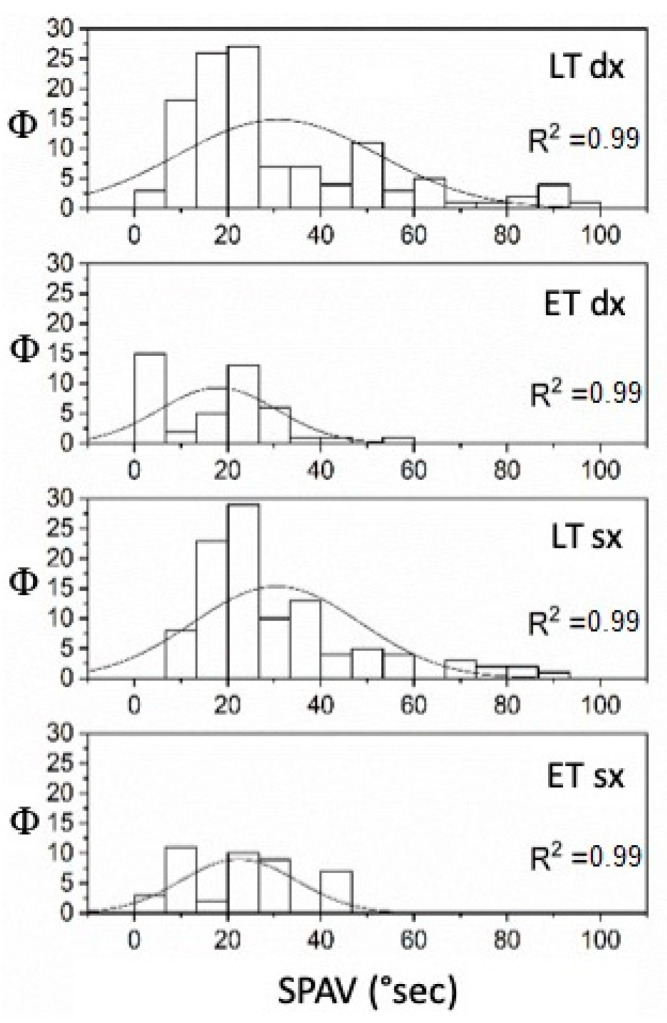
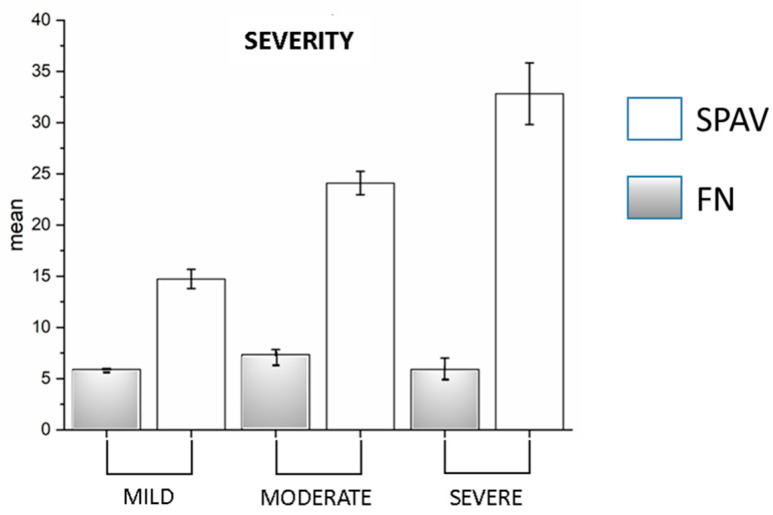
Results: Statistical analysis showed changes in the FN and SPAV depending on age and the side of the application of the stimulus. We also observed that, in the UPVL, the severity of the disease modifies the SPAV, but not the frequency.

Conclusions: The SVINT is a simple, reliable, and straightforward test that, if evaluated instrumentally, can show significant differences with aging. Further studies need to be performed to refine the clinical significance of the test and clarify its physiological background.

Keywords: BPPV; SVINT; aging; slow-phase angular velocity; unilateral vestibular disease; vestibular recruitment.


Conflict of interest statement

The authors declare no conflict of interest.

Figures

Figure 1
Figure 1
FN (Hz) in older and younger patients with SVINT applied on the right and left sides (Φ = data distribution frequency). The Gaussian peak represents the mean of SVIN frequency in Hz. Normal curve vibrational FN distribution and fitting analysis, R2 = 0.99 for both left YP and OP while R2 = 0.98 for right YP and OP (p < 0.001).
Figure 2
Figure 2
SPAV (°/s) in the spontaneous Ny in older and younger patients with UPVL (Φ = data distribution frequency). The Gaussian peak represents the mean of SPAV in °/s. fit R2 = 1 for YP and R2 = 0.97 for OP. Normal curve frequency distribution and fitting analysis R2 = 1 for YP and R2 = 0.97 OP is in (p = 0.001).
Figure 3
Figure 3
FN (Hz) in compensated (LT) and uncompensated (ET) UPVL patients with SVINT applied on the vertex (Φ = data distribution frequency). The Gaussian peak represents the mean of SVIN frequency in Hz. Normal frequency distribution curve and fitting analysis, LT, R2 = 0.98, while R2 = 0.97 for ET (p = 0.001).
Figure 4
Figure 4
SPAV (°/s) of spontaneous Ny in compensated (LT) and uncompensated (ET) UPVL patients (Φ = data distribution frequency). The Gaussian peak represents the mean of SPAV frequency in °/s. Normal curve fit R2 = 0.99 for all (p = 0.001).
Figure 5
Figure 5
SPAV (°/s) of spontaneous Ny in compensated (LT) and uncompensated (ET) UPVL patients (Φ = data distribution frequency). The Gaussian peak represents the mean of SPAV frequency in °/s. Frequency distribution in spontaneous SPAV and normal curve fit R2 = 1 for early time and R2 = 0.97 for late time. Fit R2 = 1 for ET and R2 = 0.97 for LT (p = 0.001).
Figure 6
Figure 6
SPAV (°/s) of SVINT comparisons between UPVL and BPPV in older and younger patients (Φ = data distribution frequency). The Gaussian peak represents the mean of SPAV in Hz. Frequency distribution and fitting analysis in fit R2 = 0.99 for all curves except OP BPPV, that is R2 = 0.98. (p = 0.001).
Figure 7
Figure 7
Superimposed graph of FN and SPAV in the three severity classes: mild, moderate, and severe. On the Y-axis are the averages of both measurements (p = 0.001).

Similar articles

Cited by

References

    1. Waissbluth S., Sepúlveda V. The Skull Vibration-induced Nystagmus Test (SVINT) for Vestibular Disorders: A Systematic Review. Otol. Neurotol. 2021;42:646–658. doi: 10.1097/MAO.0000000000003022. - DOI - PubMed
    1. Dumas G., De Waele C., Hamann K., Cohen B., Negrevergne M., Ulmer E., Schmerber S. Le test vibratoire osseux vestibulaire [Skull vibration induced Nystagmus test] Ann. Otolaryngol. Chir. Cervicofac. 2007;124:173–183. doi: 10.1016/j.aorl.2007.05.001. - DOI - PubMed
    1. Dumas G., Curthoys I.S., Lion A., Perrin P., Schmerber S. The Skull Vibration-Induced Nystagmus Test of Vestibular Function—A Review. Front. Neurol. 2017;8:41. doi: 10.3389/fneur.2017.00041. - DOI - PMC - PubMed
    1. Teggi R., Battista R.A., Di Berardino F., Familiari M., Cangiano I., Gatti O., Bussi M. Evaluation of a large cohort of adult patients with Ménière’s disease: Bedside and clinical history. Acta Otorhinolaryngol. Ital. 2020;40:444–449. doi: 10.14639/0392-100X-N0776. - DOI - PMC - PubMed
    1. Kheradmand A., Zee D. Synthesis and characterization of lignin carbon fiber and composites. Compos. Sci. Technol. 2012;168:710–719. doi: 10.1016/j.compscitech.2016.10.016. - DOI

LinkOut - more resources