. 2022 Mar 21;13(1):1506.
doi: 10.1038/s41467-022-28952-y.

RUFY3 and RUFY4 are ARL8 effectors that promote coupling of endolysosomes to dynein-dynactin

Affiliations

RUFY3 and RUFY4 are ARL8 effectors that promote coupling of endolysosomes to dynein-dynactin

Tal Keren-Kaplan et al. Nat Commun. .

Abstract

The small GTPase ARL8 associates with endolysosomes, leading to the recruitment of several effectors that couple endolysosomes to kinesins for anterograde transport along microtubules, and to tethering factors for eventual fusion with other organelles. Herein we report the identification of the RUN- and FYVE-domain-containing proteins RUFY3 and RUFY4 as ARL8 effectors that promote coupling of endolysosomes to dynein-dynactin for retrograde transport along microtubules. Using various methodologies, we find that RUFY3 and RUFY4 interact with both GTP-bound ARL8 and dynein-dynactin. In addition, we show that RUFY3 and RUFY4 promote concentration of endolysosomes in the juxtanuclear area of non-neuronal cells, and drive redistribution of endolysosomes from the axon to the soma in hippocampal neurons. The function of RUFY3 in retrograde transport contributes to the juxtanuclear redistribution of endolysosomes upon cytosol alkalinization. These studies thus identify RUFY3 and RUFY4 as ARL8-dependent, dynein-dynactin adaptors or regulators, and highlight the role of ARL8 in the control of both anterograde and retrograde endolysosome transport.


Conflict of interest statement

The authors declare no competing interests.

Figures
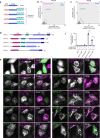
Fig. 1
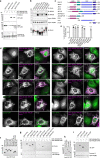
Fig. 1. Identification of RUFY3 and RUFY4 as ARL8 effectors.
a Schematic representation of control and Mito-ARL8 constructs used in MitoID. Mito-ARL8 constructs comprise the mitochondrial targeting sequence (MTS) from TOM20, followed by the BioID2 biotin ligase, and ARL8A and ARL8B lacking the N-terminal α-helix and harboring the activating Q75L or inactivating T34N mutations. Data from 3 biological replicates were used for the assay. b Graph showing the relative abundance of hits identified by mass spectrometry for MTS-BioID2-ARL8A-Q75L/MTS-BioID2 control vs. MTS-BioID2-ARL8A-T34N/MTS-BioID2 control using MitoID. c Same as (b) for MTS-BioID2-ARL8B-Q75L/MTS-BioID2 control vs. MTS-BioID2-ARL8B-T34N/MTS-BioID2 control. Hits of interest in panels (b) and (c) are highlighted. d Domain organization of RUFY proteins in N- to C-terminal direction. RUN: RPIP8, UNC-14 and NESCA domain, CC1: coiled-coil 1 domain, CC2: coiled-coil 2 domain, FYVE: Fab1, YOTB, Vac1 and EEA1 domain. Amino-acid numbers are indicated. RUFY3.1 and RUFY3.2 are two spliceforms of RUFY3. e Immunofluorescence microscopy of HeLa cells co-expressing GFP or RUFY-GFP fusion proteins (green) with MTS-BioID2-ALR8B-Q75L or MTS-BioID2-ALR8B-T34N. Fixed cells were stained with antibody to BioID2 (magenta) and imaged by confocal microscopy. Single channels are shown in grayscale. Scale bars: 10 μm. f Quantification of the percentage of cells in which RUFY proteins were re-localized to mitochondria in experiments such as that in panel (e). Values are the mean ± SD from three independent experiments (minimum of 300 cells per condition). Statistical significance was calculated using one-way ANOVA with multiple comparisons between groups using Tukey’s test. **** p < 0.0001. See also Supplementary Fig. 1 and Supplementary Data 1.
Fig. 2
Fig. 2. Biochemical evidence for binding of RUFY3 and RUFY4 to ARL8, and dissection of RUFY3 domains required for ARL8 binding.
a GST-ARL8B-Q75L and GST-ARL8B-T34N were used to pull down the indicated RUFY-FLAG proteins expressed by transfection in HEK293T cells. FLAG-tagged proteins were identified by immunoblotting (IB) and GST proteins by Ponceau S staining. b Extracts of HEK293T cells transfected with plasmids encoding the indicated FLAG- or FOS (FLAG-one-strep)-tagged proteins were immunoprecipitated (IP) with anti-FLAG, and immunoblotted (IB) for endogenous ARL8A and ARL8B and the FLAG tag. Red asterisks indicate the positions of the different FLAG- or FOS-tagged proteins (expected molecular masses: RUFY1-FLAG, 80.8 kDa; RUFY2-FLAG, 71 kDa; RUFY3.1-FLAG, 71.1 kDa; RUFY3.2-FLAG, 54 kDa; RUFY4-FLAG, 65 kDa; FLAG-HOOK1, 86 kDa; SKIP-FOS, 116 kDa). Data in (a) and (b) are representative of 2 experiments with similar results. c Schematic representation of RUFY3 deletion constructs. Domain organization is as depicted in Fig. 1b. Amino-acid numbers are indicated. Δ stands for deletion. Constructs were tagged with GFP or the FLAG epitope. d Immunofluorescence microscopy of HeLa cells expressing GFP or the RUFY3-GFP deletion constructs shown in panel c (green) together with MTS-BioID2-ALR8B-Q75L. Cells were fixed and stained as described in Fig. 1e. Scale bars: 10 μm. e Quantification of the percentage of cells in which RUFY-GFP proteins were re-localized to mitochondria from experiments such as that shown in panel (d). Values are the mean ± SD from a minimum of three independent experiments, each scoring a minimum of 300 cells per condition. Statistical significance compared to cells expressing GFP was calculated using one-way ANOVA with multiple comparisons with Dunnett’s test. ****p < 0.0001. f, g GST-ARL8B-Q75L and GST-ARL8B-T34N were used to pull down the indicated RUFY3-FLAG deletion constructs expressed by transfection in HEK293T cells. FLAG-tagged proteins (f, g) were detected by immunoblotting (IB) for the FLAG epitope. Input GST-ARL8B-Q75L and GST-ARL8B-T34N were detected by Ponceau-S staining. h, i GST-ARL8B-Q75L and GST-ARL8B-T34N were used to pull down the indicated RUFY3-GFP deletion constructs expressed by transfection in HEK293T cells. GFP-tagged proteins (h, i) were detected by immunoblotting (IB) for GFP. Input GST-ARL8B-Q75L and GST-ARL8B-T34N (i) were detected by Ponceau-S staining. The experiments in (fi) are representative of 2 experiments with similar results. Mr represents molecular mass (kDa).
Fig. 3
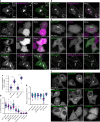
Fig. 3. Role of ARL8 and RUFY3 domains in association of RUFY3/4 with vesicles and juxtanuclear clustering of the vesicles.
a, b Live-cell imaging of HeLa cells co-expressing RUFY3-GFP or RUFY4-GFP (green) with ARL8B-mCherry (magenta). Dashed lines indicate cell edges. Scale bars: 10 μm. The insets are ~3-fold enlargements of the boxed areas. Single channels are shown in grayscale. Images are representative from three independent experiments with similar results. c SuperPlot representation of the Pearson correlation coefficient for the co-localization of GFP (negative control), RUFY3-GFP or RUFY4-GFP with ARL8B-mCherry from experiments such as those in panel (a) and (b). Big circles represent the mean, and small dots the individual data points from each experiment. Experiments are color coded. Horizonal lines indicate the mean ± SD of the means from three independent experiments. Statistical significance was calculated using two-tailed unpaired Student’s t test. **** p < 0.0001. d, e Live-cell imaging of WT or ARL8A-B–KO HeLa cells co-expressing RUFY3-GFP or RUFY4-GFP (green) and mCherry or ARL8B-Q75L-mCherry (magenta). Single channels are shown in grayscale. Scale bars: 10 μm. f Live-cell imaging of HeLa cells expressing RUFY3 deletion mutants (Fig. 2c) tagged with GFP. Images are in grayscale. Scale bars: 10 μm. g Cells with low-to-moderate expression of the RUFY3-GFP constructs in experiments such as that in panel (f) were selected for analysis of membrane recruitment. Total fluorescence intensity per cell was measured, and membrane-associated fluorescence of each construct was estimated by removing diffuse cytoplasmic signal with manual thresholding. Membrane-associated signal, as a percent of total cellular fluorescence, was recorded for 11–15 cells from each construct. Data were represented as SuperPlots as described for panel (c). Horizontal lines indicate the mean ± SD of the means from three independent experiments. Statistical significance was calculated using one-way ANOVA with multiple comparisons to RUFY3-GFP using Dunnett’s test. **p < 0.01, ****p < 0.0001. h SuperPlot representation of the ratio of juxtanuclear GFP to total GFP calculated by shell analysis from experiments such as those in panel (f), represented as described for panel c. Horizontal lines indicate the mean ± SD of the means from three independent experiments. Statistical significance was calculated by one-way ANOVA with multiple comparisons to RUFY3-GFP using Dunnett’s test. **p < 0.01.
Fig. 4
Fig. 4. RUFY3 and RUFY4 localize to endolysosomes, and promote their juxtanuclear clustering.
a Co-localization of RUFY3-GFP and RUFY4-GFP with endogenous LAMP1. Immunofluorescence microscopy of HeLa cells transfected with plasmids expressing GFP (control), RUFY3-GFP or RUFY4-GFP (green), fixed and immunostained for endogenous LAMP1 (magenta). Nuclei were stained with DAPI (blue). Cells with low-to-moderate expression of RUFY3-GFP or RUFY4-GFP were selected for analysis of co-localization. Single channels are shown in grayscale. Cell edges are shown with dashed lines. Scale bars: 10 μm. Insets show 3-fold enlargements of the boxed areas. Arrows indicate vesicles where RUFY3/4-GFP proteins co-localize with LAMP1. b SuperPlot representation of the Pearson’s correlation coefficient for the co-localization of GFP, RUFY3-GFP or RUFY4-GFP with endogenous LAMP1 from experiments such as that shown in panel (a). Values were calculated and represented as described for Fig. 3c. Horizontal lines indicate the mean ± SD of the means from three independent experiments. Statistical significance was calculated using one-way ANOVA with multiple comparisons to the GFP control using Dunnett’s test. ***p < 0.001, ****p < 0.0001. c Overexpression of RUFY3-GFP or RUFY4-GFP causes juxtanuclear clustering of endolysosomes. This experiment was done as described for panel (a), except that highly overexpressing cells were chosen for analysis. Endogenous LAMP1 staining is shown in grayscale and GFP images in green (inset). The strong cytosolic staining of the GFP constructs is due to the overexpression. Nuclei were stained with DAPI (blue). Cell edges are highlighted with dashed lines. Scale bars: 10 μm. Insets show 2.85-fold reductions of the transfected cells. d SuperPlot representation of the ratio of juxtanuclear LAMP1 to total LAMP1 calculated by shell analysis from experiments such as those in panel (c). Values were calculated and represented as described for Fig. 3c, h. Horizontal lines indicate the mean ± SD of the means from three independent experiments. Statistical significance was calculated using one-way ANOVA with multiple comparison to the GFP control using Dunnett’s test. *p < 0.05, ***p < 0.001.
Fig. 5
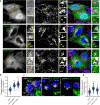
Fig. 5. Effects of overexpressing RUFY3 deletion constructs or knocking down RUFY3 on the distribution of endolysosomes.
a Immunofluorescence microscopy of HeLa cells transfected with plasmids encoding GFP (control) or RUFY3-GFP deletion constructs depicted in Fig. 2c (green in the insets), fixed and immunostained for endogenous LAMP1 (grayscale). Nuclei were stained with DAPI (blue). Highly overexpressing cells were chosen for analysis, thus the strong cytosolic fluorescence of the constructs in the insets. Cell edges are highlighted with dashed lines. Scale bars: 10 μm. Insets show 2.85-fold reductions of the transfected cells. b SuperPlot representation as described for Fig. 3c, h of the effect of RUFY3-GFP deletion constructs on the distribution of LAMP1 from experiments such as that shown in panel (a). Horizontal lines represent the mean ± SD of the means from three independent experiments. Statistical significance was calculated using one-way ANOVA with multiple comparisons to GFP using Dunnett’s test. * p < 0.05, ** p < 0.01, *** p < 0.001. c qRT-PCR of RUFY3 and RUFY4 mRNA relative to actin mRNA in HeLa cells treated with non-targeting (NT) or RUFY3/4 SMARTpool siRNAs. n.d., not detected. d Immunofluorescence microscopy of HeLa cells treated with non-targeting (NT) or RUFY3 SMARTpool siRNA and stained with antibodies to endogenous LAMP1 (grayscale and magenta) and Alexa fluor 546-conjugated phalloidin (green) to highlight cell edges. Nuclei were stained with DAPI (blue). Cell edges in grayscale images are highlighted with dashed lines. Yellow arrows indicate accumulation of endolysosomes at cell vertices. Scale bars: 10 μm. e, f SuperPlot representation as described for Fig. 3c, h of the effect of RUFY3 KD on the juxtanuclear (e) and peripheral (f) distribution of LAMP1 from experiments such as that shown in panel (d). Horizontal lines indicate the mean ± SD of the means from three independent experiments. Statistical significance was calculated using the two-tailed unpaired Student’s t test. *p < 0.05. See also Supplementary Fig. 3.
Fig. 6
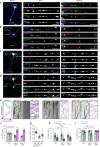
Fig. 6. RUFY3 and RUFY4 shift axonal endolysosome movement to the retrograde direction.
a, b Immunofluorescence microscopy of neurons transfected with plasmids encoding RUFY3-FLAG (a) or RUFY4-FLAG (b) and ARL8B-mCherry. Neurons were fixed, permeabilized, and RUFY-FLAG proteins detected by immunostaining with antibody to the FLAG epitope (blue), endolysosomes with antibody to endogenous LAMTOR4 (green), and ARL8B-mCherry by its intrinsic fluorescence (magenta). Images on the left show neurons (scale bars: 10 μm) with boxes indicating axons and dendrites that are enlarged on the right (scale bars: 5 μm). Images are representative from three independent experiments with similar results. c, d Same as panels (a) and (b), but neurons were co-transfected with a plasmid encoding LAMP1-GFP (green) instead of immunostained for LAMTOR4. Images are representative from three independent experiments with similar results. e Neurons were transfected with plasmids encoding LAMP1-RFP (magenta) along with GFP, RUFY3-GFP, or RUFY4-GFP (green), axons were imaged live, and trajectories of fluorescent particles were represented as kymographs. Single channels are represented in grayscale. Lines with negative or positive slopes in the kymographs correspond to vesicles moving in anterograde or retrograde directions, respectively. f Quantification of the percentage of anterograde (green) and retrograde (magenta) movement of LAMP1-RFP vesicles from experiments such as that in panel (e). Values are the mean ± SD from three independent experiments, with a total of 15 neurons and 445 (GFP), 206 (RUFY3-GFP), and 282 (RUFY4-GFP) LAMP1-RFP motile events analyzed per condition. Statistical significance was calculated using one-way ANOVA with multiple comparisons using Tukey’s test. ****p < 0.0001; n.s., not significant. g SuperPlot representation of the total number of LAMP1-RFP tracks from experiments such as that in panel (e). Horizontal lines indicate the mean ± SD of the means from three independent experiments. Statistical significance was calculated using one-way ANOVA with multiple comparisons to the GFP control using Dunnett’s test. **p < 0.01, ***p < 0.001. h, i SuperPlot representation of velocity and run length of LAMP1-RFP tracks in neurons from experiments such as in panel (e). The mean ± SD of the means from three independent experiments are indicated. Statistical significance was calculated using one-way ANOVA with multiple comparisons using Tukey’s test. *p < 0.05; n.s., not significant. See also Supplementary Movie 1.
Fig. 7
Fig. 7. Interaction of RUFY3 and RUFY4 with dynein-dynactin.
a HEK293T cells were transfected with plasmids encoding GFP (negative control), GFP-BICD2 (positive control), RUFY3-GFP or RUFY4-GFP. Cell extracts were analyzed by immunoprecipitation (IP) with antibody to GFP, followed by immunoblotting (IB) for endogenous dynein intermediate chain (DIC) and endogenous p150Glued subunit of dynactin. Ponceau S staining shows the levels of immunoprecipitated GFP-tagged proteins. The experiment shown in this panel is one of two with similar results. b Extracts of HEK293T cells were incubated with recombinant 6His-StrepII-sfGFP (abbreviated 6His-GFP in the figure) (negative control), His6-StrepII-sfGFP-BICD225-400 (His6-GFP-BICD225-400) (positive control) or 6His-StrepII-sfGFP-RUFY3 (6His-GFP-RUFY3), pulled down (PD) with Strep-Tactin agarose, and immunoblotted for endogenous dynein intermediate chain (DIC), the endogenous p150Glued of dynactin, or GFP. The GFP used to make these constructs is a variant named sfGFP, for super-folder GFP. The experiment shown in this panel is one of two with similar results. c Glutathione-Sepharose preloaded with purified, recombinant GST (negative control), GST-DLIC1 or GST-DLIC1-CT (C-terminal domain) was incubated with purified, recombinant 6His-StrepII-sfGFP-RUFY3 (6His-GFP-RUFY3). Bound proteins were detected by immunoblotting with antibodies to GFP and GST. The positions of molecular mass markers (in kDa) in panels a-c are indicated at left. d Live-cell images of HeLa cells co-expressing RUFY3-mCherry or RUFY4-mCherry (magenta) without or with GFP-p150Glued-CC1 (green). Single-channel images are shown in grayscale. Scale bars: 10 μm. Arrows point to RUFY proteins at cell tips. This experiment is one of two with similar results.
Fig. 8
Fig. 8. Targeting of RUFY3 and RUFY4 to peroxisomes causes dynein-dependent re-localization of peroxisomes to the juxtanuclear area.
a Schematic representation of constructs used in the peroxisome re-localization assay. PEX31-42: peroxisomal-targeting signal from PEX3; FKBP: FK506-binding protein; FRB: FKBP rapamycin binding. Constructs are represented in N- to C-terminal direction. BICD225-400 was used as a positive control for a known dynein-dynactin adaptor domain. FKBP binds to FRB upon addition of rapalog. b Schematic representation of the rapalog-induced juxtanuclear re-localization of peroxisomes labeled by PEX31-42-FKBP-RFP (magenta) by a hypothetical dynein-dynactin adaptor fused to FRB and GFP (green). c, d Fluorescence microscopy of HeLa cells treated with non-targeting (NT) siRNA (c) or dynein heavy chain (DHC) siRNA (d), co-transfected with plasmids encoding the indicated proteins, and incubated for 1 h without (-) or with (+) 0.5 μM rapalog. Nuclei were stained with DAPI. Scale bars: 10 μm. This experiment is representative of 3 experiments with similar results. e Graph showing the fractional peroxisome distribution in the experiments shown in panels c, d. A minimum of 200 cells from two to three independent experiments were visually scored for the distribution of peroxisomes (fraction of cells with juxtanuclear, partially juxtanuclear, and dispersed peroxisomes).
Fig. 9
Fig. 9. Requirement of RUFY3 for juxtanuclear clustering of endolysosomes upon cytoplasmic alkalinization, and schematic representation of the roles of ARL8 in retrograde and anterograde endolysosome transport.
a, b HeLa cells were treated with non-targeting (a) or RUFY3 siRNA (b) for 96 h, and left untreated (control) or incubated for 1 h at 37 °C in regular culture medium adjusted to pH 8.5. Cells were then fixed, permeabilized and immunostained with antibody to endogenous LAMP1 (grayscale and magenta) and Alexa Fluor 546-conjugated phalloidin (green). Nuclei were stained with DAPI (blue). Arrows point to accumulation of endolysosomes at cell tips caused by RUFY3 depletion. Scale bars: 10 μm. c Quantification of the ratio of juxtanuclear LAMP1 to total LAMP1 by shell analysis. The graph shows the individual data points and the mean ± SD from one experiment (panels (a) and (b)). Data were normalized to untreated cells in regular culture medium. Statistical significance was calculated by two-way ANOVA with multiple comparison between groups using Tukey’s test. ****p < 0.0001. d Schematic representation of the role of ARL8 in regulating both retrograde and anterograde of endolysosomes through interactions with different effectors. BORC promotes recruitment of ARL8 to endolysosomes. In turn, ARL8 recruits RUFY3 or RUFY4, which promotes coupling to dynein-dynactin. Interaction of ARL8 with RUFY3 is mediated by the CC2 domain. The domain of RUFY4 that interacts with ARL8 was not identified. These interactions drive transport of endolysosomes from the plus to the minus end of microtubules (i.e., retrograde transport) (this study). Additional RUFY3 or RUFY4 interactors not represented here may also participate in this coupling. Alternatively, ARL8 recruits kinesin-1 (KIF52-KLC2) via SKIP, or kinesin-3 (KIF1) directly, driving endolysosome transport from the minus to the plus end of microtubules (i.e., anterograde transport),,,.

Similar articles

Cited by

References

    1. Sztul E, et al. ARF GTPases and their GEFs and GAPs: concepts and challenges. Mol. Biol. Cell. 2019;30:1249–1271. - PMC - PubMed
    1. Khatter D, Sindhwani A, Sharma M. Arf-like GTPase Arl8: Moving from the periphery to the center of lysosomal biology. Cell Logist. 2015;5:e1086501. - PMC - PubMed
    1. Bagshaw RD, Callahan JW, Mahuran DJ. The Arf-family protein, Arl8b, is involved in the spatial distribution of lysosomes. Biochem. Biophys. Res. Commun. 2006;344:1186–1191. - PubMed
    1. Hofmann I, Munro S. An N-terminally acetylated Arf-like GTPase is localised to lysosomes and affects their motility. J. Cell Sci. 2006;119:1494–1503. - PubMed
    1. Antonny B, Beraud-Dufour S, Chardin P, Chabre M. N-terminal hydrophobic residues of the G-protein ADP-ribosylation factor-1 insert into membrane phospholipids upon GDP to GTP exchange. Biochemistry. 1997;36:4675–4684. - PubMed

Publication types