. 2022 Mar 21;13(1):1511.
doi: 10.1038/s41467-022-29137-3.

Fatty acid oxidation fuels glioblastoma radioresistance with CD47-mediated immune evasion

Affiliations

Fatty acid oxidation fuels glioblastoma radioresistance with CD47-mediated immune evasion

Nian Jiang et al. Nat Commun. .

Abstract

Glioblastoma multiforme (GBM) remains the top challenge to radiotherapy with only 25% one-year survival after diagnosis. Here, we reveal that co-enhancement of mitochondrial fatty acid oxidation (FAO) enzymes (CPT1A, CPT2 and ACAD9) and immune checkpoint CD47 is dominant in recurrent GBM patients with poor prognosis. A glycolysis-to-FAO metabolic rewiring is associated with CD47 anti-phagocytosis in radioresistant GBM cells and regrown GBM after radiation in syngeneic mice. Inhibition of FAO by CPT1 inhibitor etomoxir or CRISPR-generated CPT1A-/-, CPT2-/-, ACAD9-/- cells demonstrate that FAO-derived acetyl-CoA upregulates CD47 transcription via NF-κB/RelA acetylation. Blocking FAO impairs tumor growth and reduces CD47 anti-phagocytosis. Etomoxir combined with anti-CD47 antibody synergizes radiation control of regrown tumors with boosted macrophage phagocytosis. These results demonstrate that enhanced fat acid metabolism promotes aggressive growth of GBM with CD47-mediated immune evasion. The FAO-CD47 axis may be targeted to improve GBM control by eliminating the radioresistant phagocytosis-proofing tumor cells in GBM radioimmunotherapy.


Conflict of interest statement

The authors declare no competing interests.

Figures
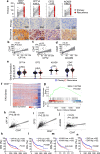
Fig. 1
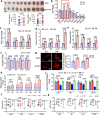
Fig. 1. Co-enhancement of FAO enzymes and CD47 links to the recurrent GBM patients and poor prognosis.
a Scored expression of mitochondrial FAO enzymes (CPT1A, CPT2, ACAD9) and CD47 in a group of 46 recurrent high-grade gliomas (HGG) paired with their primary tumor biopsies (n = 46; paired two-tailed t-test). Representative IHC panels shown with scored FAO enzymes and CD47; scale bar = 100 µm). Pearson correlation coefficient analysis of CD47 expression levels with CPT1A (b), CPT2 (c), and ACAD9 (d) in the paired HGG tumors shown in a. Pearson correlation analysis was applied. Pearson correlation coefficient (r) and P values from Pearson correlation tests were shown. e Expression of CPT1A, CPT2, ACAD9, and CD47 in primary versus recurrent tumors from the CGGA database (n = 504; 504 HGG containing 220 recurrent and 284 primary GBM; the recurrent tumors were not individually matched with primary tumors). The box represents the 25th and 75th percentile, lines show medians, and error bars depict 1.5X IQR. An unpaired two-tailed t-test was applied. f Hierarchical clustering of RNA-seq of CD47 with FAO genes in a group of 504 GBM patients from the CGGA database. g Gene set enrichment analysis for a cluster of 157 FAO-related genes in CD47 high or low expressing tumors with green curve indicating a coordinative enrichment score and normalized enrichment score (NES) generated with GSEA software (NES = 1.337798 and P = 0.002). Pearson correlation coefficient analysis of CD47 expression levels with CPT1A (h), CPT2 (i), and ACAD9 (j) in HGG tumors from the CGGA database. Pearson correlation analysis was applied. Pearson correlation coefficient (r) and P values from Pearson correlation tests were shown. Kaplan–Meier overall survival (OS) of patients CGGA database categorized by high (red, n = 252) or low (blue, n = 252) expression of CPT1A (k, P = 0.03), CPT2 (l, P = 8.7E-7), ACAD9 (m, P = 0.2142), and CD47 (n, P = 6.09E-6). Kaplan–Meier survival analysis was applied. Results represent means ± SD. Source data are provided as a Source Data file.
Fig. 2
Fig. 2. Enhanced FAO drives the aggressive growth of radioresistant GBM cells.
a RR Gl261 cells (5 × 106) were inoculated subcutaneously into both flanks of mice and when the tumor reached the sizes 200 mm3, palmitate (100 μl of 25 μM or 0.05% BSA as solvent control) were administrated twice 72 h apart via intratumoral injection. Tumor volumes (P = 0.0077) and weights (P = 0.0104) were measured at the end of experiment (Day 18; n = 10). A paired two-tailed t-test was applied. b ATP luminesce concentration of WT and RR GL261 cells treated by an indicated concentration of palmitate. n = 3. An unpaired two-tailed t-test was applied. c FAO activity quantified by the conversion of 3H palmitic acid to 3H2O over 6 h using radioactive isotope tracers ([9,10-3H(N)]-palmitic acid [0.5 µCi (~9.3 pmol)]) (n = 3 per cell line) in parental WT and RR GBM cells (U251, U87, A172, and GL261). An unpaired two-tailed t-test was applied. The concentration of acetyl-CoA (d), glucose uptake (e), and l-lactate (f) was measured in WT and RR GBM cells (U251, U87, A172, and GL261; n = 3 per cell line). g Mitochondria number counts in parental WT and RR GBM cells (U251 and GL261; n = 6 per cell line; scale bar = 10 µm). h The basal and spared oxygen consumption rate (OCR) generated with FCCP, a potent uncoupler of mitochondrial oxidative phosphorylation in WT and RR U251 (P = 0.0016), U87 (P = 0.0004), A172 (P = 1.74E-5), and GL261 cells (P = 1.48E-7) (n = 9). An unpaired two-tailed t-test was applied in bh. Lipid accumulation (i), OCR (j), and ATP generation (k) in WT and RR GBM cells treated with or without CPT1 inhibitor ET (in i and k, ET = 200 µM, 24 h, n = 4; in j, ET = 40 µM, 0.5 h, n = 9). Results represent the means ± SD; ANOVA two-way test was applied; WT wildtype, RR radioresistant, ET etomoxir. Source data are provided as a Source Data file.
Fig. 3
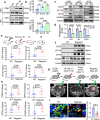
Fig. 3. Activation of FAO and CD47 with anti-phagocytosis in RR GBM cells and regrown tumors.
a Western blot of CD47 expression in WT, irradiated (5 Gy, 16 h) WT and RR GBM cells. (n  =  3 experiments). b Increased CD47-expressing cell populations in a measured by flow cytometry (n = 3; ANOVA one-way test). c Western blot of CD47, CPT1A, CPT2, and ACAD9 in WT and RR GBM cells (U251, U87, and A172) (n = 3). d Macrophage phagocytosis of WT and RR GBM cells (U251, U87, and GL261) detected by flow cytometry (n = 3; unpaired two-tailed t-test). e Schematic for generating U251 xenograft tumors in nude mice with tumor radiation and IHC scoring for detecting the expression of CD47 (P = 0.02), CPT1A (P = 0.002), CPT2 (P = 0.006), and ACAD9 (P = 0.04) in untreated or regrown human GBM U251 tumors (n = 4; unpaired two-tailed t-test; *P < 0.05, **P < 0.01). f Enhanced expression of CD47 and CPT1A, CPT2, ACAD9 in three regrown U251 tumors after in vivo radiotherapy compared to three sham-irradiated control U251 tumors (n = 3 experiments). g Treatment protocol (upper panel) and MRI images (lower panel) of syngeneic mouse orthotopic GL261 tumors generated with inoculation of 2.5 × 105 GL261 cells double-labeled with Luc and GFP with in vivo radiotherapy of 3 Gy delivered daily for 3 days (total tumor radiation dose = 9 Gy). Representative images of regrown tumors at indicated time points were visualized by MRI. h IHC score of CD47 (P = 0.044) and CPT1A (P = 0.041), CPT2 (P = 0.039), and ACAD9 (P = 0.019) in regrown tumors (Day 28) compared to sham-irradiated controls (n = 5). An unpaired two-tailed t-test was applied. *P < 0.05. i Reduction of infiltrated macrophages and macrophage-mediated phagocytosis (indicated by arrows) in regrown tumors compared to WT tumors (green, tumor cells; red, infiltrated macrophages; quantitation of phagocytosis shown in the right; n = 5,). Significance was analyzed by a two-tailed t-test. Results represent means ± SD. Source data are provided as a Source Data file.
Fig. 4
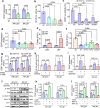
Fig. 4. FAO regulates CD47 transcription via citrate/acetyl-CoA mediated RelA acetylation.
a CD47 mRNA levels in RR U251 (n = 5, P = 0.0039) and RR U87 (n = 8, P = 2.2E-5) cells treated with CPT1A inhibitor etomoxir (ET; 200 µM, 24 h). An unpaired two-tailed t-test was applied. NF-κB reporter b or CD47 promoter activity c in RR U251 cells compared to CPT1A−/−, CPT2−/−, and ACAD9/ RR U251 cells (in c, CD47 promoter with NF-κB motif deleted as the negative control (n = 3). ANOVA one-way test was applied in b and ANOVA two-way test was applied in c. d CD47 mRNA levels in CPT1A−/−, CPT2−/, and ACAD9−/− RR U251 cells. n = 9. ANOVA one-way test was applied. e Citrate concentrations measured in WT and RR GBM (U251 and U87) cells (n = 3). An unpaired two-tailed t-test was applied. f Citrate concentrations measured in CPT1A−/, CPT2−/−, and ACAD9/ or ET-treated RR U251 cells (n = 3). ANOVA one-way test was applied. g CD47 promoter-controlled luciferase activity with or without NF-κB motif deletion measured in RR U251 and RR U87 cells treated with citrate (1 mM, 6 h) (n = 3). ANOVA two-way test was applied. h NF-κB luciferase activity in RR U251 and RR U87 cells treated with citrate (1 mM, 6 h) in the presence or absence of ACLY inhibitor SB204990 (25 µM, 24 h) (n = 3). ANOVA one-way test was applied. i CD47 mRNA level in RR U251 (n = 4) and U87 (n = 10) cells treated with citrate (1 mM, 6 h) combined with or without ACLY inhibitor SB204990 (25 µM, 24 h). j Western blot of RelA K310 acetylation, Histone 3 acetylation in RR U251 and RR U87 cells treated with citrate (1 mM, 6 h) with or without SB204990 (25 µM, 24 h) (n = 3 experiments). k CD47 promoter-controlled luciferase activity either treated with A-485 (20 μM, 24 h) or with or without RelA mut measured in RR U251 and RR U87 cells. l CD47 mRNA level in RR U251 and U87 cells treated with A-485 (20 μM, 24 h) or transfected with WT or mutant RelA. In k and l, n = 3, ANOVA one-way test was applied. Results represent means ± SD. Source data are provided as a Source Data file.
Fig. 5
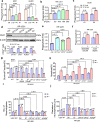
Fig. 5. FAO deficiency boosts macrophage phagocytosis with diminished aggressive growth.
a Macrophage phagocytosis of WT U251 and GL261 cells treated with l-carnitine (l-car, 10 mM, 48 h), palmitate (PA, 25 μM, 48 h) or IR (3 Gy, 16 h). b Enhanced macrophage phagocytosis on RR U251 cells treated with indicated ET concentrations (24 h). In a and b, ANOVA one-way test was applied. c Macrophage phagocytosis of WT and RR GL261 cells treated with ET (80 μM, 24 h). d Upper panel: Western blot of CD47 in ET-treated (200 µM, 48 h) WT U251 cells compared to CPT1A−/−, CPT2−/, and ACAD9−/− RR U251 cells. Lower panel: Percentage of CD47-expressing cells by flow cytometry in CPT1A−/, CPT2−/, and ACAD9/− or ET-treated RR U251 cells (200 µM, 48 h). Analysis was conducted by two-tailed t-test in c and d. e Macrophage (THP1) phagocytosis of control and CPT1A−/−, CPT2−/−, ACAD9−/− RR U251 cells detected by flow cytometry. ANOVA one-way test was applied. f Macrophage (THP1) phagocytosis of RR U251 cells treated with ACLY inhibitor SB204990 (25 µM, 24 h) and A-485 (20 µM, 24 h) detected by flow cytometry. Clonogenic survival (g), apoptosis (h), neurosphere number (i), and neurosphere sizes (j) of WT and CPT1A−/−, CPT2−/−, and ACAD9−/− RR U251 cells or ET (200 μM, 48 h) treated RR U251 cells combined with or without IR (5 Gy) treatment. n = 3; Results represent means ± SD; Significance was analyzed with a two-tailed t-test in gj. Source data are provided as a Source Data file.
Fig. 6
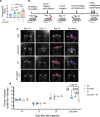
Fig. 6. Radiation with blocking FAO and CD47 diminishes tumor regrowth.
a In vitro macrophage phagocytosis of RR U251 cells treated by ET (400 µM, 12 h), anti-CD47 antibody (10 μg/ml, 2 h), or ET followed by an anti-CD47 antibody; results were normalized with the cells treated with IgG (n = 5, ANOVA two-way test). b Schematic diagram of GL261 orthotopic tumors treated with fractionated irradiation (3 Gy × 3) followed by treatment with FAO inhibitor ET, rat anti-mouse CD47 antibody or combined of two by administration via i.p. Normal rat IgG (Cat. BE0094, BioXcell) used as non-reactive control (16 mg/kg; n = 5), and anti-CD47 antibody (16 mg/kg; n = 5), ET (30 mg/kg; n = 5), or combination of anti-CD47 antibody (16 mg/kg) and ET (30 mg/kg) (n = 7) were administrated every other day for seven treatments in 14 days. The tumor volume of each animal was monitored by luminescence flux values of IVIS (c, d) and tests were terminated based on the appearance of standard symptoms for termination. In d, n = 7 biologically independent animals in a combination of anti-CD47 antibody and ET group and n = 5 biologically independent animals in each of other groups. Significance was analyzed with ANOVA one-way test. Results represent means ± SD. Source data are provided as a Source Data file.
Fig. 7
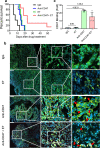
Fig. 7. Animal survival and anti-CD47 antibody tumor penetration in combined treatment.
a Kaplan–Meier survival of mice of Fig. 6b. b Representative immunofluorescence images of infiltrated anti-CD47 antibody in GFP- labeled GL261 orthotopic tumors. Antibody tumor penetration and binding to the targeted receptor were identified by rabbit anti-rat IgG as primary antibody and Rhodamine Red-X-Conjugated goat anti-rabbit as the secondary antibody. The mouse anti-GFP antibody and Alexa 488 conjugated goat anti-mouse secondary antibody recognized GFP expressing GL261 tumor cells. The binding of the anti-CD47 antibody on tumor cells is indicated with red arrows (green, tumor cells; yellow, rabbit anti-rat CD47 antibody bind to CD47 presenting tumor cells; blue, nucleus stained with DAPI). c Antibody binding density of control and treated tumors was estimated by Image-Pro Plus 6.0 (n = 5). Results represent means ± SD; ANOVA one-way test was applied. Source data are provided as a Source Data file.
Fig. 8
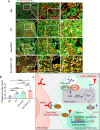
Fig. 8. Enhanced macrophage phagocytosis of tumor cells in combined treatment.
a Immunofluorescence images of macrophage phagocytosis in GL261 tumors treated with ET, anti-CD47 antibody, or anti-CD47 antibody + ET as in Fig. 6b. Macrophage phagocytosis of tumor cells are indicated with white arrows (green, tumor cells; red, infiltrated macrophages, blue, nucleus stained with DAPI). b Tumor macrophage phagocytosis was estimated by quantitation of phagocytic index by Image-Pro Plus 6.0 (n = 5). Results represent means ± SD; ANOVA two-way test. c A schematic pathway illustrating the FAO-CD47 axis-mediated aggressive phenotype and anti-phagocytosis in radioresistant GBM cells. The adaptive rewiring in metabolism increases the mitochondrial lipid combustion which is companied with the immunosuppressive function of CD47 anti-phagocytosis protecting the radioresistant GBM cells from macrophagic attack. FAO upregulates CD47 transcription via NF-κB RelA acetylation by elevating cytoplasmic citrate concentration. Thus, the coordinative mechanism between FA metabolic dynamics and immune-escaping capacity in tumor cells features the involvement of multiple pathways contributing to an immunosuppressive (cold) tumor. Inhibition of mitochondrial FAO is suggested to enhance the control of GBM by radiation with anti-CD47 immunotherapy. Source data are provided as a Source Data file.

Similar articles

Cited by

References

    1. Stupp R, et al. Radiotherapy plus concomitant and adjuvant temozolomide for glioblastoma. N. Engl. J. Med. 2005;352:987–996. - PubMed
    1. Wen PY, Kesari S. Malignant gliomas in adults. N. Engl. J. Med. 2008;359:492–507. - PubMed
    1. Ostrom QT, et al. CBTRUS statistical report: primary brain and other central nervous system tumors diagnosed in the United States in 2012–2016. Neuro. Oncol. 2019;21:v1–v100. - PMC - PubMed
    1. Vatner RE, Cooper BT, Vanpouille-Box C, Demaria S, Formenti SC. Combinations of immunotherapy and radiation in cancer therapy. Front. Oncol. 2014;4:325. - PMC - PubMed
    1. Marciscano AE, et al. Incorporating radiation oncology into immunotherapy: proceedings from the ASTRO-SITC-NCI immunotherapy workshop. J. Immunother. Cancer. 2018;6:6. - PMC - PubMed

Publication types