. 2022 Mar 21;13(1):1503.
doi: 10.1038/s41467-022-29085-y.

A non-dividing cell population with high pyruvate dehydrogenase kinase activity regulates metabolic heterogeneity and tumorigenesis in the intestine

Affiliations

A non-dividing cell population with high pyruvate dehydrogenase kinase activity regulates metabolic heterogeneity and tumorigenesis in the intestine

Carlos Sebastian et al. Nat Commun. .

Abstract

Although reprogramming of cellular metabolism is a hallmark of cancer, little is known about how metabolic reprogramming contributes to early stages of transformation. Here, we show that the histone deacetylase SIRT6 regulates tumor initiation during intestinal cancer by controlling glucose metabolism. Loss of SIRT6 results in an increase in the number of intestinal stem cells (ISCs), which translates into enhanced tumor initiating potential in APCmin mice. By tracking down the connection between glucose metabolism and tumor initiation, we find a metabolic compartmentalization within the intestinal epithelium and adenomas, where a rare population of cells exhibit features of Warburg-like metabolism characterized by high pyruvate dehydrogenase kinase (PDK) activity. Our results show that these cells are quiescent cells expressing +4 ISCs and enteroendocrine markers. Active glycolysis in these cells suppresses ROS accumulation and enhances their stem cell and tumorigenic potential. Our studies reveal that aerobic glycolysis represents a heterogeneous feature of cancer, and indicate that this metabolic adaptation can occur in non-dividing cells, suggesting a role for the Warburg effect beyond biomass production in tumors.


Conflict of interest statement

N.Y.R.A. is key opinion leader for Bruker Daltonics, scientific advisor to Invicro, and receives support from Thermo Finnegan and EMD Serono. R.M. is a founder of Galilei Biosciences.

Figures

Fig. 1
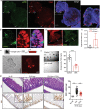
Fig. 1. SIRT6-dependent metabolic reprogramming regulates tumor initiation in the intestine.
a Tumor initiating potential was assayed by organoid formation experiments in EN medium. The pictures illustrate adenoma-derived organoids from APC and APC; Sirt6IECΔ mice. Scale bars, 300 μm. b Quantification of number of organoids derived from APC (n = 10) and APC; Sirt6IECΔ (n = 9) mice (p = 0.0263). Each experiment was done in triplicate and data is presented as mean ± SEM. c Organoid size was quantified by averaging two diameter measures in organoids derived from APC and APC; Sirt6IECΔ (n = 2) mice. The average size of all organoids is represented as mean ± SD (p = 0.003). A total of 64 organoids from APC mice and 129 from APC; Sirt6IEC mice were analyzed. d Number of organoids derived from adenomas from APC (n = 5) and APC; Sirt6IECΔ (n = 3) mice (p = 0.017). Each experiment was done in triplicate and data is presented as mean ± SD. e Representative images of ISH for Olfm4 (left) and quantification of Olfm4+ cells in APC and APC; Sirt6IECΔ untreated (n = 8 and n = 7, respectively) and treated with DCA (n = 5 and n = 3, respectively). P = 0.0169 (APC compared to APC; Sirt6IECΔ) and p = 0.0135 (APC; Sirt6IECΔ control compared to DCA-treated). Data is presented as mean ± SD. Scale bars, 100 μm. f ISC activity was measured by organoid formation assays in ENR medium. Left, representative images of 7-day organoids from control and Sirt6IECΔ mice (untreated and treated with DCA). Right, quantification of organoid number from control and Sirt6IECΔ mice untreated (n = 9 and n = 11, respectively) and treated with DCA (n = 4 and n = 5, respectively). P = 0.0273 (WT compared to Sirt6IECΔ) and p = 0.0279 (Sirt6IECΔ control compared to DCA-treated). Each experiment was done in triplicate and data is presented as mean ± SEM. Scale bars, 300 μm Two tailed t-test (for comparisons between two groups) or one-way ANOVA (for comparisons of more than two groups) were used to determine statistical significance between groups (*p < 0.05; **p < 0.01; ***p < 0.001). Source data are provided as a Source Data file.
Fig. 2
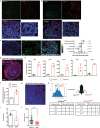
Fig. 2. High PDK activity defines +4 ISCs from EE lineage.
a Immunofluorescence of pPDH in small intestinal sections. pPDH+ cells are present in both crypts (arrows) and villi (arrowheads). On the right, magnification of intestinal crypts and villi containing pPDH+ cells. Scale bar, 100 μm. b Percentage of pPDH+ cells in every crypt position (62 pPDH+ cells form four mice were scored). c Double immunofluorescence for pPDH and BrdU. Representative image of four different mice is shown. Scale bar, 25 μm. d pPDH immunofluorescence on isolated crypts from mTert-GFP mice. Arrows mark pPDH+mTert+ cells. Asterisk marks non-specific fluorescence signal. Scale bar, 50 μm. e Quantification of pPDH+, mTert+, and pPDH+mTert+ cells in the intestinal crypts form three mTert-GFP mice. A total of 68 crypts were scored. f Double immunofluorescence for pPDH and ChgA on intestinal sections. Arrows indicate double positive cells, arrowheads indicate pPDH+ChgA cells. Scale bar, 50 μm. g Quantification of pPDH+, ChgA+, and pPDH+ChgA+ cells on intestinal sections from three mice (at least 50 crypts/mouse were scored). Data are presented as mean ± SEM. h Gene set enrichment analysis of positive regulators of glycolysis in Bmi1-GFP cells compared to Lgr5 ISCs from Lgr5-GFP and Lgr5-DTR mice (Jadhav et al.). i Heat map of the glycolytic gene signature from (a) showing the core enriched genes. Source data are provided as a Source Data file.
Fig. 3
Fig. 3. High glycolysis supports stem cell potential of pPDH+ intestinal epithelial cells.
a Immunofluorescence of pPDH and ChgA in small intestinal organoids. Notice that most cells are pPDH+ChgA+ (arrows). The experiment was repeated four times with similar results. Scale bar, 25 μm. b Immunofluorescence of pPDH and Ki67 in intestinal organoids. The experiment was done four times with similar results. Scale bar, 20 μm. c Single cells derived from intestinal organoids were infected with the Pdk1-mCherry reporter. Picture shows a 3-day growing organoid with few crypt cells positive for the reporter (representative image of 10 different experiments). Scale bar, 50 μm. d Immunofluorescence showing co-localization of the mCherry reporter and pPDH (representative image of three independent experiments is shown). Scale bar, 50 μm. e FACS-sorted mCherry and mCherry+ cells were plated in matrigel and cultured in ENR medium. Organoids were counted 7 days after plating (n = 3 independent sorting experiments). Data are presented as mean ± SD. f Intestinal crypts were grown in ENR medium in the absence of presence of DCA and organoids counted at day 7 (n = 6 technical replicates). A representative experiment is shown. The experiment was repeated three times with similar results. Data are presented as mean ± SD. Two tail t-test was used to determine statistical significance between groups. Scale bar, 750 μm. g H&E staining (top) and Ki67 IHC (bottom) of intestinal sections of mice treated or untreated with DCA 6 days post-IR (11 Gy). The graph shows the quantification of Ki67+ cells in the intestines of these mice (n = 2 mice per condition, at least 30 crypts/mouse were scored). Two tailed t-test (for comparisons between two groups) or one-way ANOVA (for comparisons of more than two groups) were used to determine statistical significance between groups (*p < 0.05; **p < 0.01; ***p < 0.001). Source data are provided as a Source Data file.
Fig. 4
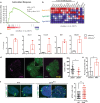
Fig. 4. High tumor initiating potential of pPDH+ cells from intestinal adenomas.
a Immunofluorescence for pPDH and ChgA of intestinal adenomas from Apcmin mice. A representative image of 24 adenomas from 6 mice is shown. Scale bar, 25 μm. b Immunofluorescence for pPDH and Ki67 of intestinal adenomas from Apcmin mice. A representative image of four adenomas from two mice is shown. Scale bar, 25 μm. c MALDI-MSI experiment showing relative abundance of hexose-phosphate in pPDH+ areas compared to pPDH− areas of an intestinal adenoma (pPDH staining of a consecutive section is shown, image is representative of three independent acquired sections from a single adenoma). Bar plot represents the fold change (average log2FC) of indicated metabolites of pPDH+ compared to pPDH− areas (one sample t-test p values are shown). n corresponds to a 100 μm (10 pixels of 10 μm size) of either pPDH+ or pPDH− clusters of cells. Data are presented as mean ± SEM. Scale bars, 100 µm. d Two photon microscopy image of a full-grown organoid from a single adenoma cell infected with the Pdk1-mCherry reporter. Organoids from three different APCmin mice were infected (a representative image is shown). Scale bar, 50 μm. e qPCR analysis showing RNA expression of indicated genes on mCherry sorted cells from two APCmin-Pdk1-mCherry organoid lines (n = 2). Data are presented as mean ± SEM. f Single mCherrylow and mCherryhigh cells FACS-sorted from Apcmin-derived organoids expressing the Pdk1-mCherry reporter were plated in EN medium and organoids formed counted at day 7. The bar plot shows the quantification of three independent sorting experiments of two different clones. Error bars indicate SD. g mCherry expression in a subcutaneous tumor from MC38-Pdk1-mCherry cells (a representative image of six different tumors is shown). Scale bar, 50 μm. h mCherryhigh and mCherrylow sorted cells were injected at the indicated cell dilutions in the flanks of C57BL6/J mice to analyze tumor-initiating potential. i Intestinal crypts from Apcmin mice were grown in EN medium in the absence or presence of 10 mM DCA and organoids counted at day 7 (n = 4 independent experiments). Data are presented as mean ± SEM. Two tailed t-test was used to determine statistical significance between groups (p = 0.028). j Quantification of the size of the organoids from (i). Error bars represent SD (p < 0.0001). Two tailed t-test was used to determine statistical significance between groups (*p < 0.05; **p < 0.01; ***p < 0.001). Source data are provided as a Source Data file.
Fig. 5
Fig. 5. Increased antioxidant response in pPDH+ cells.
a Gene set enrichment analysis of antioxidant genes in Bmi1-GFP cells compared to Lgr5 ISCs from Lgr5-GFP and Lgr5-DTR mice (Jadhav et al.) (nominal p value = 0.013). b Heat map of the antioxidant gene signature from (a) showing the core enriched genes. c qPCR analysis showing RNA expression of indicated genes on mCherry sorted cells from two APCmin-Pdk1-mCherry organoid lines (n = 2). Data are presented as mean ± SEM. d Data represent CellRox-Green MFI of 16 pPDH+ cells from ten organoids. For each pPDH+ cell, 5–6 adjacent pPDH− cells were analyzed (total of 54 pPDH− cells from 10 organoids). Data are presented as mean ± SD (p = 0.0257). Scale bars, 25 µm. e Organoid formation efficiency of Apc; Sirt6 ΔIEC organoids treated with 200 μM NAC. Data shown are from one experiment performed in triplicate, representative of n = 2. Data are presented as mean ± SD (p = 0.0285). f Immunofluorescence of pPDH in intestinal organoids from control and Sirt6IECΔ mice (representative crypts are shown). Dot plot shows the quantification of pPDH+ cells in a total of 40 crypts from organoids derived from two control and two Sirt6IECΔ mice (p = 0.0073). Error bars indicate SD. Scale bars, 20 μm. Two tailed t-test was used to determine statistical significance between groups (*p < 0.05; **p < 0.01; ***p < 0.001). Source data are provided as a Source Data file.

Similar articles

Cited by

References

    1. Vander Heiden MG, DeBerardinis RJ. Understanding the intersections between metabolism and cancer biology. Cell. 2017;168:657–669. doi: 10.1016/j.cell.2016.12.039. - DOI - PMC - PubMed
    1. Hanahan D, Weinberg RA. Hallmarks of cancer: the next generation. Cell. 2011;144:646–674. doi: 10.1016/j.cell.2011.02.013. - DOI - PubMed
    1. Sebastian C, et al. The histone deacetylase SIRT6 is a tumor suppressor that controls cancer metabolism. Cell. 2012;151:1185–1199. doi: 10.1016/j.cell.2012.10.047. - DOI - PMC - PubMed
    1. Barker N, et al. Crypt stem cells as the cells-of-origin of intestinal cancer. Nature. 2009;457:608–611. doi: 10.1038/nature07602. - DOI - PubMed
    1. Kemper K, et al. Monoclonal antibodies against Lgr5 identify human colorectal cancer stem cells. Stem Cells. 2012;30:2378–2386. doi: 10.1002/stem.1233. - DOI - PubMed

Publication types

MeSH terms

Substances