. 2022 Mar 21;13(1):1525.
doi: 10.1038/s41467-022-29206-7.

The induction of natural competence adapts staphylococcal metabolism to infection

Affiliations

The induction of natural competence adapts staphylococcal metabolism to infection

Mar Cordero et al. Nat Commun. .

Abstract

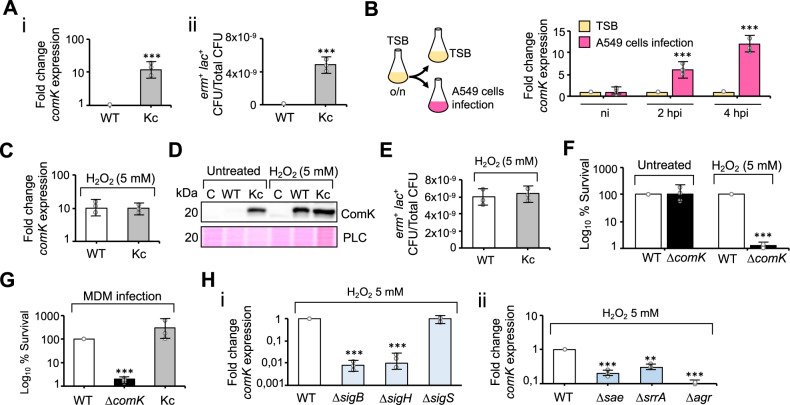
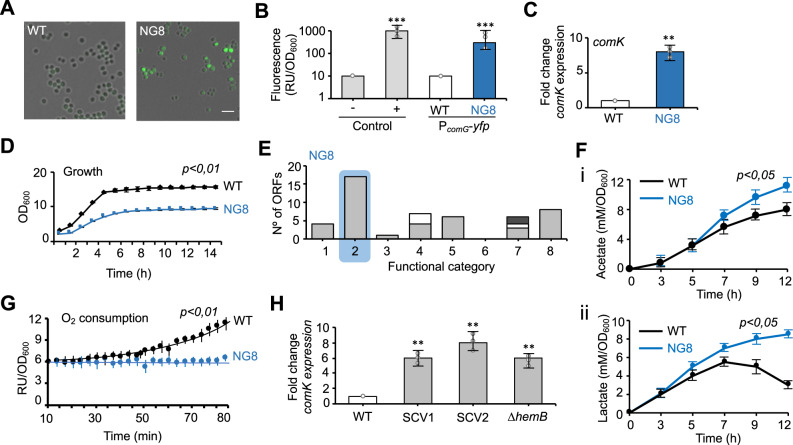
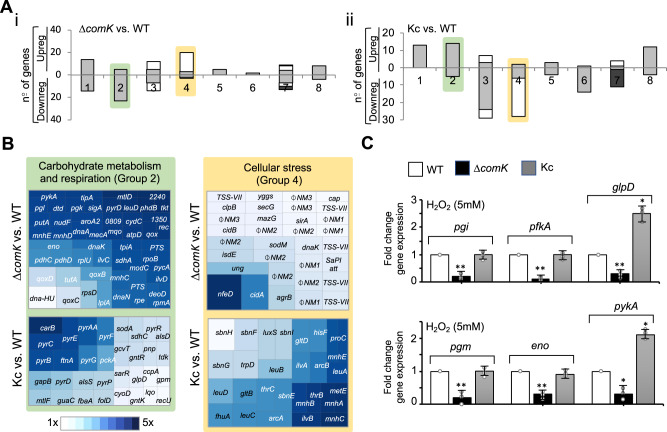
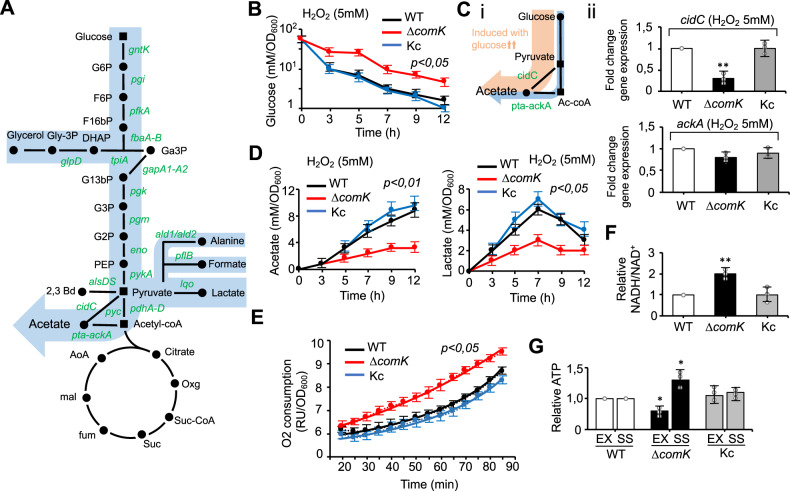
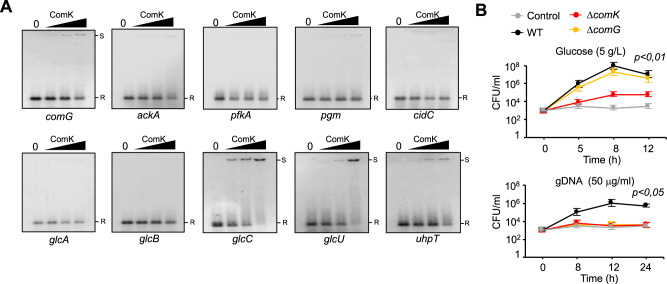
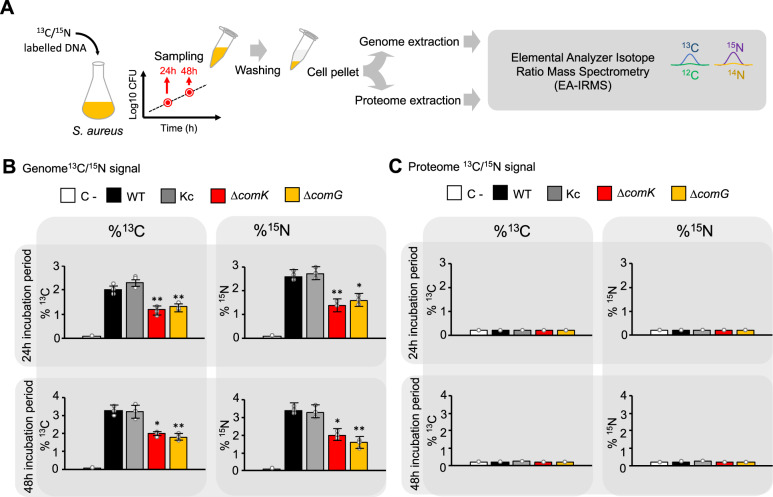
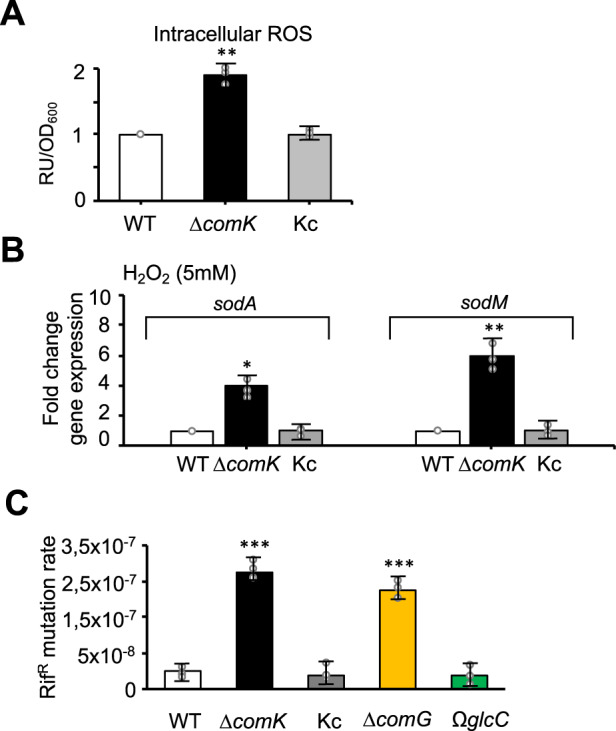
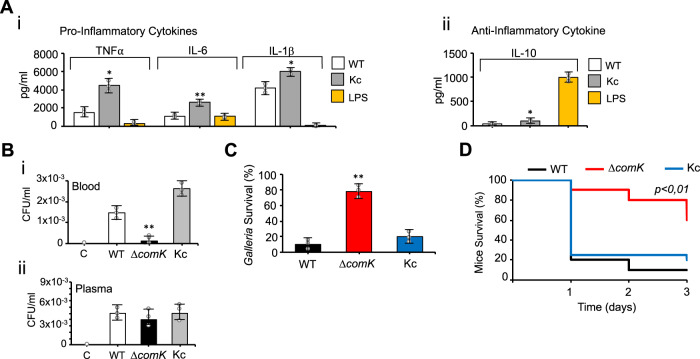
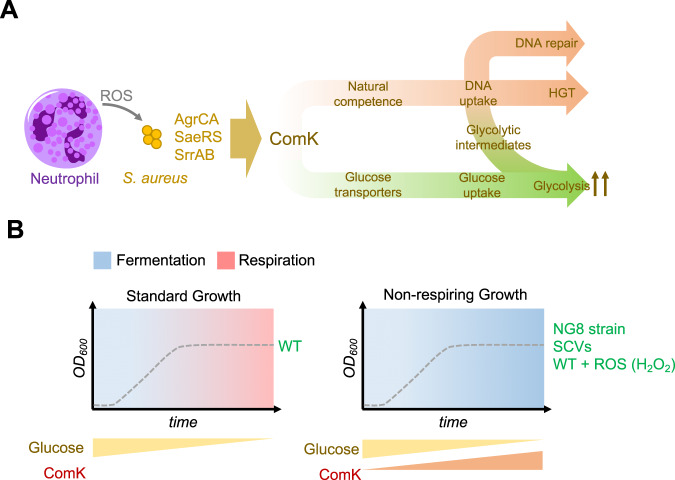
A central question concerning natural competence is why orthologs of competence genes are conserved in non-competent bacterial species, suggesting they have a role other than in transformation. Here we show that competence induction in the human pathogen Staphylococcus aureus occurs in response to ROS and host defenses that compromise bacterial respiration during infection. Bacteria cope with reduced respiration by obtaining energy through fermentation instead. Since fermentation is energetically less efficient than respiration, the energy supply must be assured by increasing the glycolytic flux. The induction of natural competence increases the rate of glycolysis in bacteria that are unable to respire via upregulation of DNA- and glucose-uptake systems. A competent-defective mutant showed no such increase in glycolysis, which negatively affects its survival in both mouse and Galleria infection models. Natural competence foster genetic variability and provides S. aureus with additional nutritional and metabolic possibilities, allowing it to proliferate during infection.


Conflict of interest statement

The authors declare no competing interests.

Figures

Fig. 1
Fig. 1. comK is induced in response to oxidative stress.
A (i) qRT-PCR analysis of comK expression in S. aureus WT (wild type) and Kc, a strain that constitutively expresses comK (TSB medium 37 °C, agitation 200 rpm). (ii) DNA uptake efficiency of different S. aureus strains. Data represent the number of CFU per ml of erm+ lac+ colonies in relation to the total CFU per ml (CFU/ml). Significance was measured by two-tailed Student t test; ***p < 0.001. Data are shown as mean ± SD of three independent experiments (n = 3). B qRT-PCR analysis of comK expression during S. aureus infection of A549 human-lung epithelial cells (MOI 100); analysis at 2 and 4 h post-infection (h.p.i.). The inoculum was obtained from a TSB culture. As a control, fresh TSB medium was inoculated with a comparable number of S. aureus cells. Statistical analysis, two-tailed Student t test; ***p < 0.001. Data are shown as mean ± SD of three independent experiments (n = 3). C qRT-PCR analysis of comK expression in WT and Kc strains in the presence of H2O2 (5 mM) Data are shown as mean ± SD of three independent experiments (n = 3). D Immunodetection of ComK protein levels in WT and Kc strains in H2O2-treated and untreated cultures. Ponceau membrane staining is shown as a protein loading control (PLC). These results are representative of the results obtained in three independent experiments. E DNA uptake efficiency of WT and Kc strains in TSB cultures supplemented with H2O2 (5 mM). Data are shown as mean ± SD of three independent experiments (n = 3). F Survival (%) of different S. aureus strains in untreated TSB cultures or TSB cultures with H2O2 (5 mM). The survival rate was determined when cultures reached the mid-exponential phase. Statistical analysis, two-tailed Student t test; ***p < 0.001. Data are shown as mean ± SD of three independent experiments (n = 3). G S. aureus survival (%) in infected human monocyte-derived macrophages (MDM) (MOI 10) at 2 h.p.i. Differences were examined by one-sided ANOVA with Tukey’s test for multiple comparisons; ***p < 0.001. Data are shown as mean ± SD of three independent experiments (n = 3). H qRT-PCR analyses of comK expression in different S. aureus mutants in TSB cultures supplemented with H2O2 (5 mM). Differences were detected by one-sided ANOVA with Tukey’s test for multiple comparisons; ***p < 0.01, ***p < 0.001. Data are shown as mean ± SD of three independent experiments (n = 3). Source data are provided as a Source Data file.
Fig. 2
Fig. 2. comK induction occurs in fermenting S. aureus strains.
A Fluorescence microscopy analysis of PcomG-yfp expression in the WT and the nitrosoguanidine-treated strain NG8. The NG8 strain showed a heterogeneously distributed fluorescence signal in a subpopulation of cells. Scale bar = 10 μm. B Quantitative determination of the fluorescence signal in PcomG-yfp-expressing WT and NG8 strains. The negative and positive controls were B. subtilis 168 WT and the PcomG-yfp labeled strain, respectively. Significance was measured by two-tailed Student t test; ***p < 0.001. Data are shown as mean ± SD of three independent experiments (n = 3). C qRT-PCR analysis of comK expression in untreated TSB cultures. Statistical analysis, two-tailed Student t test; **p < 0.01. Data are shown as mean ± SD of three independent experiments (n = 3). D Growth curves of WT and NG8 strains in untreated TSB cultures. Two-tailed Student t test. Data are shown as mean ± SD of three independent experiments (n = 3). E Classification of ORFs that harbor SNPs in the strain NG8 using TIGRfam, SEED, and Gene Ontology functional categories. Represented ORFs harboring nonsense mutations and missense mutations with moderate effect. For each category, columns represent the number of regulated genes. Group 1—protein metabolism; group 2—carbohydrate metabolism and respiration; group 3—amino acid metabolism; group 4—stress response genes; group 5—virulence; group 6—iron acquisition; group 7—DNA metabolism (gray), cell division (white); group 8—other genes. Group 2 genes were more strongly represented in the NG8 strain (highlighted in blue). F Determination of acetate (i) and lactate (ii) levels in culture supernatants of the WT and NG8 strains. To measure acetate production, 10 ml of TSB cultures were grown in 100 ml Erlenmeyer flasks. To measure lactate production, 20 ml of cultures were grown in 100 ml Erlenmeyer flasks. Concentration is represented in relation to culture OD600. Statistical analysis, two-tailed Student t test. Data are shown as mean ± SD of three independent experiments (n = 3). G Determination of oxygen consumption rate in WT and NG8 strains over time. Oxygen quenches the fluorescence signal of the dye (ab197243) added to the culture, thus oxygen consumption is directly related to fluorescence. Oxygen consumption rates are represented as relative fluorescence units in relation to cultures at OD600. Cultures were grown in TSB medium for 24 h at 37 °C with agitation (200 rpm). Two-tailed Student t test. Data are shown as mean ± SD of three independent experiments (n = 3). H. qRT-PCR analysis of comK expression in TSB cultures of small-colony variants (SCV). SCV1 and SCV2 are clinical isolates from the Hospital Ramón y Cajal (Madrid, Spain). ΔhemB is a laboratory mutant. Comparisons were made using one-sided ANOVA with Tukey’s test for multiple comparisons; **p < 0.01. Data are shown as mean ± SD of three independent experiments (n = 3). Source data are provided as a Source Data file.
Fig. 3
Fig. 3. ComK induces the expression of glycolytic genes.
A Classification of comK-regulated genes using TIGRfam, SEED, and Gene Ontology functional categories. For each category, columns represent the number of regulated genes from DESeq analyses using a fold-change threshold of >2. Pairwise comparisons were made of S. aureus strains showing different comK expression levels. The ΔcomK vs. WT comparison (i) involved untreated TSB cultures whereas the Kc vs. WT comparison, and (ii) made use of ROS-induced TSB cultures. Group 1—protein metabolism; group 2—carbohydrate metabolism and respiration; group 3—amino acid (gray) and pigment (white) metabolism; group 4—stress response genes (gray) and phages (white); group 5—virulence and defense; group 6—iron acquisition; group 7—DNA metabolism (gray), cell division (white) and cell envelope (dark green); group 8—other genes. Gene expression changes detected for groups 2 (highlighted in green) and 4 (highlighted in yellow) showed an uniform response under the different growth conditions. Group 2 genes were upregulated in ΔcomK whereas in the Kc strain they were downregulated. Group 4 genes were induced in the ΔcomK mutant but downregulated in the Kc strain. B Voronoi treemap representing genes regulated by comK expression in group 2 (highlighted in green) and group 4 (highlighted in yellow). Genes in which expression was altered are represented and functionally classified. Each section is labeled with the name of the genes represented. C qRT-PCR analysis of glycolytic genes in different S. aureus strains in H2O2-treated TSB cultures. pgi glucose-6-phosphate isomerase, pfkA 6-phosphofructokinase, glpD glycerol-3-phosphate dehydrogenase, pgm phosphoglucomutase, eno enolase, and pykA pyruvate kinase. Comparisons were made using one-sided ANOVA with Tukey’s test for multiple comparisons; *p < 0.05, **p < 0.01. Data are shown as mean ± SD of three independent experiments (n = 3). Source data are provided as a Source Data file.
Fig. 4
Fig. 4. ComK upregulates glycolysis in S. aureus cells.
A Simplified representation of the S. aureus glucose catabolic pathway. Glucose is catabolized to pyruvate, which can be reduced to lactate, 2,3 butanediol (2,3 Bd) or acetyl-CoA. In the presence of high glucose levels, acetyl-CoA is converted to acetate via fermentation (blue arrow) to produce ATP; respiratory chain activity is thus reduced. Lower glucose levels redirect acetyl-CoA towards the TCA cycle. The NADH generated in glycolysis and the TCA cycle is oxidized via the respiratory chain to restore the redox balance and to produce ATP. The genes coding for glycolytic enzymes that are upregulated by comK are shown in green. B Determination of glucose levels in supernatants of H2O2-treated cultures. Concentration is represented in relation to culture OD600. Statistical significance was measured by one-sided ANOVA with Tukey’s test for multiple comparison. Data are shown as mean ± SD of three independent experiments (n = 3). C Genetic pathway to acetate production. (i) Overflow metabolic pathways to acetate production in S. aureus. Under aerobic conditions, acetyl CoA is converted to acetate by the Pta (phosphotransacetylase)/AckA (acetate kinase) route. Excess glucose activates an additional route that diverts pyruvate towards acetate production via pyruvate oxidase (CidC). (ii) qRT-PCR analysis of ackA and cidC gene expression in the H2O2-treated S. aureus strains. Differences were examined by one-sided ANOVA with Tukey’s test for multiple comparison; **p < 0.01. Data are shown as mean ± SD of three independent experiments (n = 3). D Determination of acetate (left panel) and lactate (right panel) levels in culture supernatants of H2O2-treated TSB cultures. Concentration is represented in relation to culture OD600. Statistical significance was measured by one-sided ANOVA with Tukey’s test for multiple comparison. Data are shown as mean ± SD of three independent experiments (n = 3). E Determination of oxygen consumption rate in H2O2-treated TSB cultures over time. Statistical significance was measured by one-sided ANOVA with Tukey’s test for multiple comparison. Data are shown as mean ± SD of three independent experiments (n = 3). F Determination of intracellular NADH and NAD+ in the S. aureus strains. Results are presented as the NADH/NAD+ ratio for the different strains in relation to the WT. One-sided ANOVA; **p < 0.01. Data are shown as mean ± SD of three independent experiments (n = 3). G Determination of intracellular ATP levels in S. aureus cultures collected during the exponential (EX) and stationary phase (SS). ATP levels of the different strains are represented in relation to WT levels. Comparisons were made using one-sided ANOVA with Tukey’s test for multiple comparisons; *p < 0.05. Data are shown as mean ± SD of three independent experiments (n = 3). Source data are provided as a Source Data file.
Fig. 5
Fig. 5. ComK binds to and induces the expression of competence and glucose-uptake genes.
A Binding of ComK to regulatory regions of several transcriptional units (comG, ackA, glcA, glcB, glcC, glcU, uhpT, pgm, cidC, pfkA). comG and ackA represent positive and negative controls, respectively. The reference front of unbound DNA is marked with an R. Shifted DNA samples bound to ComK are marked with S. These results are representative of the results obtained in three independent experiments. B Growth determination (CFU/ml) in H2O2-treated SMM cultures (37 °C and 200 rpm agitation) supplemented with glucose or S. aureus DNA (gDNA) as a nutrient source. Control sample had no glucose or DNA added. Statistical significance was measured by one-sided ANOVA with Tukey’s test for multiple comparison. Data are shown as mean ± SD of three independent experiments (n = 3). Source data are provided as a Source Data file.
Fig. 6
Fig. 6. ComK induces DNA acquisition as a nucleotide source for DNA repair/synthesis.
A Schematic representation of the stable isotope probing (SIP) experimental workflow using labeled DNA. Staphylococcal cultures were supplemented with a 4.5 kb 13C and 15N-labeled DNA fragment, which was PCR-amplified from B. subtilis genome (20 μg/ml). Cells were washed, pelleted and the 13C/15N content of the S. aureus genome and proteome was analyzed by elemental analyzer isotope ratio mass spectrometry (EA-IRMS). Samples were taken at 24 and 48 h incubation period. B EA-IRMS analyses of the 13C/15N content (left/right panel, respectively) of genomes from S. aureus WT and different mutants at 24 and 48 h incubation period. C EA-IRMS analyses of the 13C/15N content of proteomes from S. aureus WT and different mutants. In B, C, the 13C and 15N contents are expressed as atom %. This is the percentage of the total carbon or nitrogen consisting of 13C or 15N, respectively. The negative control (C−) was a WT strain grown without labeled-DNA supplementation. As 13C and 15N are naturally present in the samples, the 13C/15N basal concentration was used as reference. Comparisons were made using one-sided ANOVA with Tukey’s test for multiple comparisons; *p < 0.05, **p < 0.01. Data are shown as mean ± SD of three independent experiments (n = 3). Source data are provided as a Source Data file.
Fig. 7
Fig. 7. The S. aureus ΔcomK mutant showed higher intracellular ROS levels and greater spontaneous DNA mutation rate.
A The ΔcomK mutant showed higher intracellular ROS levels than WT. Determination of intracellular levels of superoxide radicals using the MitoSOXTM probe in different S. aureus mutants. The signal is represented as relative fluorescence units in relation to cultures OD600. Comparisons were made using one-sided ANOVA with Tukey’s test for multiple comparisons; **p < 0.01. Data are shown as mean ± SD of three independent experiments (n = 3). B qRT-PCR analysis of sodA and sodM gene expression levels in H2O2-treated TSB cultures of different S. aureus strains. Differences were examined by one-sided ANOVA with Tukey’s test for multiple comparisons; *p < 0.05, **p < 0.01. Data are shown as mean ± SD of three independent experiments (n = 3). The ΔcomK mutant showed higher intracellular ROS levels. C Determination of spontaneous mutation rate in different S. aureus strains in H2O2-treated cultures. The mutation rate was determined by quantification of the number of CFU that show spontaneous resistance to rifampicin (50 μg/ml) with respect to the total number of CFU. Differences were examined by one-sided ANOVA with Tukey’s test for multiple comparisons; ***p < 0.001. Data are shown as mean ± SD of three independent experiments (n = 3). Source data are provided as a Source Data file.
Fig. 8
Fig. 8. comK expression is required for S. aureus survival during infection.
A Quantification of (i) pro-inflammatory cytokine production (TNFα, IL1β, IL6), and (ii) anti-inflammatory cytokine production (IL10) in the supernatant of monocyte-derived macrophages infected with different S. aureus strains (MOI 10) and analyzed at 24 h.p.i. Comparisons were made using one-sided ANOVA with Tukey’s test for multiple comparisons; *p < 0.05. Data are shown as mean ± SD of three independent experiments (n = 3). The activation of the pro- and anti-inflammatory immune response in macrophages is indicative of the severity of infection. Purified lipopolysaccharide (LPS) from Escherichia coli was used as a positive control. B Bacterial survival, measured as CFU/mL, of the different S. aureus strains, after 2 h incubation with non-coagulated human blood (i) or plasma (ii). Differences were examined by one-sided ANOVA with Tukey’s test for multiple comparisons; **p < 0.01. Data are shown as mean ± SD of three independent experiments (n = 3). C Galleria mellonella were infected with different S. aureus strains (106 CFU). Surviving larvae were counted after 48 h of incubation (n = 15 larvae/group; 3 independent experiments). Differences were examined by one-sided ANOVA with Tukey’s test for multiple comparisons; **p < 0.01. Data are shown as mean ± SD of three independent experiments (n = 3). D Murine pneumonia model: percentage survival of S. aureus-infected mice (n = 10). Differences in survival were analyzed by the log-rank test. Statistical significance was measured by two-tailed Student’s t test, **p < 0.01. Source data are provided as a Source Data file.
Fig. 9
Fig. 9. A schematic representation of the role of comK in S. aureus.
A comK induction in S. aureus laboratory cultures. comK expression is not required during the exponential growth of WT cells in TSB medium as carbohydrates are largely available for fermentative growth and when these carbohydrates become more scarce, S. aureus relies on respiration to obtain energy. The addition of H2O2 to the cultures inhibits S. aureus respiration; thus, cells grow using fermentation even when the concentration of carbohydrates decreases. In these growth conditions, the cells induce comK expression to increase their glycolytic capabilities. B comK induction during infection. S. aureus has little access to oxygen, and bacterial respiration is damaged by the ROS produced by the cells from the immune system (e.g. macrophages and/or neutrophils); respiration rates are therefore reduced. comK is induced by the presence of ROS via activation of AgrCA, SaeRS or SrrAB signaling pathways. comK induction is critical in cells that are unable to respire, to increase glucose and DNA uptake capabilities and to increase the glycolytic rate that allows and effective fermentative growth. DNA uptake provides an additional source of nucleotides required for the repair of DNA damage caused by ROS and a source of genetic material for horizontal gene transfer.

Similar articles

Cited by

References

    1. Kluytmans J, van Belkum A, Verbrugh H. Nasal carriage of Staphylococcus aureus: epidemiology, underlying mechanisms, and associated risks. Clin. Microbiol. Rev. 1997;10:505–520. - PMC - PubMed
    1. Otto M. MRSA virulence and spread. Cell. Microbiol. 2012;14:1513–1521. - PMC - PubMed
    1. Lee AS, et al. Methicillin-resistant Staphylococcus aureus. Nat. Rev. Dis. Prim. 2018;4:18033. - PubMed
    1. Somerville GA, Proctor RA. At the crossroads of bacterial metabolism and virulence factor synthesis in Staphylococci. Microbiol. Mol. Biol. Rev. 2009;73:233–248. - PMC - PubMed
    1. Vitko, N. P., Spahich, N. A. & Richardson, A. R. Glycolytic dependency of high-level nitric oxide resistance and virulence in Staphylococcus aureus. mBio6, 10.1128/mBio.00045-15 (2015). - PMC - PubMed

Publication types

Substances