

Microbiomes in the Challenger Deep slope and bottom-axis sediments
- PMID: 35314706
- PMCID: PMC8938466
- DOI: 10.1038/s41467-022-29144-4
Microbiomes in the Challenger Deep slope and bottom-axis sediments
Abstract
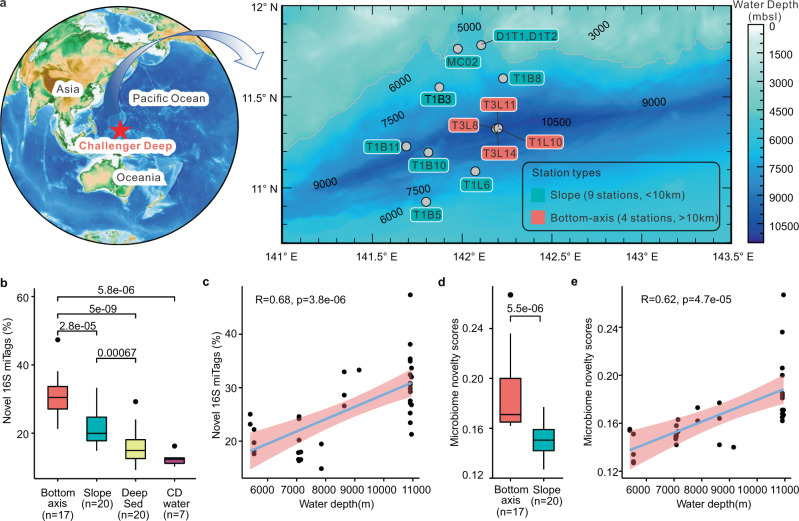
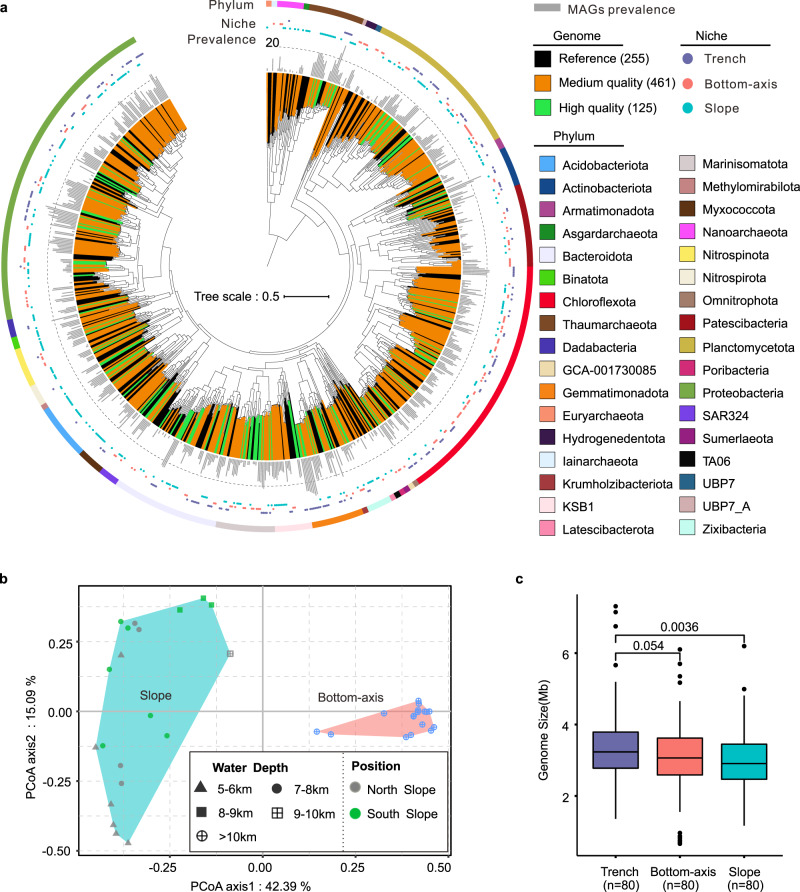
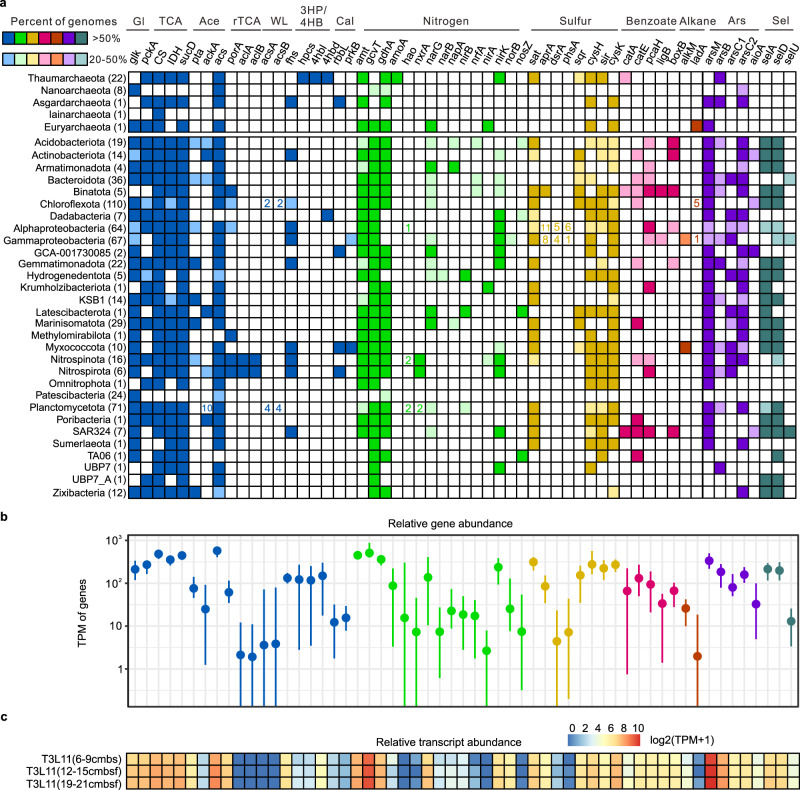
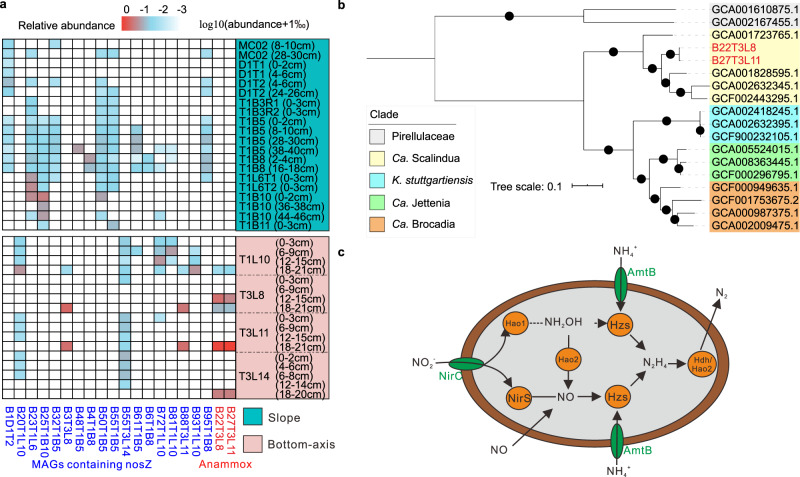
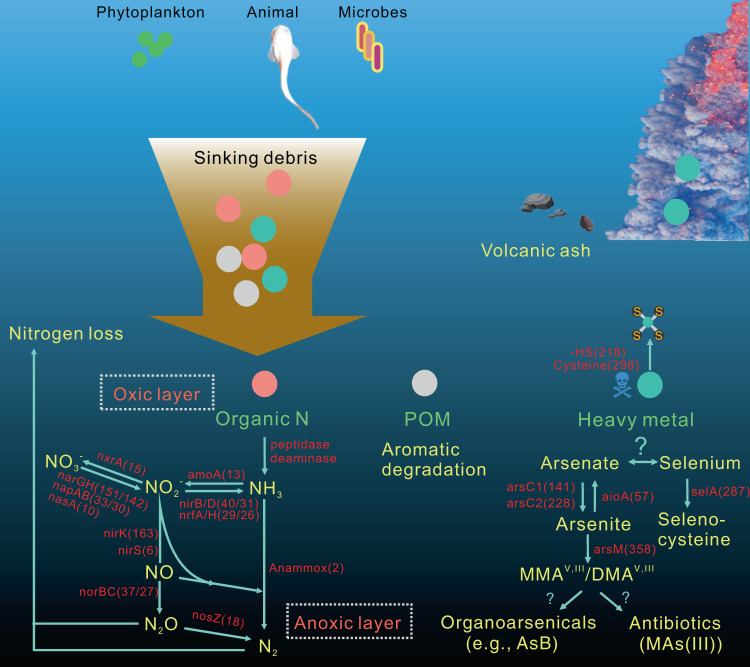
Hadal trenches are the deepest and most remote regions of the ocean. The 11-kilometer deep Challenger Deep is the least explored due to the technical challenges of sampling hadal depths. It receives organic matter and heavy metals from the overlying water column that accumulate differently across its V-shaped topography. Here, we collected sediments across the slope and bottom-axis of the Challenger Deep that enable insights into its in situ microbial communities. Analyses of 586 metagenome-assembled genomes retrieved from 37 metagenomes show distinct diversity and metabolic capacities between bottom-axis and slope sites. 26% of prokaryotic 16S rDNA reads in metagenomes were novel, with novelty increasing with water and sediment depths. These predominantly heterotrophic microbes can recycle macromolecules and utilize simple and complex hydrocarbons as carbon sources. Metagenome and metatranscriptome data support reduction and biotransformation of arsenate for energy gain in sediments that present a two-fold greater accumulation of arsenic compared to non-hadal sites. Complete pathways for anaerobic ammonia oxidation are predominantly identified in genomes recovered from bottom-axis sediments compared to slope sites. Our results expand knowledge of microbially-mediated elemental cycling in hadal sediments, and reveal differences in distribution of processes involved in nitrogen loss across the trench.
© 2022. The Author(s).
Conflict of interest statement
The authors declare no competing interests.
Figures
Similar articles
-
Revealing the full biosphere structure and versatile metabolic functions in the deepest ocean sediment of the Challenger Deep.Genome Biol. 2021 Jul 13;22(1):207. doi: 10.1186/s13059-021-02408-w. Genome Biol. 2021. PMID: 34256809 Free PMC article.
-
Microbial communities reveal niche partitioning across the slope and bottom zones of the challenger deep.Environ Microbiol Rep. 2024 Aug;16(4):e13314. doi: 10.1111/1758-2229.13314. Environ Microbiol Rep. 2024. PMID: 39086173 Free PMC article.
-
Spatial variations of microbial communities in abyssal and hadal sediments across the Challenger Deep.PeerJ. 2019 May 17;7:e6961. doi: 10.7717/peerj.6961. eCollection 2019. PeerJ. 2019. PMID: 31149407 Free PMC article.
-
Metagenomic characterization of a novel non-ammonia-oxidizing Thaumarchaeota from hadal sediment.Microbiome. 2024 Jan 8;12(1):7. doi: 10.1186/s40168-023-01728-2. Microbiome. 2024. PMID: 38191433 Free PMC article.
-
New Microbial Biodiversity in Marine Sediments.Ann Rev Mar Sci. 2021 Jan;13:161-175. doi: 10.1146/annurev-marine-032020-014552. Epub 2020 Aug 3. Ann Rev Mar Sci. 2021. PMID: 32746696 Review.
Cited by
-
Depth shapes microbiome assembly and network stability in the Mariana Trench.Microbiol Spectr. 2024 Jan 11;12(1):e0211023. doi: 10.1128/spectrum.02110-23. Epub 2023 Dec 12. Microbiol Spectr. 2024. PMID: 38084983 Free PMC article.
-
Occurrence, Diversity, and Genomes of "Candidatus Patescibacteria" along the Early Diagenesis of Marine Sediments.Appl Environ Microbiol. 2022 Dec 20;88(24):e0140922. doi: 10.1128/aem.01409-22. Epub 2022 Dec 5. Appl Environ Microbiol. 2022. PMID: 36468881 Free PMC article.
-
Virioplankton assemblages from challenger deep, the deepest place in the oceans.iScience. 2022 Jun 27;25(8):104680. doi: 10.1016/j.isci.2022.104680. eCollection 2022 Aug 19. iScience. 2022. PMID: 35942087 Free PMC article.
-
Metagenomic profiles of archaea and bacteria within thermal and geochemical gradients of the Guaymas Basin deep subsurface.Nat Commun. 2023 Nov 27;14(1):7768. doi: 10.1038/s41467-023-43296-x. Nat Commun. 2023. PMID: 38012208 Free PMC article.
-
Ecogenomics reveals viral communities across the Challenger Deep oceanic trench.Commun Biol. 2022 Oct 4;5(1):1055. doi: 10.1038/s42003-022-04027-y. Commun Biol. 2022. PMID: 36192584 Free PMC article.
References
-
- Jamieson AJ, Fujii T, Mayor DJ, Solan M, Priede IG. Hadal trenches: the ecology of the deepest places on Earth. Trends Ecol. Evol. 2010;25:190–197. - PubMed
-
- Stewart HA, Jamieson AJ. Habitat heterogeneity of hadal trenches: considerations and implications for future studies. Prog. Oceanogr. 2018;161:47–65.
-
- Zhu G, et al. Along-strike variation in slab geometry at the southern Mariana subduction zone revealed by seismicity through ocean bottom seismic experiments. Geophys. J. Int. 2019;218:2122–2135.
Publication types
MeSH terms
Substances
Associated data
LinkOut - more resources
Full Text Sources
