

Spinal cord microstructural changes are connected with the aberrant sensorimotor cortical oscillatory activity in adults with cerebral palsy
- PMID: 35314729
- PMCID: PMC8938462
- DOI: 10.1038/s41598-022-08741-9
Spinal cord microstructural changes are connected with the aberrant sensorimotor cortical oscillatory activity in adults with cerebral palsy
Abstract
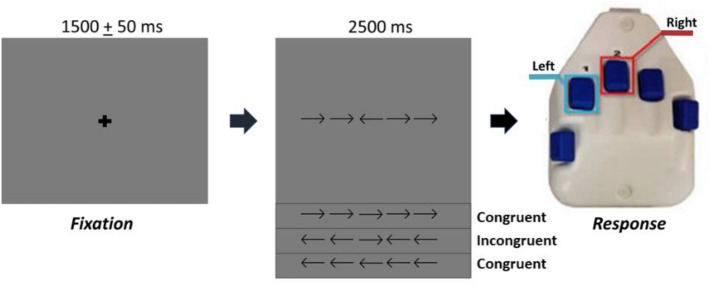
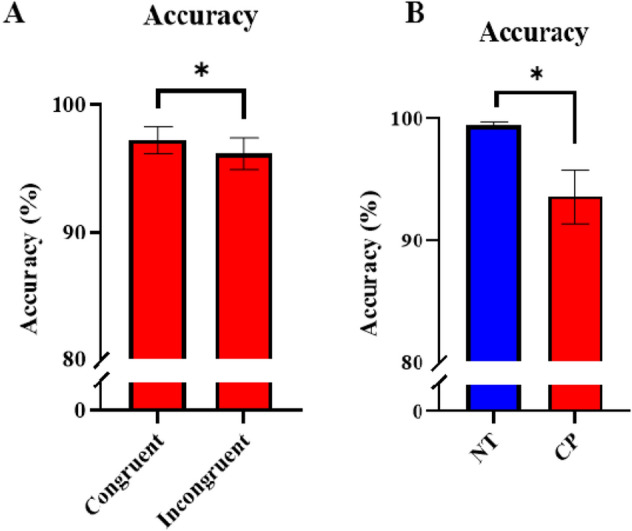
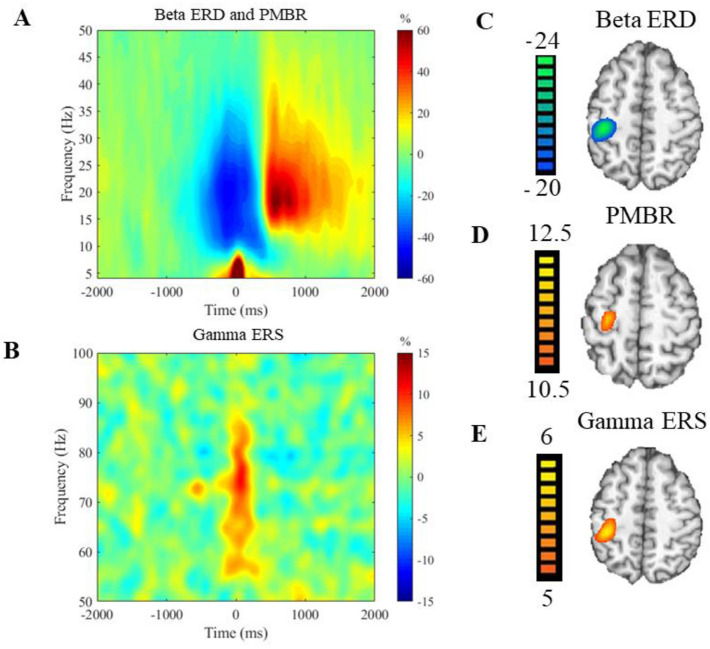
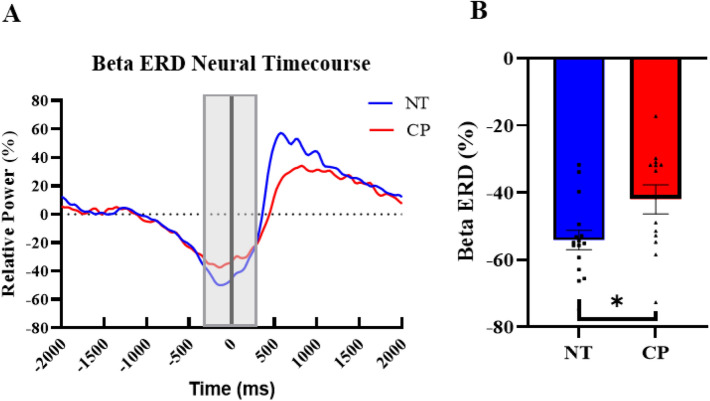
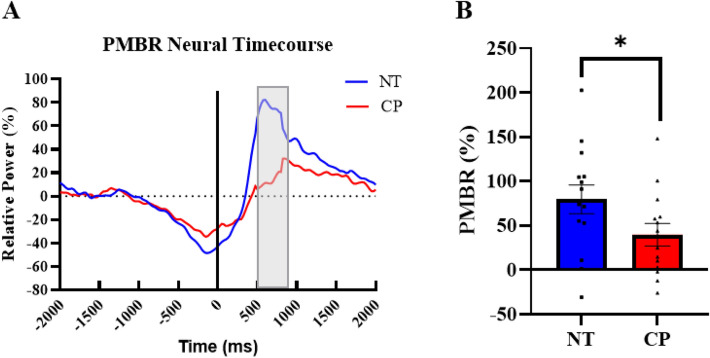
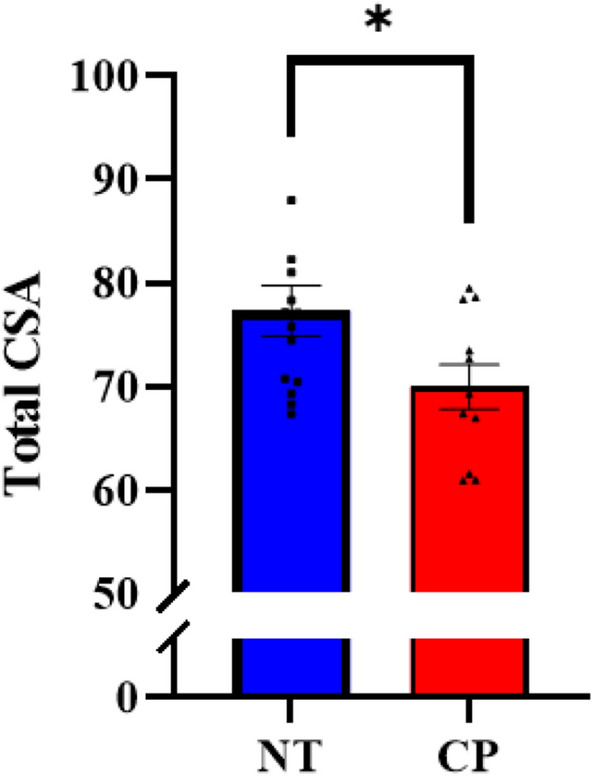
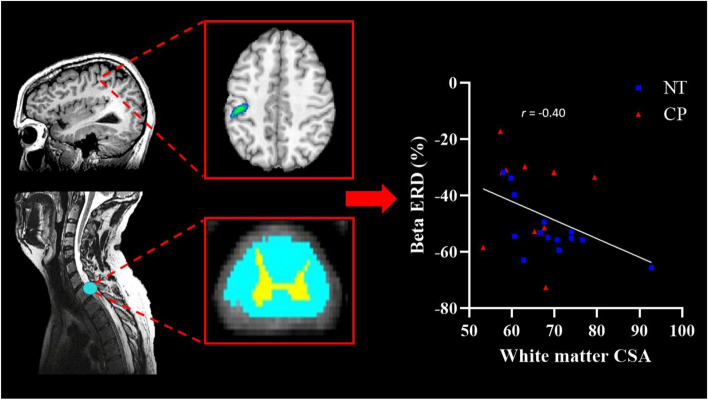
Previous animal models have illustrated that reduced cortical activity in the developing brain has cascading activity-dependent effects on the microstructural organization of the spinal cord. A limited number of studies have attempted to translate these findings to humans with cerebral palsy (CP). Essentially, the aberrations in sensorimotor cortical activity in those with CP could have an adverse effect on the spinal cord microstructure. To investigate this knowledge gap, we utilized magnetoencephalographic (MEG) brain imaging to quantify motor-related oscillatory activity in fourteen adults with CP and sixteen neurotypical (NT) controls. A subset of these participants also underwent cervical-thoracic spinal cord MRI. Our results showed that the strength of the peri-movement beta desynchronization and the post-movement beta rebound were each weaker in the adults with CP relative to the controls, and these weakened responses were associated with poorer task performance. Additionally, our results showed that the strength of the peri-movement beta response was associated with the total cross-sectional area of the spinal cord and the white matter cross-sectional area. Altogether these results suggest that the altered sensorimotor cortical activity seen in CP may result in activity-dependent plastic changes within the spinal cord microstructure, which could ultimately contribute to the sensorimotor deficits seen in this population.
© 2022. The Author(s).
Conflict of interest statement
The authors declare no competing interests.
Figures
Similar articles
-
Microstructural changes in the spinal cord of adults with cerebral palsy.Dev Med Child Neurol. 2021 Aug;63(8):998-1003. doi: 10.1111/dmcn.14860. Epub 2021 Mar 14. Dev Med Child Neurol. 2021. PMID: 33719037 Free PMC article.
-
Aberrant movement-related somatosensory cortical activity mediates the extent of the mobility impairments in persons with cerebral palsy.J Physiol. 2022 Aug;600(15):3537-3548. doi: 10.1113/JP282898. Epub 2022 Jul 6. J Physiol. 2022. PMID: 35723200 Free PMC article.
-
Hand Motor Actions of Children With Cerebral Palsy Are Associated With Abnormal Sensorimotor Cortical Oscillations.Neurorehabil Neural Repair. 2019 Dec;33(12):1018-1028. doi: 10.1177/1545968319883880. Epub 2019 Nov 2. Neurorehabil Neural Repair. 2019. PMID: 31679451 Free PMC article.
-
The relationship between neuroimaging and motor outcome in children with cerebral palsy: A systematic review-Part B diffusion imaging and tractography.Res Dev Disabil. 2020 Feb;97:103569. doi: 10.1016/j.ridd.2019.103569. Epub 2019 Dec 31. Res Dev Disabil. 2020. PMID: 31901671
-
Mu rhythm: State of the art with special focus on cerebral palsy.Ann Phys Rehabil Med. 2020 Oct;63(5):439-446. doi: 10.1016/j.rehab.2019.06.007. Epub 2019 Jul 9. Ann Phys Rehabil Med. 2020. PMID: 31299375 Review.
Cited by
-
Attenuated post-movement beta rebound reflects psychomotor alterations in major depressive disorder during a simple visuomotor task: a MEG study.BMC Psychiatry. 2023 Jun 3;23(1):395. doi: 10.1186/s12888-023-04844-3. BMC Psychiatry. 2023. PMID: 37270511 Free PMC article.
-
Regular cannabis use alters the neural dynamics serving complex motor control.Hum Brain Mapp. 2023 Dec 15;44(18):6511-6522. doi: 10.1002/hbm.26527. Epub 2023 Nov 13. Hum Brain Mapp. 2023. PMID: 37955378 Free PMC article.
-
Contributions of the sensory system to motor learning : Focus on Cerebral Palsy.Pediatr Res. 2024 Jul 27. doi: 10.1038/s41390-024-03421-y. Online ahead of print. Pediatr Res. 2024. PMID: 39068271 No abstract available.
-
Reduced wrist flexor H-reflex excitability is linked with increased wrist proprioceptive error in adults with cerebral palsy.Front Neurol. 2022 Aug 9;13:930303. doi: 10.3389/fneur.2022.930303. eCollection 2022. Front Neurol. 2022. PMID: 36016542 Free PMC article.
-
Motor practice related changes in the sensorimotor cortices of youth with cerebral palsy.Brain Commun. 2024 Sep 26;6(5):fcae332. doi: 10.1093/braincomms/fcae332. eCollection 2024. Brain Commun. 2024. PMID: 39391334 Free PMC article.
References
-
- Rosenbaum P, et al. A report: The definition and classification of cerebral palsy April 2006. Dev. Med. Child Neurol. Suppl. 2007;109:8–14. - PubMed
Publication types
MeSH terms
Grants and funding
LinkOut - more resources
Full Text Sources
Medical
Research Materials
Miscellaneous
