

Spectral characterisation of ventricular intracardiac potentials in human post-ischaemic bipolar electrograms
- PMID: 35314732
- PMCID: PMC8938475
- DOI: 10.1038/s41598-022-08743-7
Spectral characterisation of ventricular intracardiac potentials in human post-ischaemic bipolar electrograms
Abstract
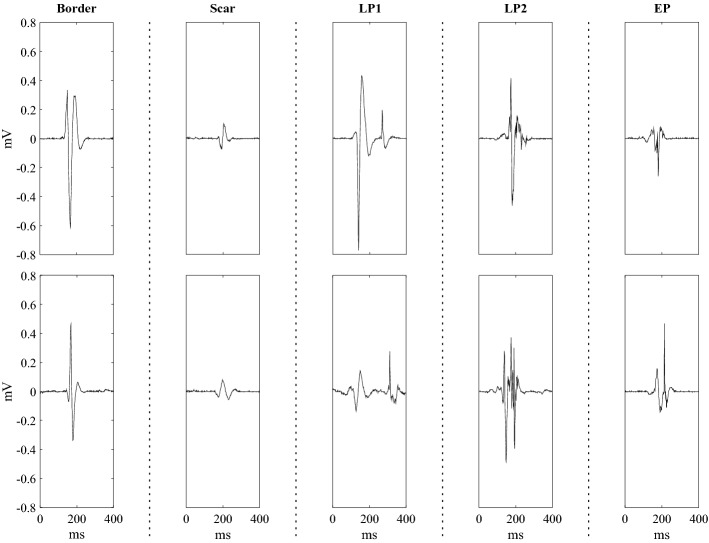
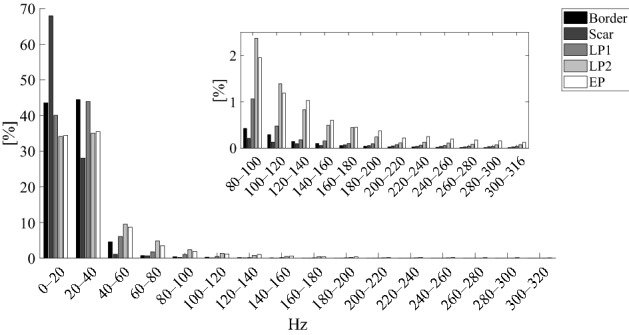
Abnormal ventricular potentials (AVPs) are frequently referred to as high-frequency deflections in intracardiac electrograms (EGMs). However, no scientific study performed a deep spectral characterisation of AVPs and physiological potentials in real bipolar intracardiac recordings across the entire frequency range imposed by their sampling frequency. In this work, the power contributions of post-ischaemic physiological potentials and AVPs, along with some spectral features, were evaluated in the frequency domain and then statistically compared to highlight specific spectral signatures for these signals. To this end, 450 bipolar EGMs from seven patients affected by post-ischaemic ventricular tachycardia were retrospectively annotated by an experienced cardiologist. Given the high variability of the morphologies observed, three different sub-classes of AVPs and two sub-categories of post-ischaemic physiological potentials were considered. All signals were acquired by the CARTO® 3 system during substrate-guided catheter ablation procedures. Our findings indicated that the main frequency contributions of physiological and pathological post-ischaemic EGMs are found below 320 Hz. Statistical analyses showed that, when biases due to the signal amplitude influence are eliminated, not only physiological potentials show greater contributions below 20 Hz whereas AVPs demonstrate higher spectral contributions above ~ 40 Hz, but several finer differences may be observed between the different AVP types.
© 2022. The Author(s).
Conflict of interest statement
The authors declare no competing interests.
Figures


Similar articles
-
Implication of the distinctive bipolar intracardiac electrograms for ventricular arrhythmias arising from different regions of ventricular outflow tract.Europace. 2020 Sep 1;22(9):1367-1375. doi: 10.1093/europace/euaa116. Europace. 2020. PMID: 32449935
-
The use of a novel signal analysis to identify the origin of idiopathic right ventricular outflow tract ventricular tachycardia during sinus rhythm: Simultaneous amplitude frequency electrogram transformation mapping.PLoS One. 2017 Mar 10;12(3):e0173189. doi: 10.1371/journal.pone.0173189. eCollection 2017. PLoS One. 2017. PMID: 28282453 Free PMC article.
-
A DenseNet-based Abnormal Ventricular Potentials Onset Delineation: A Feasibility Study.Annu Int Conf IEEE Eng Med Biol Soc. 2024 Jul;2024:1-4. doi: 10.1109/EMBC53108.2024.10782878. Annu Int Conf IEEE Eng Med Biol Soc. 2024. PMID: 40039526
-
Intracardiac echocardiography in complex cardiac catheter ablation procedures.J Interv Card Electrophysiol. 2010 Sep;28(3):167-84. doi: 10.1007/s10840-010-9474-8. Epub 2010 May 18. J Interv Card Electrophysiol. 2010. PMID: 20480388 Review.
-
Reinserting Physiology into Cardiac Mapping Using Omnipolar Electrograms.Card Electrophysiol Clin. 2019 Sep;11(3):525-536. doi: 10.1016/j.ccep.2019.05.003. Card Electrophysiol Clin. 2019. PMID: 31400876 Review.
Cited by
-
Near-field detection and peak frequency metric for substrate and activation mapping of ventricular tachycardias in two- and three-dimensional circuits.Europace. 2024 Jul 2;26(7):euae154. doi: 10.1093/europace/euae154. Europace. 2024. PMID: 38833626 Free PMC article.
-
Computer-aided detection of arrhythmogenic sites in post-ischemic ventricular tachycardia.Sci Rep. 2023 Apr 27;13(1):6906. doi: 10.1038/s41598-023-33866-w. Sci Rep. 2023. PMID: 37106017 Free PMC article.
References
-
- Benjamin EJ, et al. Heart disease and stroke statistics—2019 update: A report from the American Heart Association. Circulation. 2019;139:e56–e528. - PubMed
-
- Harris P, Lysitsas D. Ventricular arrhythmias and sudden cardiac death. BJA Educ. 2015;16:221–229.
-
- Wissner E, Stevenson WG, Kuck K-H. Catheter ablation of ventricular tachycardia in ischaemic and non-ischaemic cardiomyopathy: Where are we today? A clinical review. Eur. Heart J. 2012;33:1440–1450. - PubMed
MeSH terms
LinkOut - more resources
Full Text Sources
Miscellaneous
