. 2022 Mar 21;12(1):4795.
doi: 10.1038/s41598-022-08645-8.

Shear stress switches the association of endothelial enhancers from ETV/ETS to KLF transcription factor binding sites

Affiliations

Shear stress switches the association of endothelial enhancers from ETV/ETS to KLF transcription factor binding sites

Roman Tsaryk et al. Sci Rep. .

Abstract

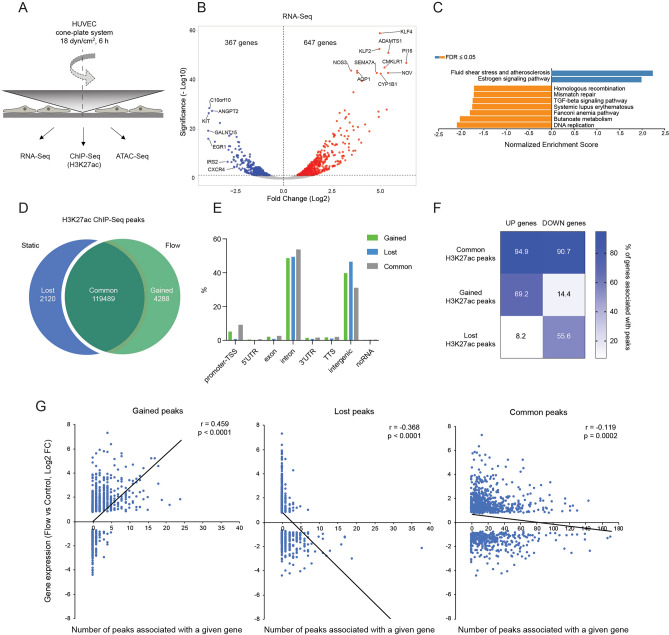
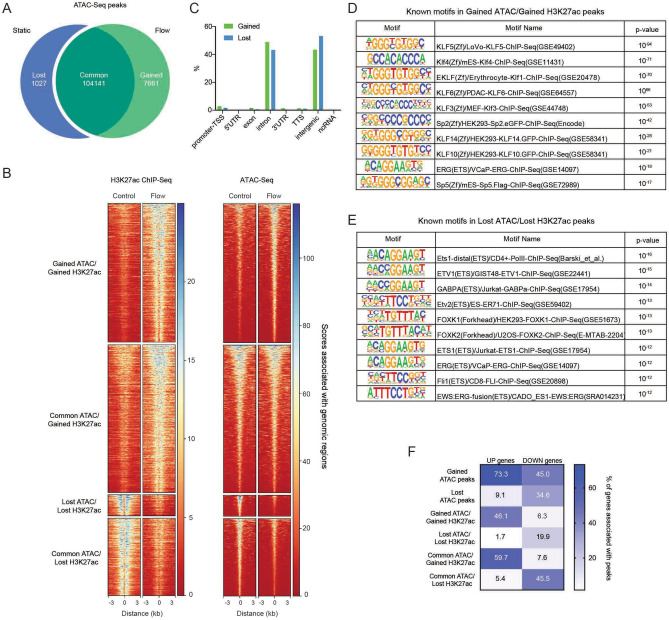
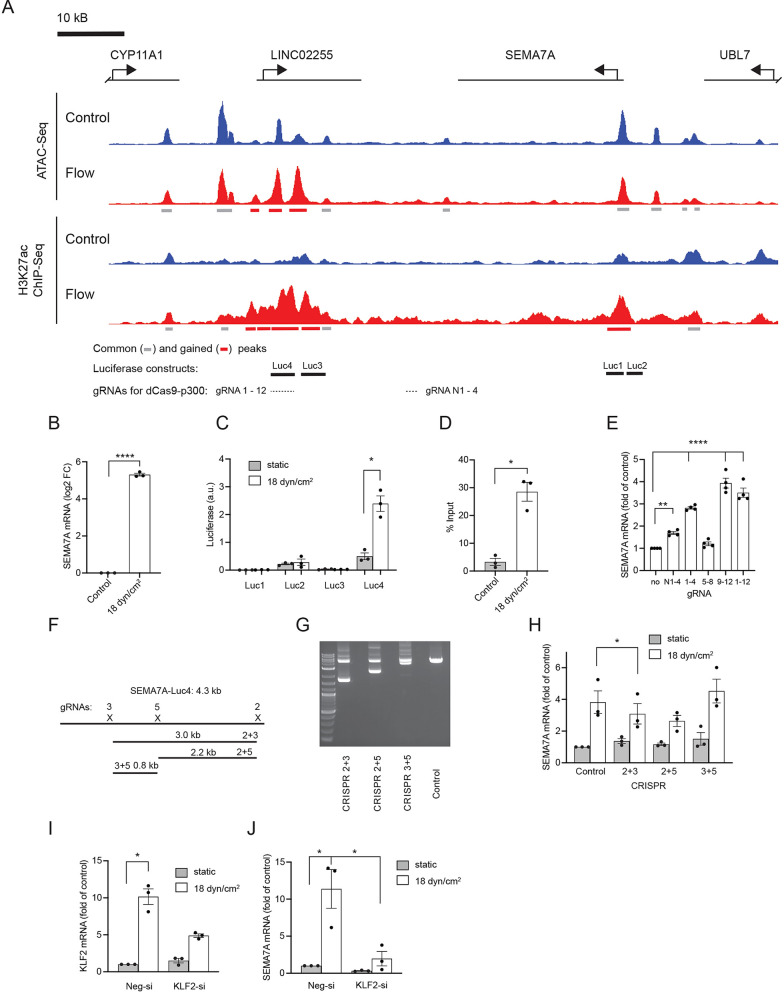
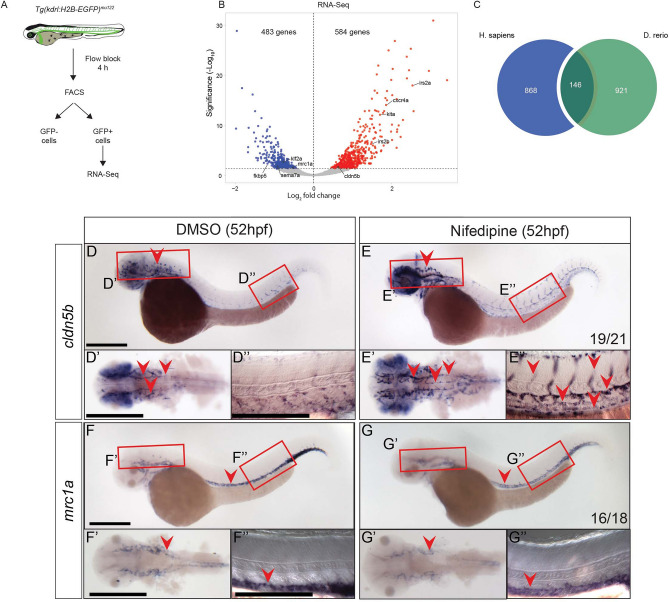
Endothelial cells (ECs) lining blood vessels are exposed to mechanical forces, such as shear stress. These forces control many aspects of EC biology, including vascular tone, cell migration and proliferation. Despite a good understanding of the genes responding to shear stress, our insight into the transcriptional regulation of these genes is much more limited. Here, we set out to study alterations in the chromatin landscape of human umbilical vein endothelial cells (HUVEC) exposed to laminar shear stress. To do so, we performed ChIP-Seq for H3K27 acetylation, indicative of active enhancer elements and ATAC-Seq to mark regions of open chromatin in addition to RNA-Seq on HUVEC exposed to 6 h of laminar shear stress. Our results show a correlation of gained and lost enhancers with up and downregulated genes, respectively. DNA motif analysis revealed an over-representation of KLF transcription factor (TF) binding sites in gained enhancers, while lost enhancers contained more ETV/ETS motifs. We validated a subset of flow responsive enhancers using luciferase-based reporter constructs and CRISPR-Cas9 mediated genome editing. Lastly, we characterized the shear stress response in ECs of zebrafish embryos using RNA-Seq. Our results lay the groundwork for the exploration of shear stress responsive elements in controlling EC biology.


Conflict of interest statement

The authors declare no competing interests.

Figures

Figure 1
Figure 1
Shear stress regulates the expression of a defined set of genes that correlates with enhancer activation. (A) HUVEC exposed to unidirectional shear stress (18 dyn/cm2) for 6 h were used for RNA-Seq, ATAC-Seq and H3K27ac ChIP-Seq. (B) Volcano plot showing gene expression changes in HUVEC under shear stress. Differentially expressed (DE) genes (FDR < 0.05) are labelled in red (upregulated) and blue (downregulated under shear stress). (C) Gene Set Enrichment Analysis (GSEA) of KEGG pathways regulated in the RNA-Seq dataset. (D) The number of H3K27ac ChIP-Seq peaks in HUVEC under static conditions (“lost” after shear stress) or exposed to shear stress (“gained” after shear stress) and the peaks “common” for both conditions. (E) Annotation of gained, lost and common H3K27ac peaks to defined regions of the genome. (F) Heatmap representing the spatial association of the genes up- or down-regulated by shear stress with identified common, gained or lost H3K27ac ChIP-Seq peaks. Numbers represent the percentage of up-or down-regulated genes, associated with at least one peak. (G) Comparison of gene expression (log2 fold change (FC) from RNA-Seq) to the number of gained, lost or common H3K27ac peaks spatially associated with a particular gene. Pearson correlation coefficient (r) and p-value of the correlation are shown.
Figure 2
Figure 2
ATAC-Seq identifies DNA motifs that associate with shear stress responsive enhancers. (A) Number of ATAC-Seq peaks specific for HUVEC under static conditions (“lost” after shear stress) or exposed to shear stress (“gained” after shear stress), as well as “common” for both conditions. (B) Heatmap representing scores associated with genomic regions centered on the indicated H3K27ac- and ATAC-Seq peaks in control and flow (18 dyn/cm2 shear stress for 6 h) conditions. (C) Annotation of gained and lost ATAC-Seq peaks that overlap with gained and lost H3K27ac ChIP-Seq peaks, respectively, to defined regions of the genome. (D,E) Analysis of known DNA motifs enriched in gained (D) or lost (E) ATAC-Seq peaks that overlap with gained or lost H3K27ac ChIP-Seq peaks, respectively. The 10 most enriched motifs are shown. (F) Heatmap representing spatial association of genes up- or down-regulated by shear stress with different subsets of ATAC-Seq peaks (all gained and lost ATAC-Seq peaks, gained and lost ATAC-Seq peaks that overlap with gained or lost H3K27ac ChIP-Seq peaks, respectively, or common ATAC-Seq peaks that overlap with gained or lost H3K27ac ChIP-Seq peaks). The numbers represent the percentage of up-or down-regulated genes, associated with at least one peak.
Figure 3
Figure 3
Identification and characterization of a shear stress responsive enhancer in the SEMA7A gene. (A) Normalized ATAC-Seq and H3K27ac ChIP-Seq tracks in the vicinity of the SEMA7A gene. Bars below ATAC and ChIP-Seq tracks show identified common (grey) and gained (red) ATAC-Seq or H3K27ac ChIP-Seq peaks. In addition, the regions used for luciferase constructs in (C) and locations targeted by gRNAs in (E) are shown underneath the tracks. (B) SEMA7A mRNA expression in HUVEC exposed to 18 dyn/cm2 for 6 h (Log2 fold of control, mean ± sem, n = 3, ****p < 0.001, two-tailed paired t-test). (C) Luciferase assay showing luciferase activity of the constructs containing DNA regions indicated in (A) upstream of firefly luciferase in HUVEC exposed to shear stress (18 dyn/cm2 for 24 h, data are presented in arbitrary units (a.u.) after normalization to the signal of a renilla luciferase construct; mean ± sem, n = 3, *p < 0.05, two-tailed paired t-test). (D) ChIP-qPCR showing higher H3K27ac ChIP-Seq enrichment in the region corresponding to Luc4 (see (A) in HUVEC exposed to shear stress (18 dyn/cm2 for 6 h, data is presented as % input, mean ± sem, n = 3, *p < 0.05, two-tailed paired t-test). (E) SEMA7A mRNA expression in HEK293T17 cells transfected with plasmids encoding dCas9-p300 and different gRNAs (combination of 4 or 12 gRNAs) targeting genomic regions downstream of the SEMA7A gene (marked in (A); data is shown as fold of control, mean ± sem, n = 4, ****p < 0.0001, **p < 0.01, one-way ANOVA with Dunnet’s multiple comparison test). (F) Schematic representation of the genomic region corresponding to the Luc4 construct with pairs of CRISPR/Cas9 constructs designed to remove parts of the region. (G) Ethidium bromide gel showing PCR products of the genomic region corresponding to the Luc4 construct. Shorter PCR products result from the removal of targeted genomic regions. Uncropped agarose gel is shown in Suppl. Fig. 10. (H) SEMA7A mRNA expression in HUVEC infected with lentiviral constructs encoding Cas9 and gRNAs targeting genomic regions downstream of the SEMA7A gene and exposed to shear stress (18 dyn/cm2 for 6 h, data is shown as fold of control, mean ± sem, n = 3, * p < 0.05, repeated measures one-way ANOVA with Dunnet’s multiple comparison test). (I,J) KLF2 (I) and SEMA7A (J) mRNA expression in HUVEC transfected with KLF2 or control siRNA (Neg-si) and exposed to shear stress (18 dyn/cm2 for 6 h, data are presented as fold of control, mean ± sem, n = 3, *p < 0.05, one-way ANOVA with Tukey’s multiple comparison test).
Figure 4
Figure 4
Blocking blood flow in zebrafish reveals genes regulated by shear stress in developing embryos. (A) Schematic representation of EC FACS sorting from Tg(kdrl:H2B-EGFP)mu122 embryos treated with nifedipine for 4 h at 48 hpf to induce flow block. Sorted GFP + cells were used for RNA-Seq. As control, embryos were treated with a corresponding amount of DMSO. (B) Volcano plot showing gene expression changes in ECs after flow block in zebrafish embryos. Differentially expressed (DE) genes (FDR < 0.05) are labelled in red (upregulated) and blue (downregulated after flow block). (C) Overlap of flow-regulated genes in human and zebrafish datasets. All DE genes were used for this analysis. (D,E) Whole mount in situ hybridization for cldn5b in 52 hpf embryos after 4 h of treatment with DMSO (D) or nifedipine (E). Regions in the head and the trunk highlighted with red boxes in (D,E) are magnified in (D′,E′,D′′,E′′), respectively. Vascular expression is highlighted with red arrowheads. (F,G) Whole mount in situ hybridization for mrc1a after flow block from 48 to 52 hpf. Regions in the head and the trunk highlighted with red boxes in (F,G) are magnified in (F′,G′,F′′,G′′), respectively. Vascular expression is highlighted with red arrowheads. Numbers represent the number of embryos with the depicted expression pattern out of the total number of embryos analyzed. Scale bar is 300 μm.

References

    1. Yin J, Heutschi D, Belting HG, Affolter M. Building the complex architectures of vascular networks: Where to branch, where to connect and where to remodel? Curr. Top. Dev. Biol. 2021;143:281–297. - PubMed
    1. Hahn C, Schwartz MA. Mechanotransduction in vascular physiology and atherogenesis. Nat. Rev. Mol. Cell Biol. 2009;10:53–62. - PMC - PubMed
    1. Ghaffari S, Leask RL, Jones EA. Flow dynamics control the location of sprouting and direct elongation during developmental angiogenesis. Development. 2015;142:4151–4157. - PubMed
    1. Dekker RJ, Boon RA, Rondaij MG, Kragt A, Volger OL, Elderkamp YW, Meijers JC, Voorberg J, Pannekoek H, Horrevoets AJ. KLF2 provokes a gene expression pattern that establishes functional quiescent differentiation of the endothelium. Blood. 2006;107:4354–4363. - PubMed
    1. Nakajima H, Mochizuki N. Flow pattern-dependent endothelial cell responses through transcriptional regulation. Cell Cycle. 2017;16:1893–1901. - PMC - PubMed

Publication types