

Metabarcoding analysis of the soil fungal community to aid the conservation of underexplored church forests in Ethiopia
- PMID: 35314738
- PMCID: PMC8938458
- DOI: 10.1038/s41598-022-08828-3
Metabarcoding analysis of the soil fungal community to aid the conservation of underexplored church forests in Ethiopia
Abstract
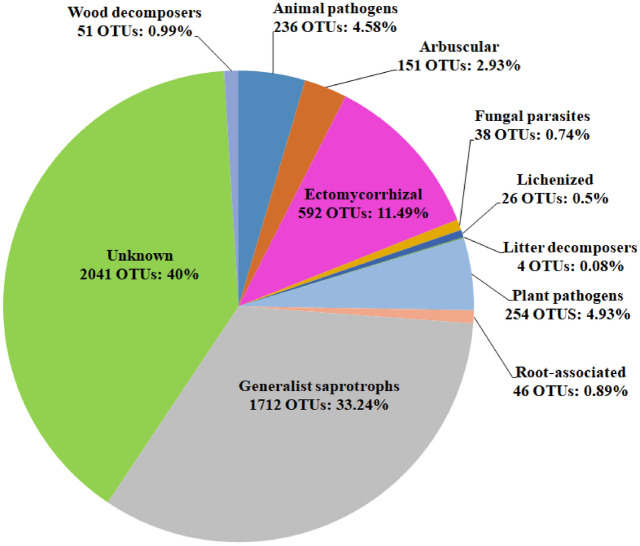
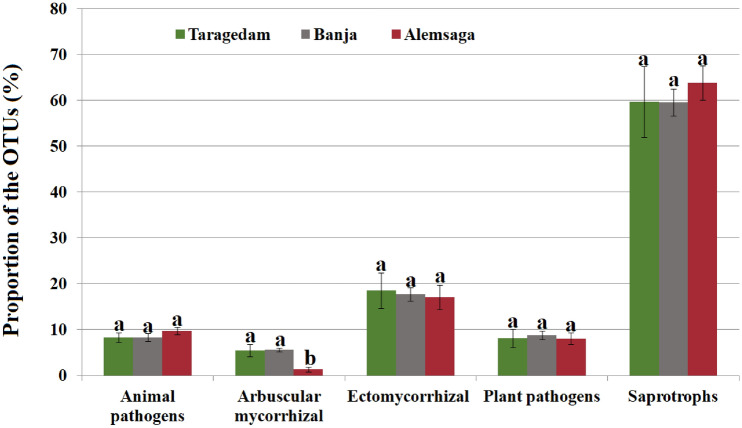
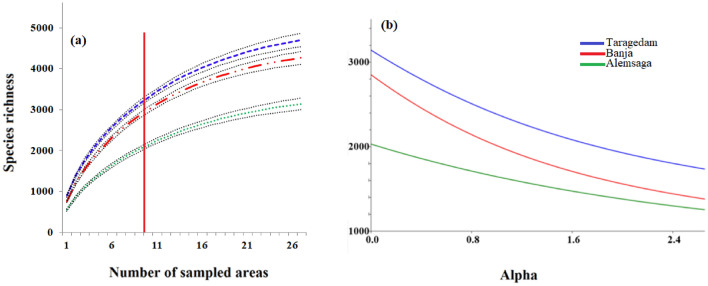
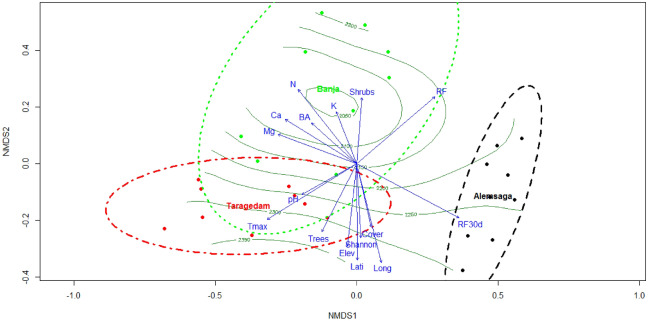
Most of the Dry Afromontane forests in the northern part of Ethiopia are located around church territories and, hence, are called church forests. These forests are biodiversity islands and provide key ecosystem services to local communities. A previous study of church forest fungal species was based on sporocarp collections. However, to obtain a complete picture of the fungal community, the total fungal community present in the soil needs to be analyzed. This information is important to integrate church forests into global biodiversity conservation strategies and to understand what actions are required to conserve church forests and their biological components, including fungi, which are known for their exceptionally high diversity levels. We assessed soil fungal communities in three church forests using ITS2 rDNA metabarcoding. In total, 5152 fungal operational taxonomic units representing 16 fungal phyla were identified. Saprotrophs followed by ectomycorrhizal fungi and animal pathogens dominated fungal communities. Significant differences in diversity and richness were observed between forests. Non-metric multidimensional scaling confirmed that fungal community composition differed in each forest. The composition was influenced by climatic, edaphic, vegetation, and spatial variables. Linear relationships were found between tree basal area and the abundance of total fungi and trophic groups. Forest management strategies that consider cover, tree density, enrichment plantations of indigenous host tree species, and environmental factors would offer suitable habitats for fungal diversity, production, and function in these forest systems. The application of the baseline information obtained in this study could assist other countries with similar forest conservation issues due to deforestation and forest fragmentation.
© 2022. The Author(s).
Conflict of interest statement
The authors declare no competing interests.
Figures
Similar articles
-
Uneven-aged and even-aged forest management shape the soil fungal community composition in a boreal Norway spruce (Picea abies Karst) forest.Sci Total Environ. 2025 Feb 15;965:178648. doi: 10.1016/j.scitotenv.2025.178648. Epub 2025 Feb 1. Sci Total Environ. 2025. PMID: 39893812
-
Ectomycorrhizal Fungal Communities in Urban Parks Are Similar to Those in Natural Forests but Shaped by Vegetation and Park Age.Appl Environ Microbiol. 2017 Nov 16;83(23):e01797-17. doi: 10.1128/AEM.01797-17. Print 2017 Dec 1. Appl Environ Microbiol. 2017. PMID: 28970220 Free PMC article.
-
Compartment and Plant Identity Shape Tree Mycobiome in a Subtropical Forest.Microbiol Spectr. 2022 Aug 31;10(4):e0134722. doi: 10.1128/spectrum.01347-22. Epub 2022 Jul 12. Microbiol Spectr. 2022. PMID: 35863008 Free PMC article.
-
Advanced research tools for fungal diversity and its impact on forest ecosystem.Environ Sci Pollut Res Int. 2022 Jun;29(30):45044-45062. doi: 10.1007/s11356-022-20317-8. Epub 2022 Apr 23. Environ Sci Pollut Res Int. 2022. PMID: 35460003 Review.
-
The biogeography and conservation of Earth's 'dark' ectomycorrhizal fungi.Curr Biol. 2025 Jun 9;35(11):R563-R574. doi: 10.1016/j.cub.2025.03.079. Curr Biol. 2025. PMID: 40494311 Review.
Cited by
-
New-Generation Sequencing Technology in Diagnosis of Fungal Plant Pathogens: A Dream Comes True?J Fungi (Basel). 2022 Jul 16;8(7):737. doi: 10.3390/jof8070737. J Fungi (Basel). 2022. PMID: 35887492 Free PMC article. Review.
-
How Deep Can the Endophytic Mycobiome Go? A Case Study on Six Woody Species from the Brazilian Cerrado.J Fungi (Basel). 2023 Apr 25;9(5):508. doi: 10.3390/jof9050508. J Fungi (Basel). 2023. PMID: 37233219 Free PMC article.
References
-
- Balami S, Vašutová M, Godbold D, Kotas P, Cudlín P. Soil fungal communities across land use types. Forest Biogeosci. For. 2020;13:548–558.
-
- Deacon J. Fungal Biology. Wiley; 2009.
-
- Moore JC, et al. Detritus, trophic dynamics and biodiversity. Ecol. Lett. 2004;7:584–600.
-
- Egli S. Mycorrhizal mushroom diversity and productivity—an indicator of forest health? Ann. For. Sci. 2011;68:81–88.
Publication types
MeSH terms
Substances
LinkOut - more resources
Full Text Sources
