. 2022 Apr;7(4):542-555.
doi: 10.1038/s41564-022-01072-5. Epub 2022 Mar 21.

Microbial communities form rich extracellular metabolomes that foster metabolic interactions and promote drug tolerance

Affiliations

Microbial communities form rich extracellular metabolomes that foster metabolic interactions and promote drug tolerance

Jason S L Yu et al. Nat Microbiol. 2022 Apr.

Abstract

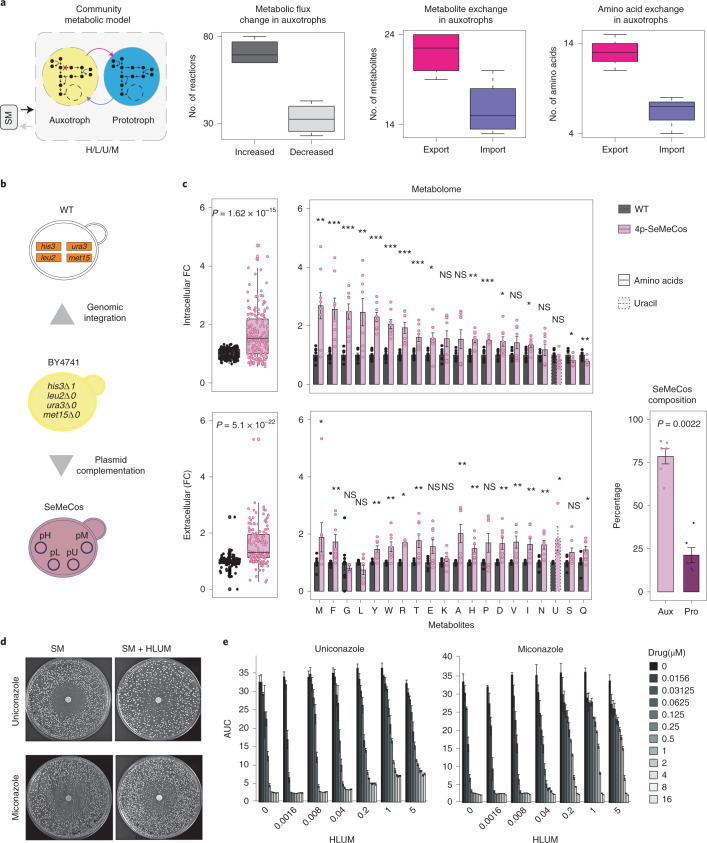
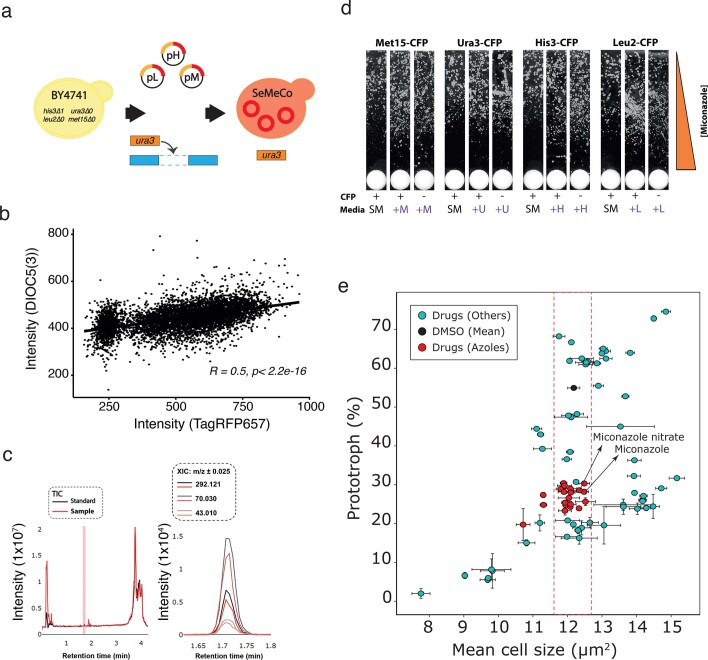
Microbial communities are composed of cells of varying metabolic capacity, and regularly include auxotrophs that lack essential metabolic pathways. Through analysis of auxotrophs for amino acid biosynthesis pathways in microbiome data derived from >12,000 natural microbial communities obtained as part of the Earth Microbiome Project (EMP), and study of auxotrophic-prototrophic interactions in self-establishing metabolically cooperating yeast communities (SeMeCos), we reveal a metabolically imprinted mechanism that links the presence of auxotrophs to an increase in metabolic interactions and gains in antimicrobial drug tolerance. As a consequence of the metabolic adaptations necessary to uptake specific metabolites, auxotrophs obtain altered metabolic flux distributions, export more metabolites and, in this way, enrich community environments in metabolites. Moreover, increased efflux activities reduce intracellular drug concentrations, allowing cells to grow in the presence of drug levels above minimal inhibitory concentrations. For example, we show that the antifungal action of azoles is greatly diminished in yeast cells that uptake metabolites from a metabolically enriched environment. Our results hence provide a mechanism that explains why cells are more robust to drug exposure when they interact metabolically.


Conflict of interest statement

K.C. is employed by AstraZeneca. The other authors declare no competing interests.

Figures

Fig. 1
Fig. 1. Auxotrophs are prevalent in host-associated microbial communities and are more drug resilient.
a, Frequency of amino acid auxotrophic species in <12,000 microbial communities sequenced in the EMP,. Dotted line represents an auxotroph/prototroph (A:P) ratio of 1:1 in a given microbial community. b, Number of amino acid auxotrophies detected in 15/40 gut microbial species exposed to 1,197 bioactive drugs. c, Growth, represented by AUC, between prototrophs and auxotrophs in drug-exposed microbiome species. Microbe–drug pairs are binned according to strong (AUC > 0.2), weak (0.9 > AUC > 0.2) and no effect (AUC > 0.9) on growth across 40 drug-exposed microbial species. d, SeMeCos, a yeast-based, isogenic model for study of auxotrophic subpopulations. e, Top, bottom left: SeMeCo colonies exposed to 900 FDA-approved drugs. PCA of z-scores assessing their impact on community composition. Hierarchical clustering identified two drug clusters (yellow and gray) affecting the A:P ratio. Arrows indicate variance driven by auxotrophic subpopulations. Bottom right: subset of gut microbiome AUC values for strong azoles identified by PCA. Significance was determined using a two-sided Wilcoxon rank-sum test, P = 5 × 10–4. f, A:P ratio within drug-treated SeMeCos based on highest z-scores. Classification of these drugs is based on known target/activity (sunburst plot). g, Composition analysis of SeMeCos treated with azoles/statins not present in e. Changes in A:P ratio are highlighted in red and blue.. Data are the median of n = 3 technical replicates within one independent experiment. Clustering based on subtraction of Pearson’s correlation from 1. h, Proportion of prototrophic and auxotrophic subpopulations following drug treatment. Data are median ± s.d. from 12 or 26 independent measurements for drug or DMSO, respectively, across two biologically independent experiments. Significance determined using two-sided Student’s t-test; *P < 0.05, **P < 0.005, ****P < 0.00005. Boxplots represent median (50% quantile (middle line)), lower (25%) and upper (75%) quantiles respectively). For c and e, significance was determined using Wilcoxon rank-sum test: *P < 0.05, **P < 0.005, ****P < 0.00005. Exact P values are available in Source Data 1. NS, not significant. Source data
Fig. 2
Fig. 2. Auxotrophs promote a rich metabolic environment that increases drug tolerance in prototrophs.
a, Left: genome-scale metabolic modeling in SeMeCos composed of auxotrophic and prototrophic subpopulations (n = 4, H/L/U/M community models). Significant increase (change >10%) in the number of metabolic fluxes (second from left, P = 7 × 10–4, metabolite exchange (second from right, P = 0.02) and exchange of amino acids (right, P = 0.002) in auxotrophs compared to prototrophs, shown as boxplots. Significance was calculated by two-sided Student’s t-test. b, Prototrophic community generated by genomic repair of HIS3, LEU2, URA3 and MET15 (WT), as opposed to SeMeCos containing auxotrophs due to the stochastic segregation of plasmids containing the four auxotrophic markers. c, Left, middle: quantification of intra- and extracellular metabolites by mass spectroscopy in exponentially growing SeMeCos compared to WT cultures in SM medium. Metabolite concentrations were normalized to biomass, as assessed by optical density at OD600. Grouped metabolite comparison (box plots) significance was determined using a one-sided Kruskal–Wallis rank-sum test. Mean ± s.e.m. of n = 8 independent cultures per strain from two independent experiments. Individual metabolite comparison (bar plots) significance was determined using an unpaired two-sided Wilcoxon rank-sum test: *P < 0.05, **P < 0.005, ***P < 0.0005, ****P < 0.00005; exact P values are given in Source data 2. Right: proportion of auxotrophs and prototrophs in SeMeCos analyzed above, calculated by spotting colonies onto selective medium. Mean ± s.e.m. of n = 6 independent cultures from two independent experiments. d, Drug resistance (diameter of inhibition halo) and tolerance (growth within halo) measured by DDA in WT colonies in minimal (SM) or SM + HLUM-supplemented medium treated with uniconazole or miconazole, respectively. DDAs generated from WT cultures plated onto SM or SM + HLUM and/or azoles. One DDA per drug is illustrated. e, Growth of WT yeast cultures, assessed by OD600 and plotted as AUC, under increasing concentrations of uniconazole/miconazole and following increasing HLUM supplementation. Boxplots represent median (50% quantile (middle line)), lower (25%) and upper (75%) quantiles, respectively, of change in metabolic flux and amino acid and metabolite exchanges in auxotrophs compared to prototrophs in a, and pooled metabolite FC levels compared to WT in c. Source data
Fig. 3
Fig. 3. The prototroph proteome responds to the presence of auxotrophs.
a, Schematic representation of auxotrophic SeMeCos strains where prototrophy is restored genomically, and in which the indicated plasmids are marked with CFP. Prototrophic and auxotrophic populations were sorted according to CFP expression. b, Proteomic analysis of sorted auxotrophic versus prototrophic cells in SeMeCos; n = 16 independent sorting experiments (n = 4 independent experiments for each of the auxotrophic SeMeCos strains), with differentially expressed proteins (DEP) illustrated as volcano plots. c, Top left: proteomic analysis of auxotrophs relative to cogrowing prototrophs in SeMeCos. Top right: summary of differentially expressed proteins and metabolic enzymes participating in amino acid biosynthesis; n = 16, whereby four bioreplicates of each of the four auxotrophic populations are compared to each other. Comparisons were made exclusively between proteins significantly differentially expressed in b where P < 0.05. Bottom: differential expression (log2 FC) of metabolic enzymes in auxotrophs relative to prototrophs in SeMeCos, mapped to the yeast metabolic network using iPATH3 (ref. ); n = 4. d, Top left: proteomic analysis of prototrophic cells isolated from SeMeCos relative to prototrophs grown on their own. Top right: summary of differentially expressed proteins and metabolic enzymes in amino acid biosynthesis; n = 16, whereby four bioreplicates of each of the four prototrophic populations in SeMeCos and in WT communities were compared with each other. Comparisons were made exclusively between proteins significantly differentially expressed in b where P < 0.05. Bottom: differential protein expression (log2 FC) of enzymes in prototrophic cells cogrowing with auxotrophs (in SeMeCos) and metabolic enzyme expression relative to prototrophic cells cogrowing in WT communities mapped to the yeast metabolic network using iPATH3 (ref. ); n = 4. c,d, Boxplots represent median (50% quantile (middle line) and lower and upper quantiles (lower (25% quantile) and upper (75% quantile), respectively) for the number of differentially expressed proteins. A protein is considered DEP when P < 0.05 (moderated t-test, two-sided) and log FC <0 or >0, downregulated or upregulated, respectively. Abs, absolute. Source data
Fig. 4
Fig. 4. Increased metabolite export activity in auxotrophic cells promotes drug tolerance.
a, SeMeCos cultures were incubated with DiOC5(3), and flow cytometry was used to assess fluorescent populations as described. Prototrophs, single and double auxotrophs (red gradient) and triple-auxotrophic (yellow) populations in SeMeCos were gated by TagRFP657 fluorescence. Gaussian curve fitting and cluster assignment via mclust identified subpopulations carrying different levels of auxotrophy. Prototrophic populations proportionally retain, on average, greater dye fluorescence, indicating a slower export of DiOC5(3). n = 20,000 cells from a single culture, of which 6,330 live cells were taken for downstream analysis. H, L and M indicate auxotrophy for histidine, leucine and methionine, respectively; PRO, prototrophic subpopulation. b, SeMeCos cultures were incubated with DiOC5(3), fixed and analyzed via fluorescence microscopy. Prototrophs and auxotrophs were identified by fluorescence, with two populations corresponding to low and high dye retention identified. Boxplots represent median (50% quantile (middle line), lower (25%) and upper (75%) quantiles, respectively); n = total number of cells counted per population; med, median fluorescence intensity per cell. Data are from one independent experiment. c, Intracellular concentration of uniconazole in auxotrophic and prototrophic subpopulations as sorted from singly auxotrophic SeMeCos, and measured by LC–MS/MS. Mean ± s.d. from a single injection from n = 3 biological replicates. Statistical significance was determined using a two-sided Student’s t-test, ****P < 0.00005. Exact P values are available in Source Data 4. d, Plating of auxotrophic and prototrophic subpopulations from sorted single auxotrophic SeMeCos onto SM or SM-supplemented medium with the complementary amino acids (+H/L/U/M) permitted titration of A:P ratios. Cropped DDA denoted by red-bounded region. e, DDA for the four sorted SeMeCos strains exposed to uniconazole plated onto SM or SM + H/L/U/M. DDAs were generated from a single-sort experiment, plated and exposed to uniconazole. a.u., Arbitrary units. Source data
Extended Data Fig. 1
Extended Data Fig. 1. Auxotrophs are prevalent in drug-exposed natural and synthetic microbial communities and more drug resilient.
(a) Frequency of amino acid auxotrophies across gut microbiome species, using the procedures in. (b) Frequency of amino acid auxotrophies per gut microbiome auxotrophic species. (c) Growth, as measured by AUC, in drug exposed gut microbiome species across drug classes and metabolic background (auxotrophy vs prototrophy); n = number of drug-microbe pairs in each subset. (d) Screen setup, scoring and identification of drugs that modulate the auxotrophic composition in SeMeCos. Drug hits are identified by a high Z-score that indicates a significant shift in the SeMeCo composition compared to DMSO baseline. (e) Growth, as measured by AUC, in prototrophs and auxotrophs treated with drugs common to both the SeMeCo and gut microbiome drug screens, from Cluster 1 or 2 in the SeMeCo screen (e); n = number of drug-microbe pairs in each subset. (f) Flow cytometric analysis of the SeMeCo composition upon drug treatment, where red and blue indicate the relative increase or decrease, respectively, of a specific auxotrophic subpopulation (count of subpopulation/ total count). Median: n = 3 technical replicates within an independent experiment. Statistics by (c and f) two-sided Wilcoxon Rank Sum test, P-values are listed in the respective Source Data. Source data
Extended Data Fig. 2
Extended Data Fig. 2. Increased proportion of auxotrophic subpopulations in SeMeCos are independent of drug effects on plasmid segregation or stability.
(a) Drug disk diffusion assays of wild-type (WT) strains without plasmid or transformed with MitoLOC plasmid that encode for nourseothricin resistance (NAT) compared against the SeMeCo strain which carries 4 plasmids when exposed to uniconazole. (b) Disk diffusion assays of WT prototrophic strain compared against singly auxotrophic strains and quadruple auxotrophic parental strain when exposed to miconazole. SM indicated minimal media condition versus SM + HLUM whereby minimal media was supplemented with the 4 amino acids. Singly auxotrophic strains were supplemented with the respective amino acid to ensure their growth in the absence of genomic or plasmid complementation. Source data
Extended Data Fig. 3
Extended Data Fig. 3. Increased metabolic flux change with increasing number of auxotrophies per cell.
(a) Pair-wise FBA analysis assessing flux changes in communities composed of prototrophs and each of 15 auxotrophic subpopulations present in SeMeCos, relying on the exchanging of H, L, U and/or M. (b) Relative frequency of metabolic pathways with altered flux (flux change >10%) in the 15 different auxotrophs when interacting with a prototroph. (c) Pearson correlation between the proportion of metabolic pathways with altered flux (flux change >10%) and the total number of auxotrophies per cell. Error bands indicate the 95% confidence level interval for the predictions from the linear model. (d) Number of secreted metabolites in prototrophic (wild-type) and auxotrophic models in minimal media supplemented with required metabolites using FBA and MOMA simulation approaches. The MOMA predicts an increase in metabolite excretion in single-metabolite supplemented auxotrophic yeast strain, compared to an FBA analysis. Source data
Extended Data Fig. 4
Extended Data Fig. 4. Prototrophs present growth advantage relative to co-growing auxotrophs.
(a) pHLUM strain carrying a single plasmid complementing the 4 auxotrophies. Loss of the plasmid results in immediate reduction in production capacity for HLUM opposed to sequential loss in SeMeCos. (b) Competitive growth assay in which the pHLUM strain was co-cultured with the SeMeCo strain. Over 18 days, replated every 48 h, in 3 independent cultures (A, B and C), the pHLUM strain retaining full prototrophy, slowly outcompetes all SeMeCo derived subpopulations in terms of growth. Source data
Extended Data Fig. 5
Extended Data Fig. 5. Rich extracellular metabolic environments protect growth of prototrophic yeast against antifungals independently of growth rate.
(a) Drug response, as measured with a disk diffusion assay (DDA), in prototrophic yeast communities in synthetic minimal media (SM) supplemented with increasing concentrations of HLUM and treated with miconazole. DDAs were generated from wild-type cultures plated onto the respective media and then exposed to the azoles. Increasing HLUM supplementation reduced the inhibition zone (IZ) and increased cellular growth in the IZ in response to azole treatment. Data is n = 1 culture. b) Growth response to antifungals, as measured with a disk diffusion assay (DDA) in wild-type colonies in minimal (SM) media supplemented at different growth phases: initial exponential phase (OD600 = 0.5) and late exponential phase (OD600 = 1.5) treated with miconazole. Data are n = 1 wild-type culture. Source data
Extended Data Fig. 6
Extended Data Fig. 6. GO cluster representation in co-growing auxotrophs vs prototrophs.
GO cluster and Gene Set Enrichment Analysis (GSEA) using the proteomics data from the sorted auxotrophic and prototrophic subpopulations, derived from single-plasmid CFP SeMeCos. Data are from n = 16 independent SeMecos sorting experiments (n = 4 independent experiments for each single-plasmid complemented strains (pH-, pL-, pU- and pM-SeMeCos). P-values obtained from GSEA were used to calculate a simRel score, a functional similarity measure for comparing two GO terms with each other and projected onto two dimensional space (x and y-axes) derived by applying multidimensional scaling to a matrix of the GO terms’ semantic similarities that generates slimmed GO terms. Left and right columns indicate upregulated and downregulated proteins respectively in auxotrophs when compared to the corresponding prototroph. Significance threshold is defined as P < 0.05. Bubble colour indicates log10(P-value), with blue being highly significant and red being less significant. Bubble sizes indicate gene ratio, which is the frequency of representation of the GO term within the Uniprot database for S. cerevisiae. A larger circle would indicate a more general term compared with a smaller circle that indicates a more specific term. All plots were generated via REVIGO. Source data
Extended Data Fig. 7
Extended Data Fig. 7. Auxotrophs export more non-essential metabolites and generate a rich metabolic environment conducive for drug tolerance.
(a) Percentage change in expression of proteins involved in different amino acid biosynthetic pathways in the sorted histidine, leucine, uracil and methionine auxotrophs. Amino acid pathway annotations were taken as per the metabolic model, iMM904. (b) FBA analysis assessing amino acid exchange in auxotrophic versus protrophic subpopulations. The FBA analysis indicates that with the increased export of metabolites from auxotrophs, the degree of metabolite exchange within communal cells increases. Pink indicates export of metabolites from auxotrophs, blue indicates export of metabolites from prototrophs. (c) Qualitative analysis of concordance between fluxes (FBA analysis) and protein expression (proteomics analysis) in the auxotrophic versus prototrophic subpopulations. Source data
Extended Data Fig. 8
Extended Data Fig. 8. Prototrophs respond to the presence of auxotrophs and upregulate growth related processes.
GO slim term mapping, using SGD’s GO Slim Mapper tool, of differentially expressed proteins from the proteomics analysis as in Fig. 3d, when prototrophs grow in the presence (SeMeCo communities) or absence (wild-type communities) of auxotrophs. Source data
Extended Data Fig. 9
Extended Data Fig. 9. Expression of multidrug plasma membrane ABC transporters in auxotrophs and prototrophs for HLUM.
mRNA expression profiles for the ABC transporters PDR5, SNQ2, and YOR1 were obtained from RNASeq expression data of n = 3 exponentially grown cultures, of 16 strains (1 prototroph and 15 auxotrophs in all possible combinations of HLUM) at similar cell density (optical density at 600 nm (OD600) of 0.8), followed by mRNA sequencing. Analysis was performed either by (top) grouping prototrophs and auxotrophs normalised mRNA expression levels (box plots represent median (50% quantile (middle line) and lower and upper quantiles (lower (25% quantile) and upper (75% quantile); statistical significance was determined using a one-sided Kruskal-Wallis rank sum test) or (bottom) by each background strain (bar plots represent mean ± SEM of 3 independent cultures per strain, dots refer to individual cultures normalised mRNA abundance; statistical significance was determined using a two-sided Wilcoxon Rank Sum test, precise p-values are available in Source Data for Extended Data Fig. S9). The raw data (gene-wise read counts for gene expression estimation) was then processed using ‘DEseq2’ in R for normalization. Source data
Extended Data Fig. 10
Extended Data Fig. 10. Auxotrophy correlates with DIOC5(3) export and azole tolerance independent of cell size in SeMeCos.
(a) Construction of the 3-plasmid, TagRFP657 fluorescent SeMeCo strain. Auxotrophy was repaired in the parental BY4741 strain via plasmid complementation with pH, pL and pM (all encoding TagRFP657) and genomic knock-in of URA3. (b) Scatter plot of DIOC5(3) against TagRFP657 fluorescence intensity in 20,000 cells. Correlation was tested using a two-sided, Spearman’s Rank Correlation Coefficient (P value < 2.2e-16) with a R-value of 0.53 indicating a positive correlation. (c) Total ion chromatograms (TIC) and extracted ion chromatograms (XIC) corresponding to uniconazole in standard and cell pellet extracts from sorted cells. Peaks at <1 and ~4 min retention time correspond to highly hydrophilic and hydrophobic metabolites respectively. XIC at m/z of 292.121 was used to calculate concentration of uniconazole in extracts from a standard curve generated from the analytical standard (Sigma, 37044). Fragments at m/z 70.030 and 43.010 correspond to protonated triazole and loss of CNH thereof respectively. (d) DDA for all four sorted single-plasmid-CFP SeMeCos exposed to miconazole plated onto SM or SM + H/L/U/M. DDAs were generated from a single sort experiment and exposed to miconazole. (e) Summary of the changes in cell size against SeMeCo composition change as measured in the drug screen. Cell size was defined as the pixel area covered by a cell capture via high-throughput microscopy. DMSO (mean) indicates the global mean value from all DMSO treated wells. Drugs (Azoles) indicate azoles within the 900-FDA compounds collection, dotted lines indicate range of cell size changes for azole treated cells. Error bars indicate standard deviation of prototroph percentage or cell size from 3 biological replicates. Data are presented as mean values + /- SD. Source data

Comment in

  • Give and take in the exometabolome.
    Stindt KR, McClean MN. Stindt KR, et al. Nat Microbiol. 2022 Apr;7(4):484-485. doi: 10.1038/s41564-022-01081-4. Nat Microbiol. 2022. PMID: 35314782 No abstract available.
  • Metabolic interactions shape a community's phenotype.
    Melkonian C, Seidl MF, van der Hooft JJJ, de Vos MGJ. Melkonian C, et al. Trends Microbiol. 2022 Jul;30(7):609-611. doi: 10.1016/j.tim.2022.05.001. Epub 2022 May 24. Trends Microbiol. 2022. PMID: 35618541

Similar articles

Cited by

References

    1. Mee MT, Collins JJ, Church GM, Wang HH. Syntrophic exchange in synthetic microbial communities. Proc. Natl Acad. Sci. USA. 2014;111:E2149–E2156. - PMC - PubMed
    1. Wang Y-P, Li J-T, Qu J, Yin M, Lei Q-Y. Metabolite sensing and signaling in cancer. J. Biol. Chem. 2020;295:11938–11946. - PMC - PubMed
    1. Pinu FR, et al. Metabolite secretion in microorganisms: the theory of metabolic overflow put to the test. Metabolomics. 2018;14:43. - PubMed
    1. Douglas AE. The microbial exometabolome: ecological resource and architect of microbial communities. Philos. Trans. R. Soc. Lond. B Biol. Sci. 2020;375:20190250. - PMC - PubMed
    1. Blasche S, et al. Metabolic cooperation and spatiotemporal niche partitioning in a kefir microbial community. Nat. Microbiol. 2021;6:196–208. - PMC - PubMed

Publication types