

Contrasting genetic trajectories of endangered and expanding red fox populations in the western U.S
- PMID: 35314789
- PMCID: PMC9338314
- DOI: 10.1038/s41437-022-00522-4
Contrasting genetic trajectories of endangered and expanding red fox populations in the western U.S
Abstract
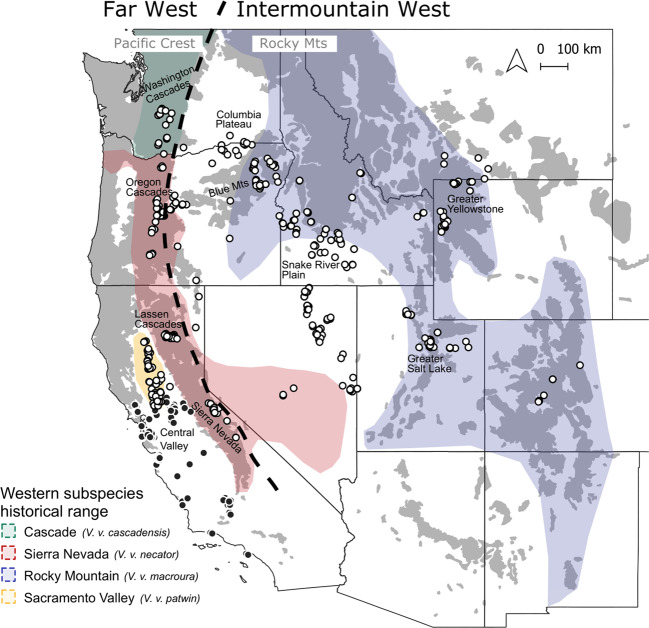
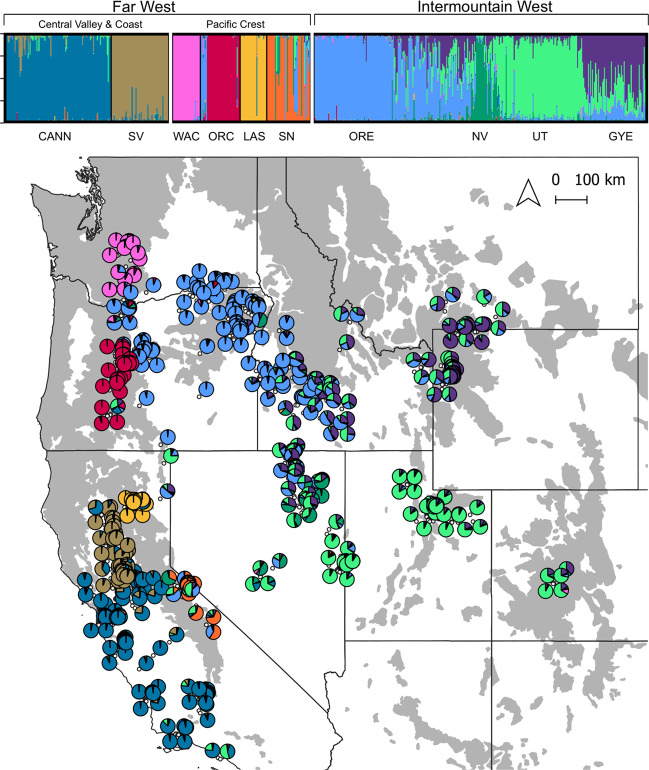
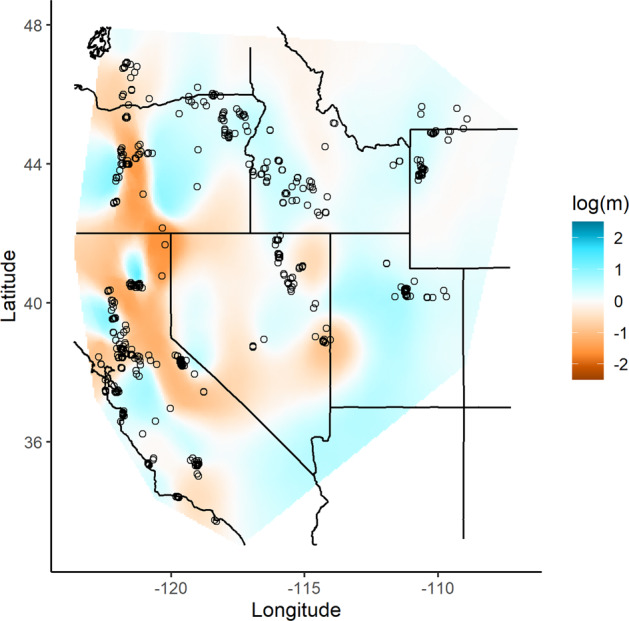
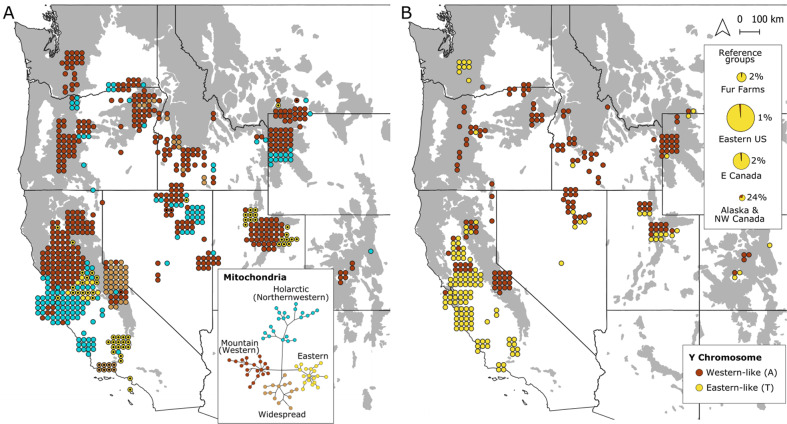
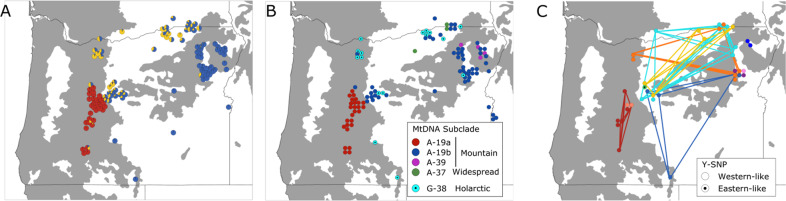
As anthropogenic disturbances continue to drive habitat loss and range contractions, the maintenance of evolutionary processes will increasingly require targeting measures to the population level, even for common and widespread species. Doing so requires detailed knowledge of population genetic structure, both to identify populations of conservation need and value, as well as to evaluate suitability of potential donor populations. We conducted a range-wide analysis of the genetic structure of red foxes in the contiguous western U.S., including a federally endangered distinct population segment of the Sierra Nevada subspecies, with the objectives of contextualizing field observations of relative scarcity in the Pacific mountains and increasing abundance in the cold desert basins of the Intermountain West. Using 31 autosomal microsatellites, along with mitochondrial and Y-chromosome markers, we found that populations of the Pacific mountains were isolated from one another and genetically depauperate (e.g., estimated Ne range = 3-9). In contrast, red foxes in the Intermountain regions showed relatively high connectivity and genetic diversity. Although most Intermountain red foxes carried indigenous western matrilines (78%) and patrilines (85%), the presence of nonindigenous haplotypes at lower elevations indicated admixture with fur-farm foxes and possibly expanding midcontinent populations as well. Our findings suggest that some Pacific mountain populations could likely benefit from increased connectivity (i.e., genetic rescue) but that nonnative admixture makes expanding populations in the Intermountain basins a non-ideal source. However, our results also suggest contact between Pacific mountain and Intermountain basin populations is likely to increase regardless, warranting consideration of risks and benefits of proactive measures to mitigate against unwanted effects of Intermountain gene flow.
© 2022. The Author(s).
Conflict of interest statement
The authors declare no competing interests.
Figures


Similar articles
-
Insight into the Genetic Population Structure of Wild Red Foxes in Poland Reveals Low Risk of Genetic Introgression from Escaped Farm Red Foxes.Genes (Basel). 2021 Apr 25;12(5):637. doi: 10.3390/genes12050637. Genes (Basel). 2021. PMID: 33922932 Free PMC article.
-
Y-Chromosome Markers for the Red Fox.J Hered. 2017 Sep 1;108(6):678-685. doi: 10.1093/jhered/esx066. J Hered. 2017. PMID: 28821189 Free PMC article.
-
Noninvasive Sampling Reveals Short-Term Genetic Rescue in an Insular Red Fox Population.J Hered. 2019 Aug 16;110(5):559-576. doi: 10.1093/jhered/esz024. J Hered. 2019. PMID: 31002340
-
Admixture analyses and phylogeographic relationships reveal complete genetic distinctiveness of Polish farm and wild red foxes (Vulpes vulpes) and the North American origin of farm-bred individuals.Anim Sci J. 2019 Jul;90(7):827-839. doi: 10.1111/asj.13223. Epub 2019 May 13. Anim Sci J. 2019. PMID: 31083798
-
A restricted hybrid zone between native and introduced red fox (Vulpes vulpes) populations suggests reproductive barriers and competitive exclusion.Mol Ecol. 2011 Jan;20(2):326-41. doi: 10.1111/j.1365-294X.2010.04943.x. Epub 2010 Dec 9. Mol Ecol. 2011. PMID: 21143330
Cited by
-
Missing history of a modern domesticate: Historical demographics and genetic diversity in farm-bred red fox populations.J Hered. 2024 Jul 10;115(4):411-423. doi: 10.1093/jhered/esae022. J Hered. 2024. PMID: 38624218 Free PMC article.
-
Assessing population structure and migration patterns of wild boar (Sus scrofa) in Japan.Sci Rep. 2023 Dec 1;13(1):21186. doi: 10.1038/s41598-023-48215-0. Sci Rep. 2023. PMID: 38040788 Free PMC article.
-
Describing Diet of Imperiled Sierra Nevada Red Foxes and a Carnivoran Competitor Using DNA Metabarcoding.Ecol Evol. 2025 Jun 30;15(7):e71605. doi: 10.1002/ece3.71605. eCollection 2025 Jul. Ecol Evol. 2025. PMID: 40599880 Free PMC article.
-
Whole Genomes Inform Genetic Rescue Strategy for Montane Red Foxes in North America.Mol Biol Evol. 2024 Sep 4;41(9):msae193. doi: 10.1093/molbev/msae193. Mol Biol Evol. 2024. PMID: 39288165 Free PMC article.
-
A hierarchical modeling approach to predict the distribution and density of Sierra Nevada Red Fox (Vulpes vulpes necator).J Mammal. 2023 May 15;104(4):820-832. doi: 10.1093/jmammal/gyad026. eCollection 2023 Aug 1. J Mammal. 2023. PMID: 37545667 Free PMC article.
References
-
- Akins JR, Aubry KB, Sacks BN. Genetic integrity, diversity, and population structure of the Cascade red fox. Conserv Genet. 2018;19:969–980. doi: 10.1007/s10592-018-1070-y. - DOI
-
- Allen SH, Sargeant AB (1993) Dispersal patterns of red foxes relative to population density. J Wildlife Manag 57(3):526–533
-
- Arbogast BS, Schumacher KI, Kerhoulas NJ, Bidlack AL, Cook JA, Kenagy GJ. Genetic data reveal a cryptic species of New World flying squirrel: Glaucomys oregonensis. J Mammal. 2017;98(4):1027–41. doi: 10.1093/jmammal/gyx055. - DOI
-
- Ashbrook FG (1928) Silver-Fox Farming. US Department of Agriculture. Washington D.C.
-
- Aubry KB. The recent history and present distribution of the red fox in Washington. Northwest Sci. 1984;58(1):69–79.
Publication types
MeSH terms
Substances
LinkOut - more resources
Full Text Sources
Research Materials
