. 2022 Jun;6(6):754-770.
doi: 10.1038/s41551-022-00862-w. Epub 2022 Mar 21.

Tether-free photothermal deep-brain stimulation in freely behaving mice via wide-field illumination in the near-infrared-II window

Affiliations

Tether-free photothermal deep-brain stimulation in freely behaving mice via wide-field illumination in the near-infrared-II window

Xiang Wu et al. Nat Biomed Eng. 2022 Jun.

Abstract

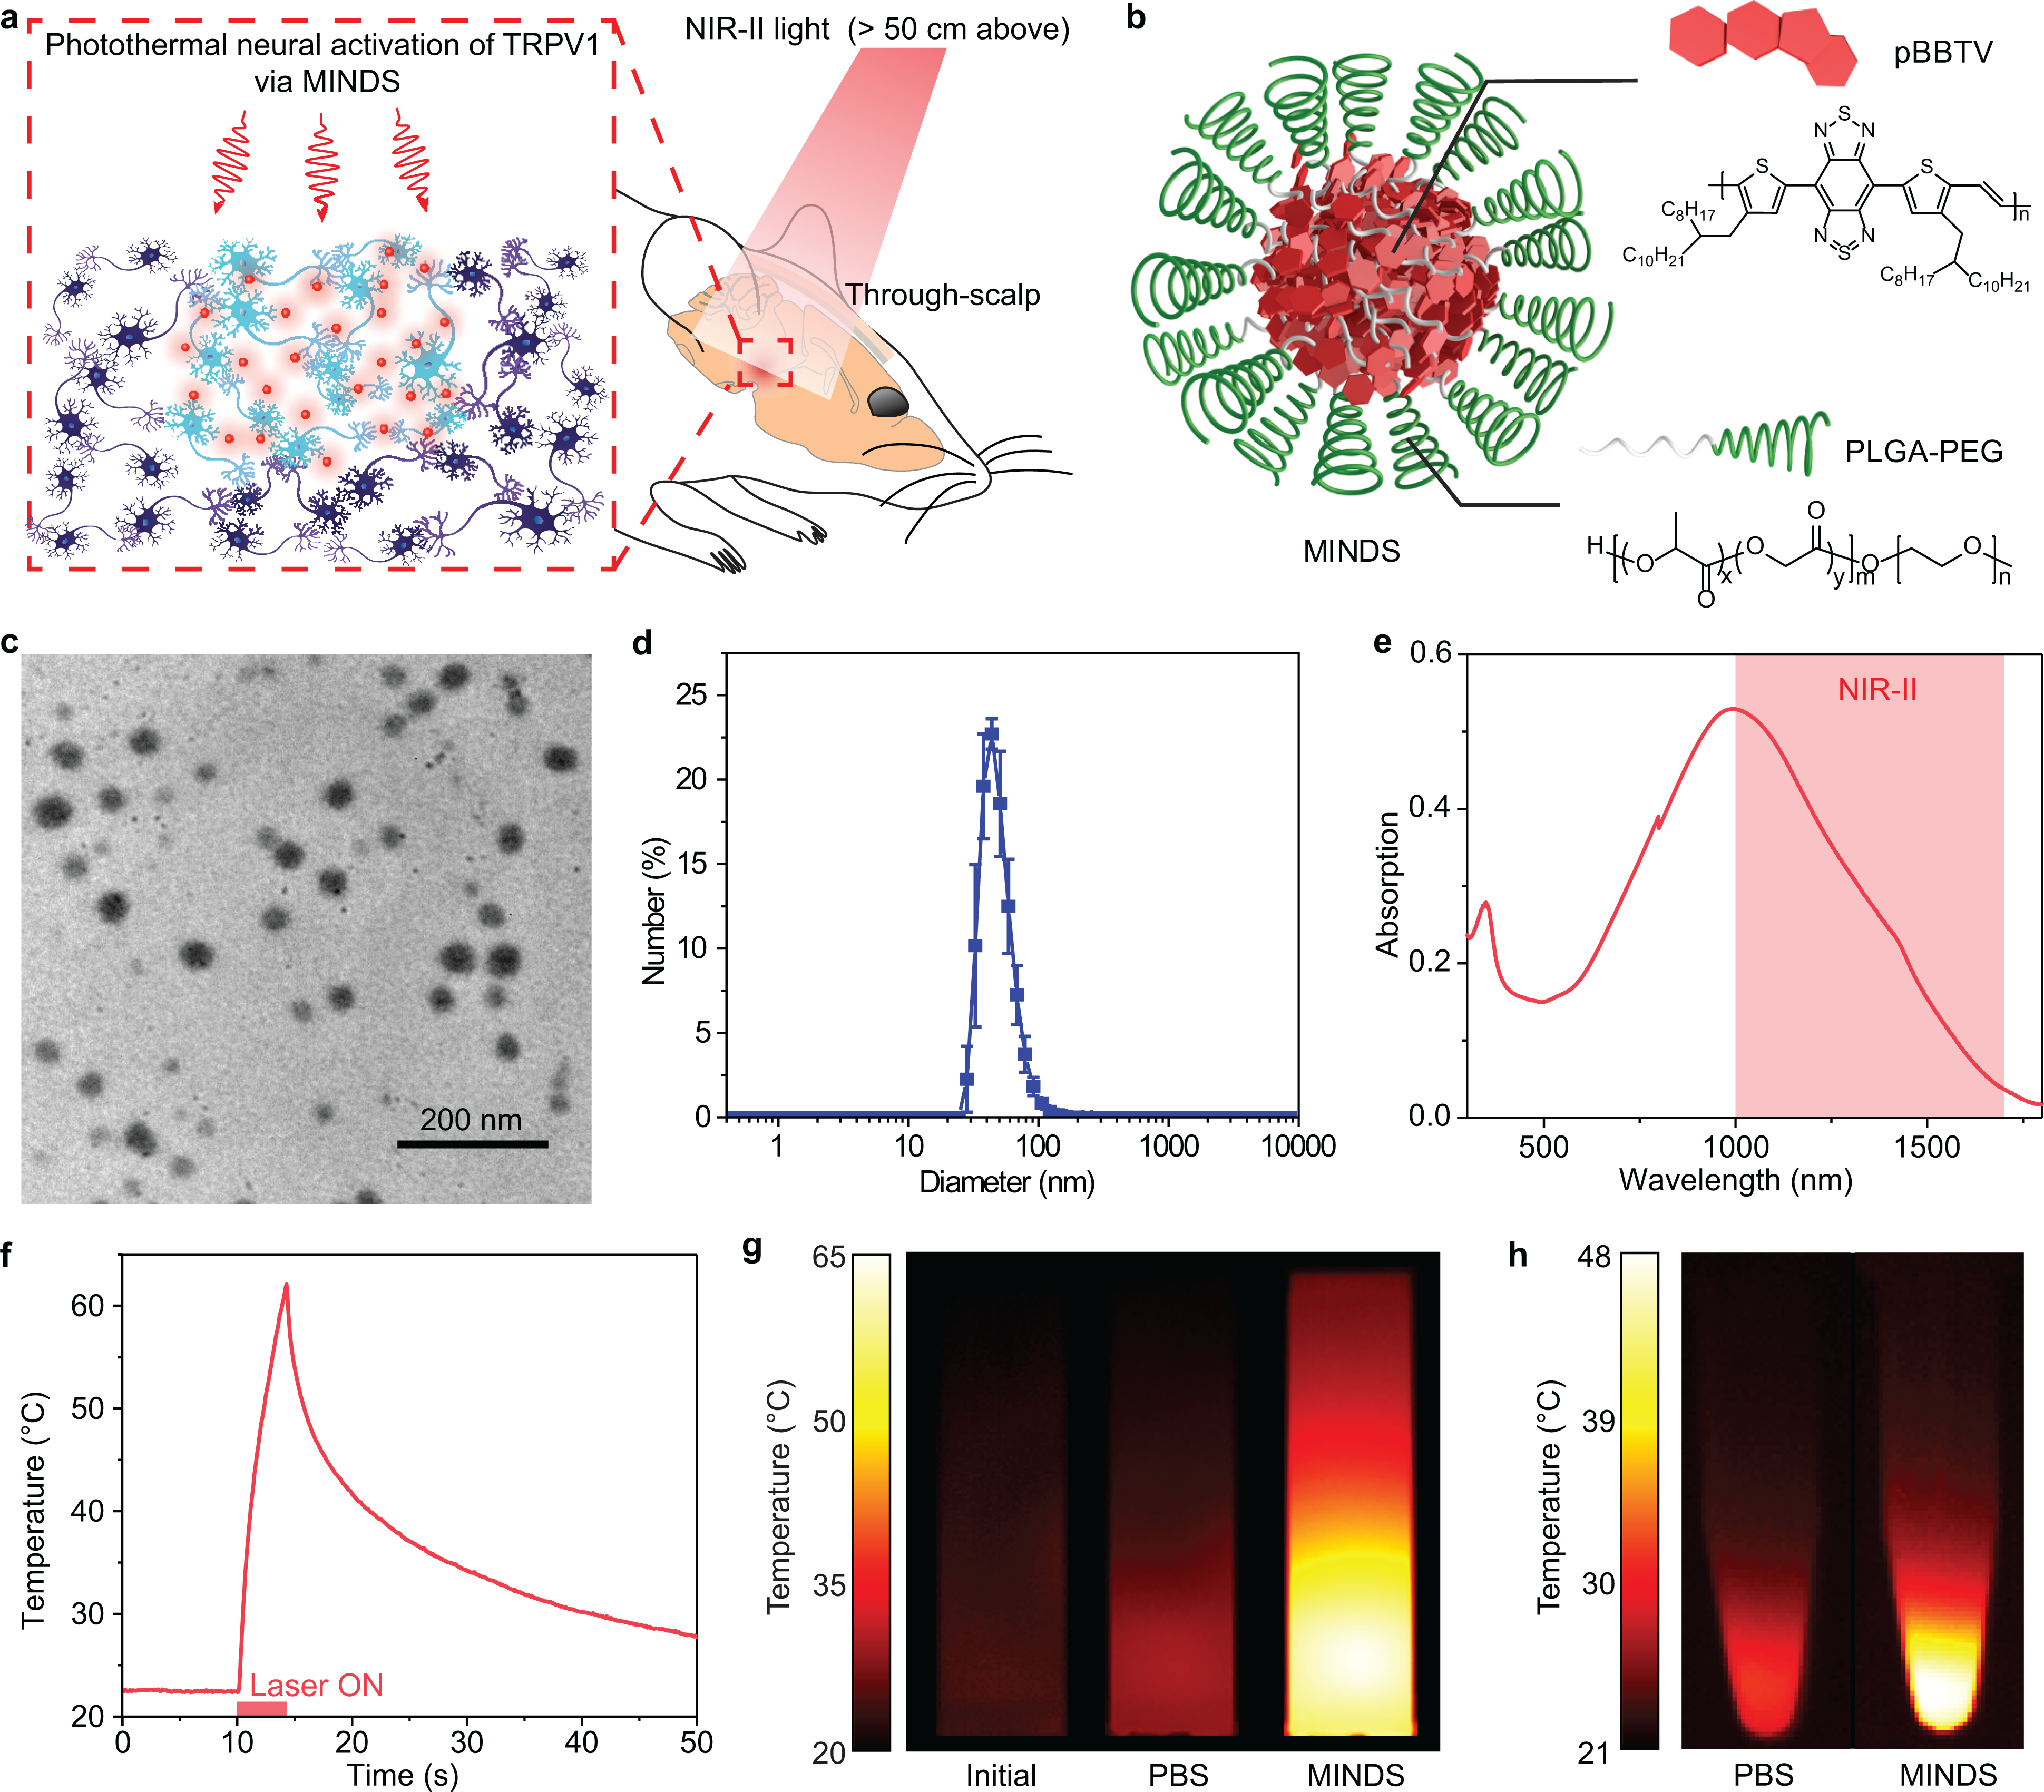
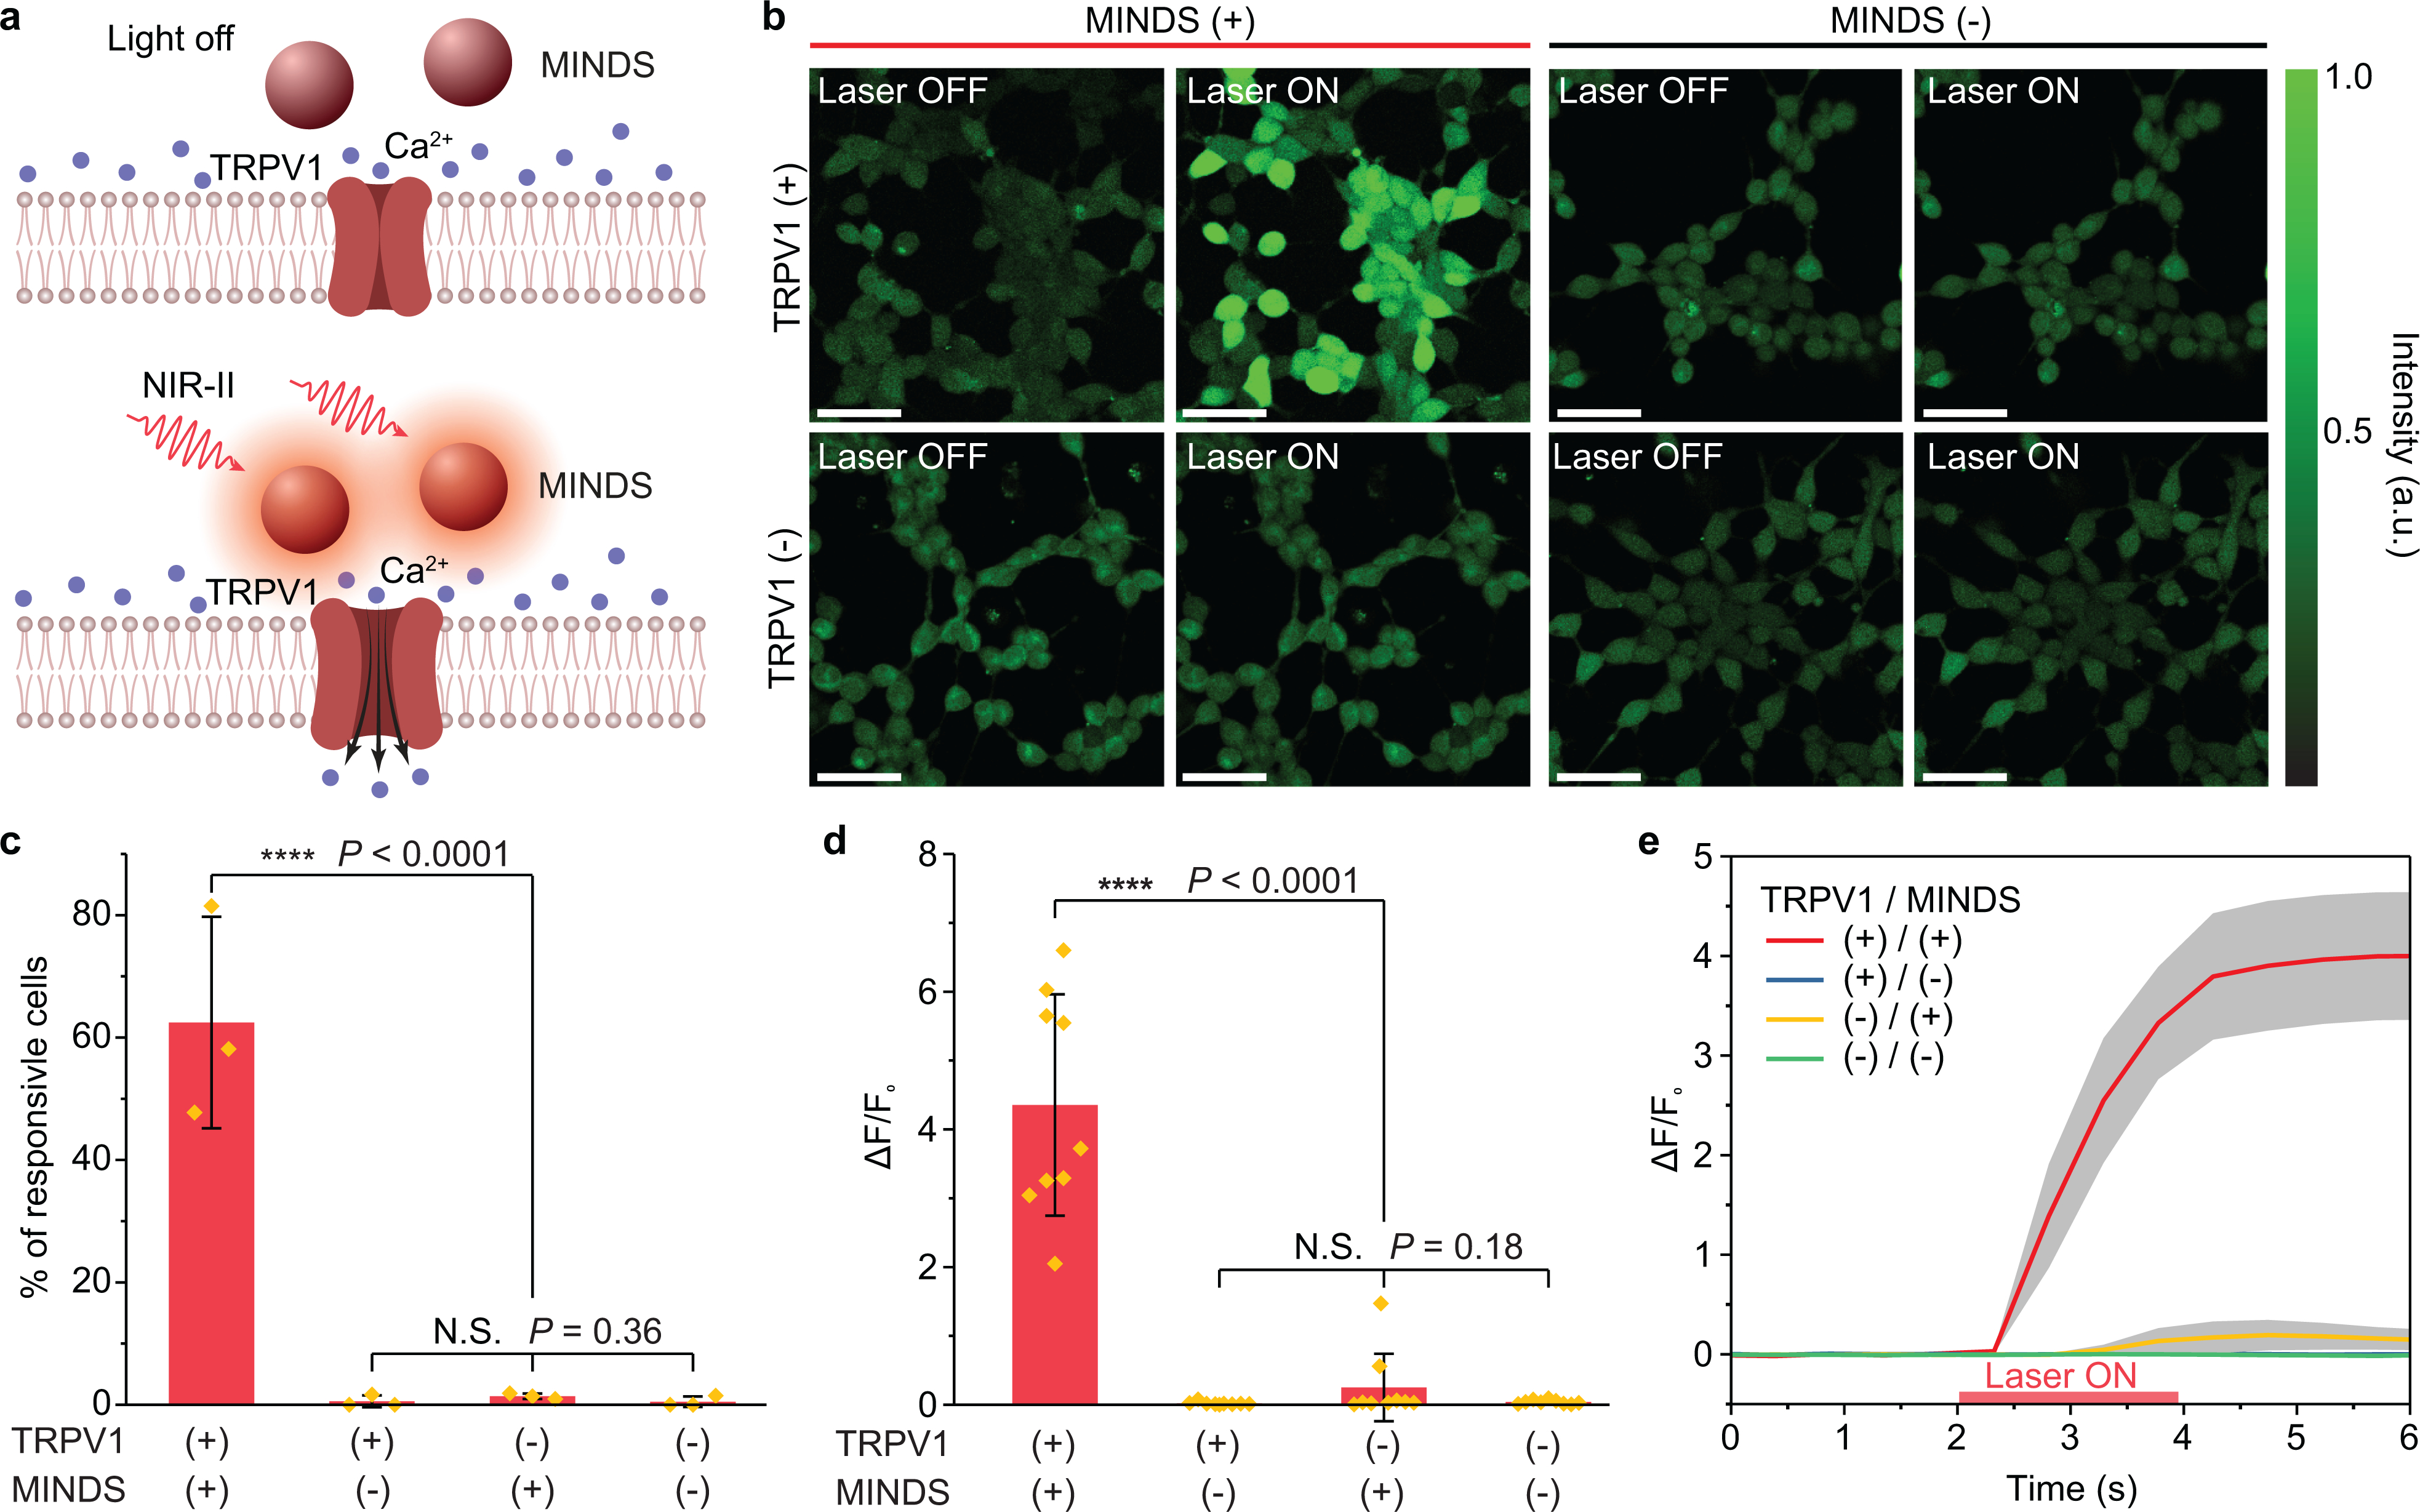
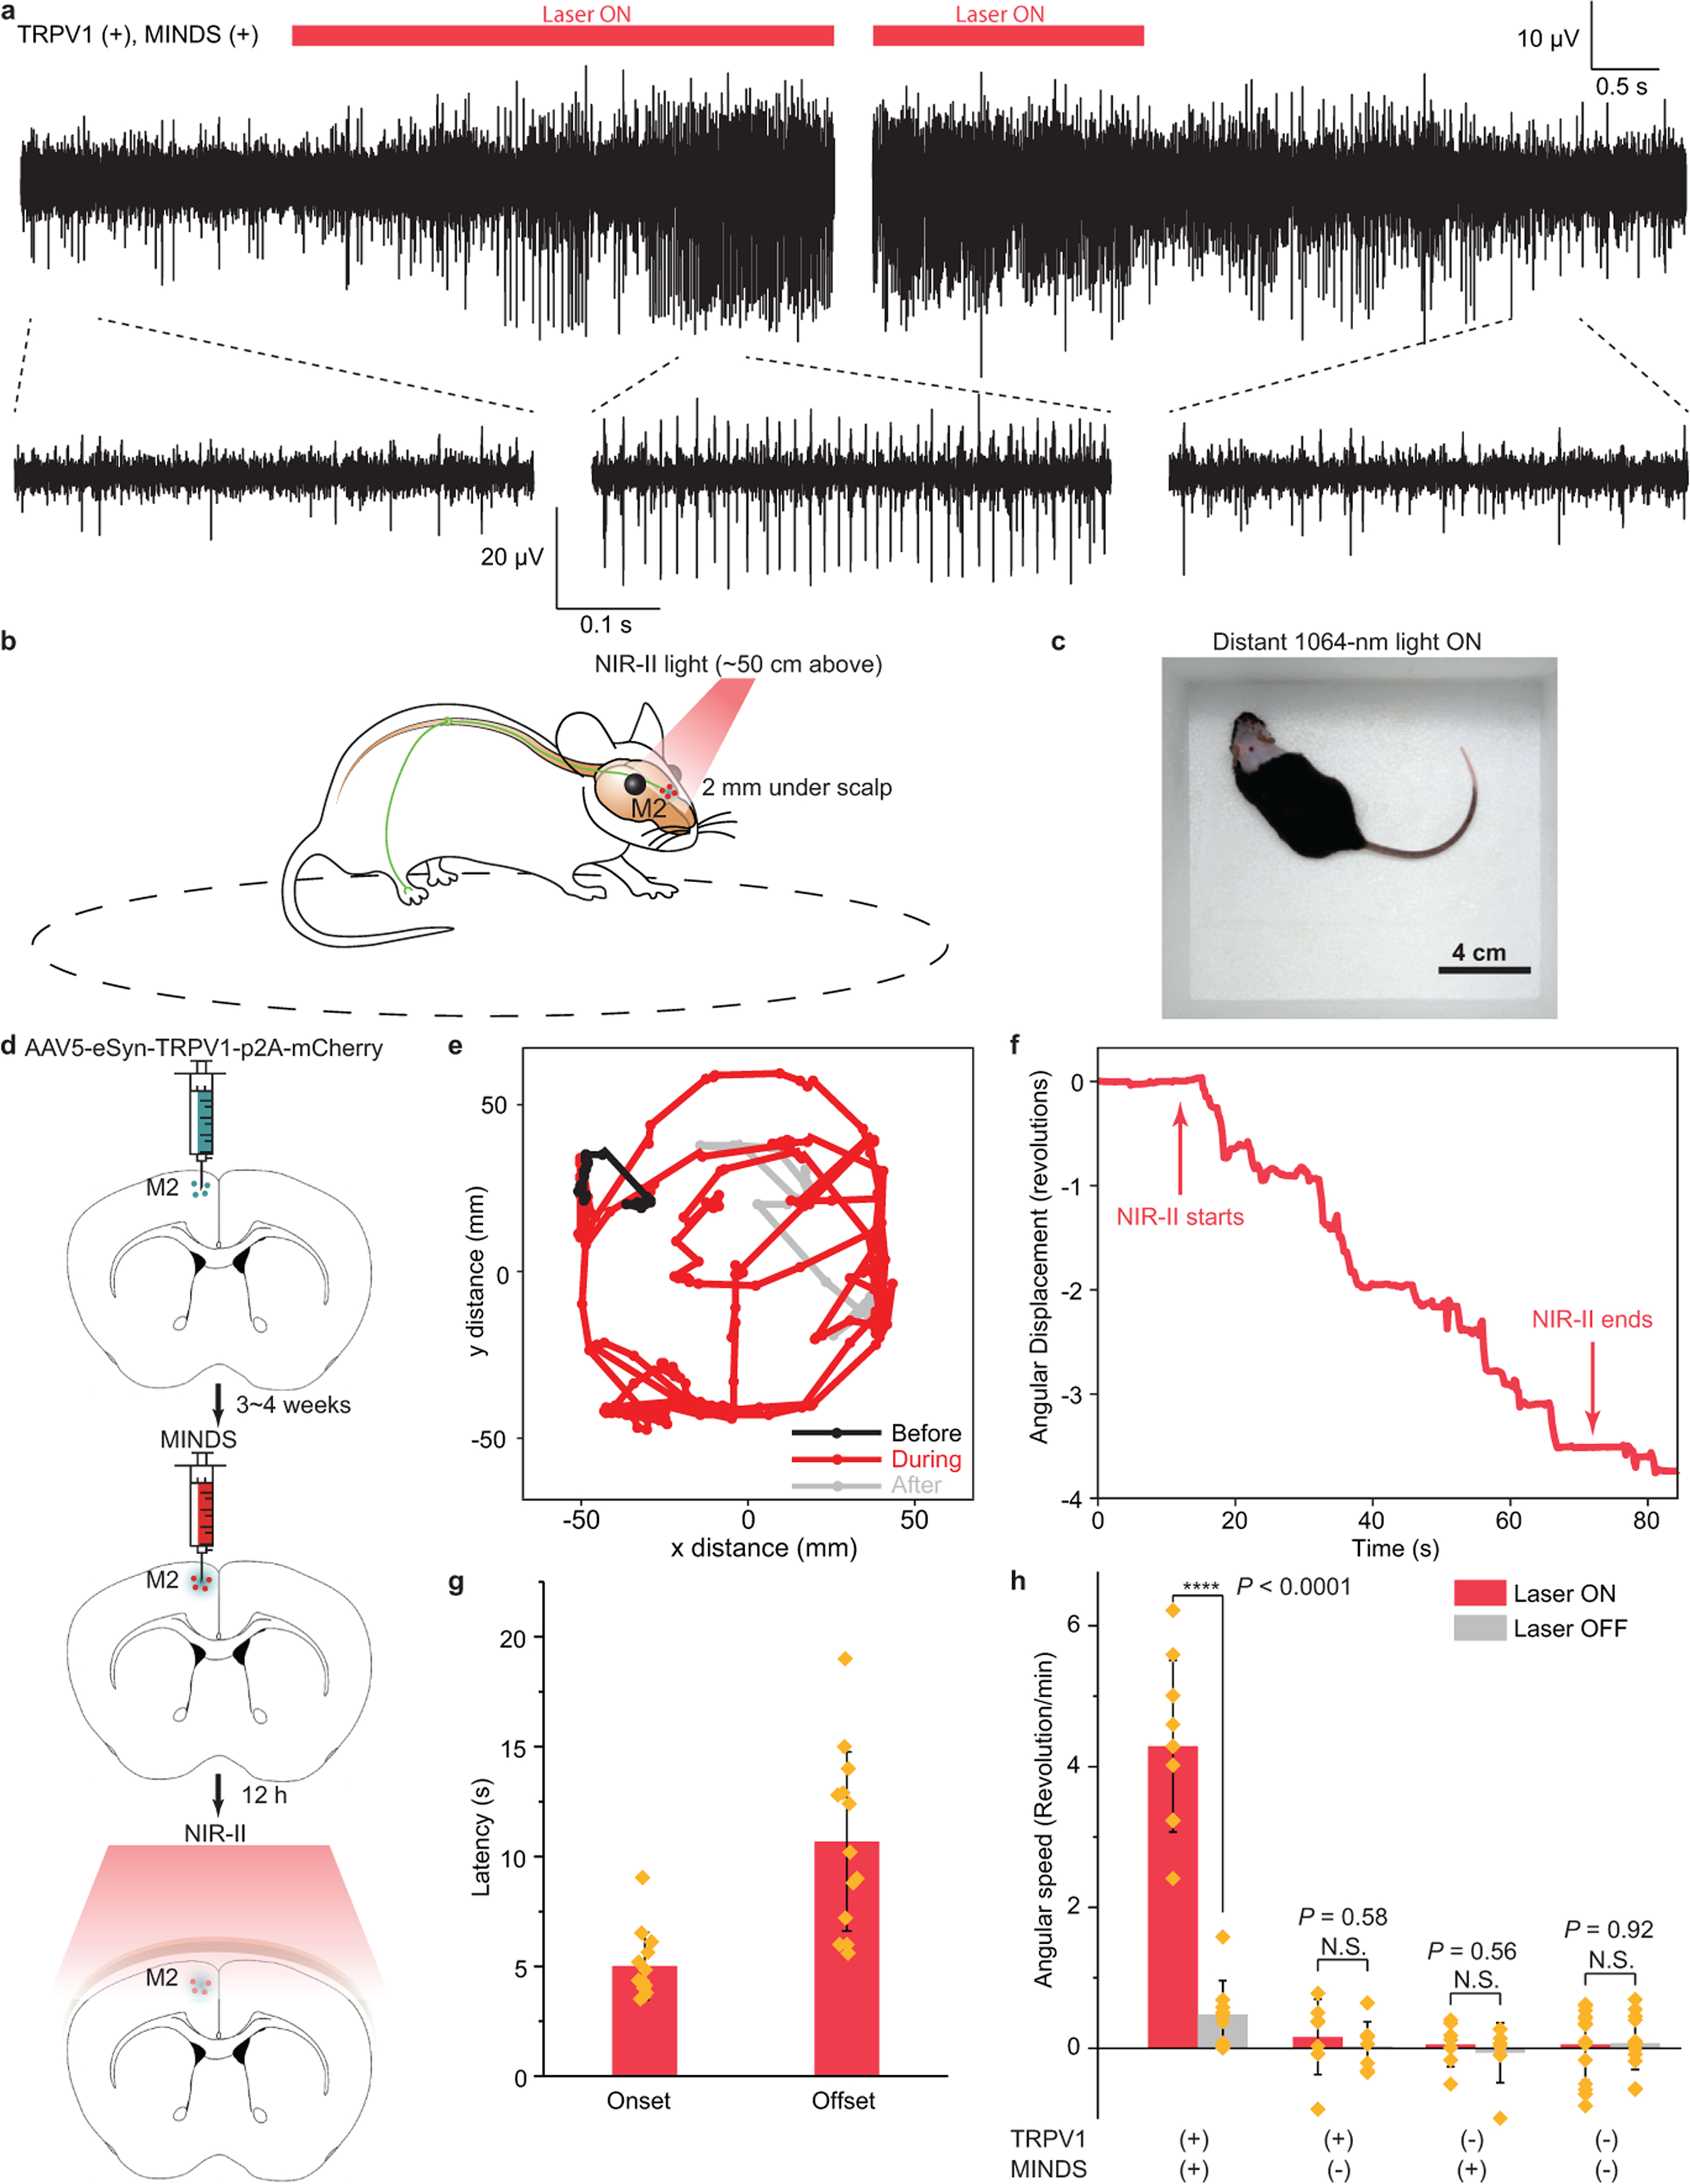
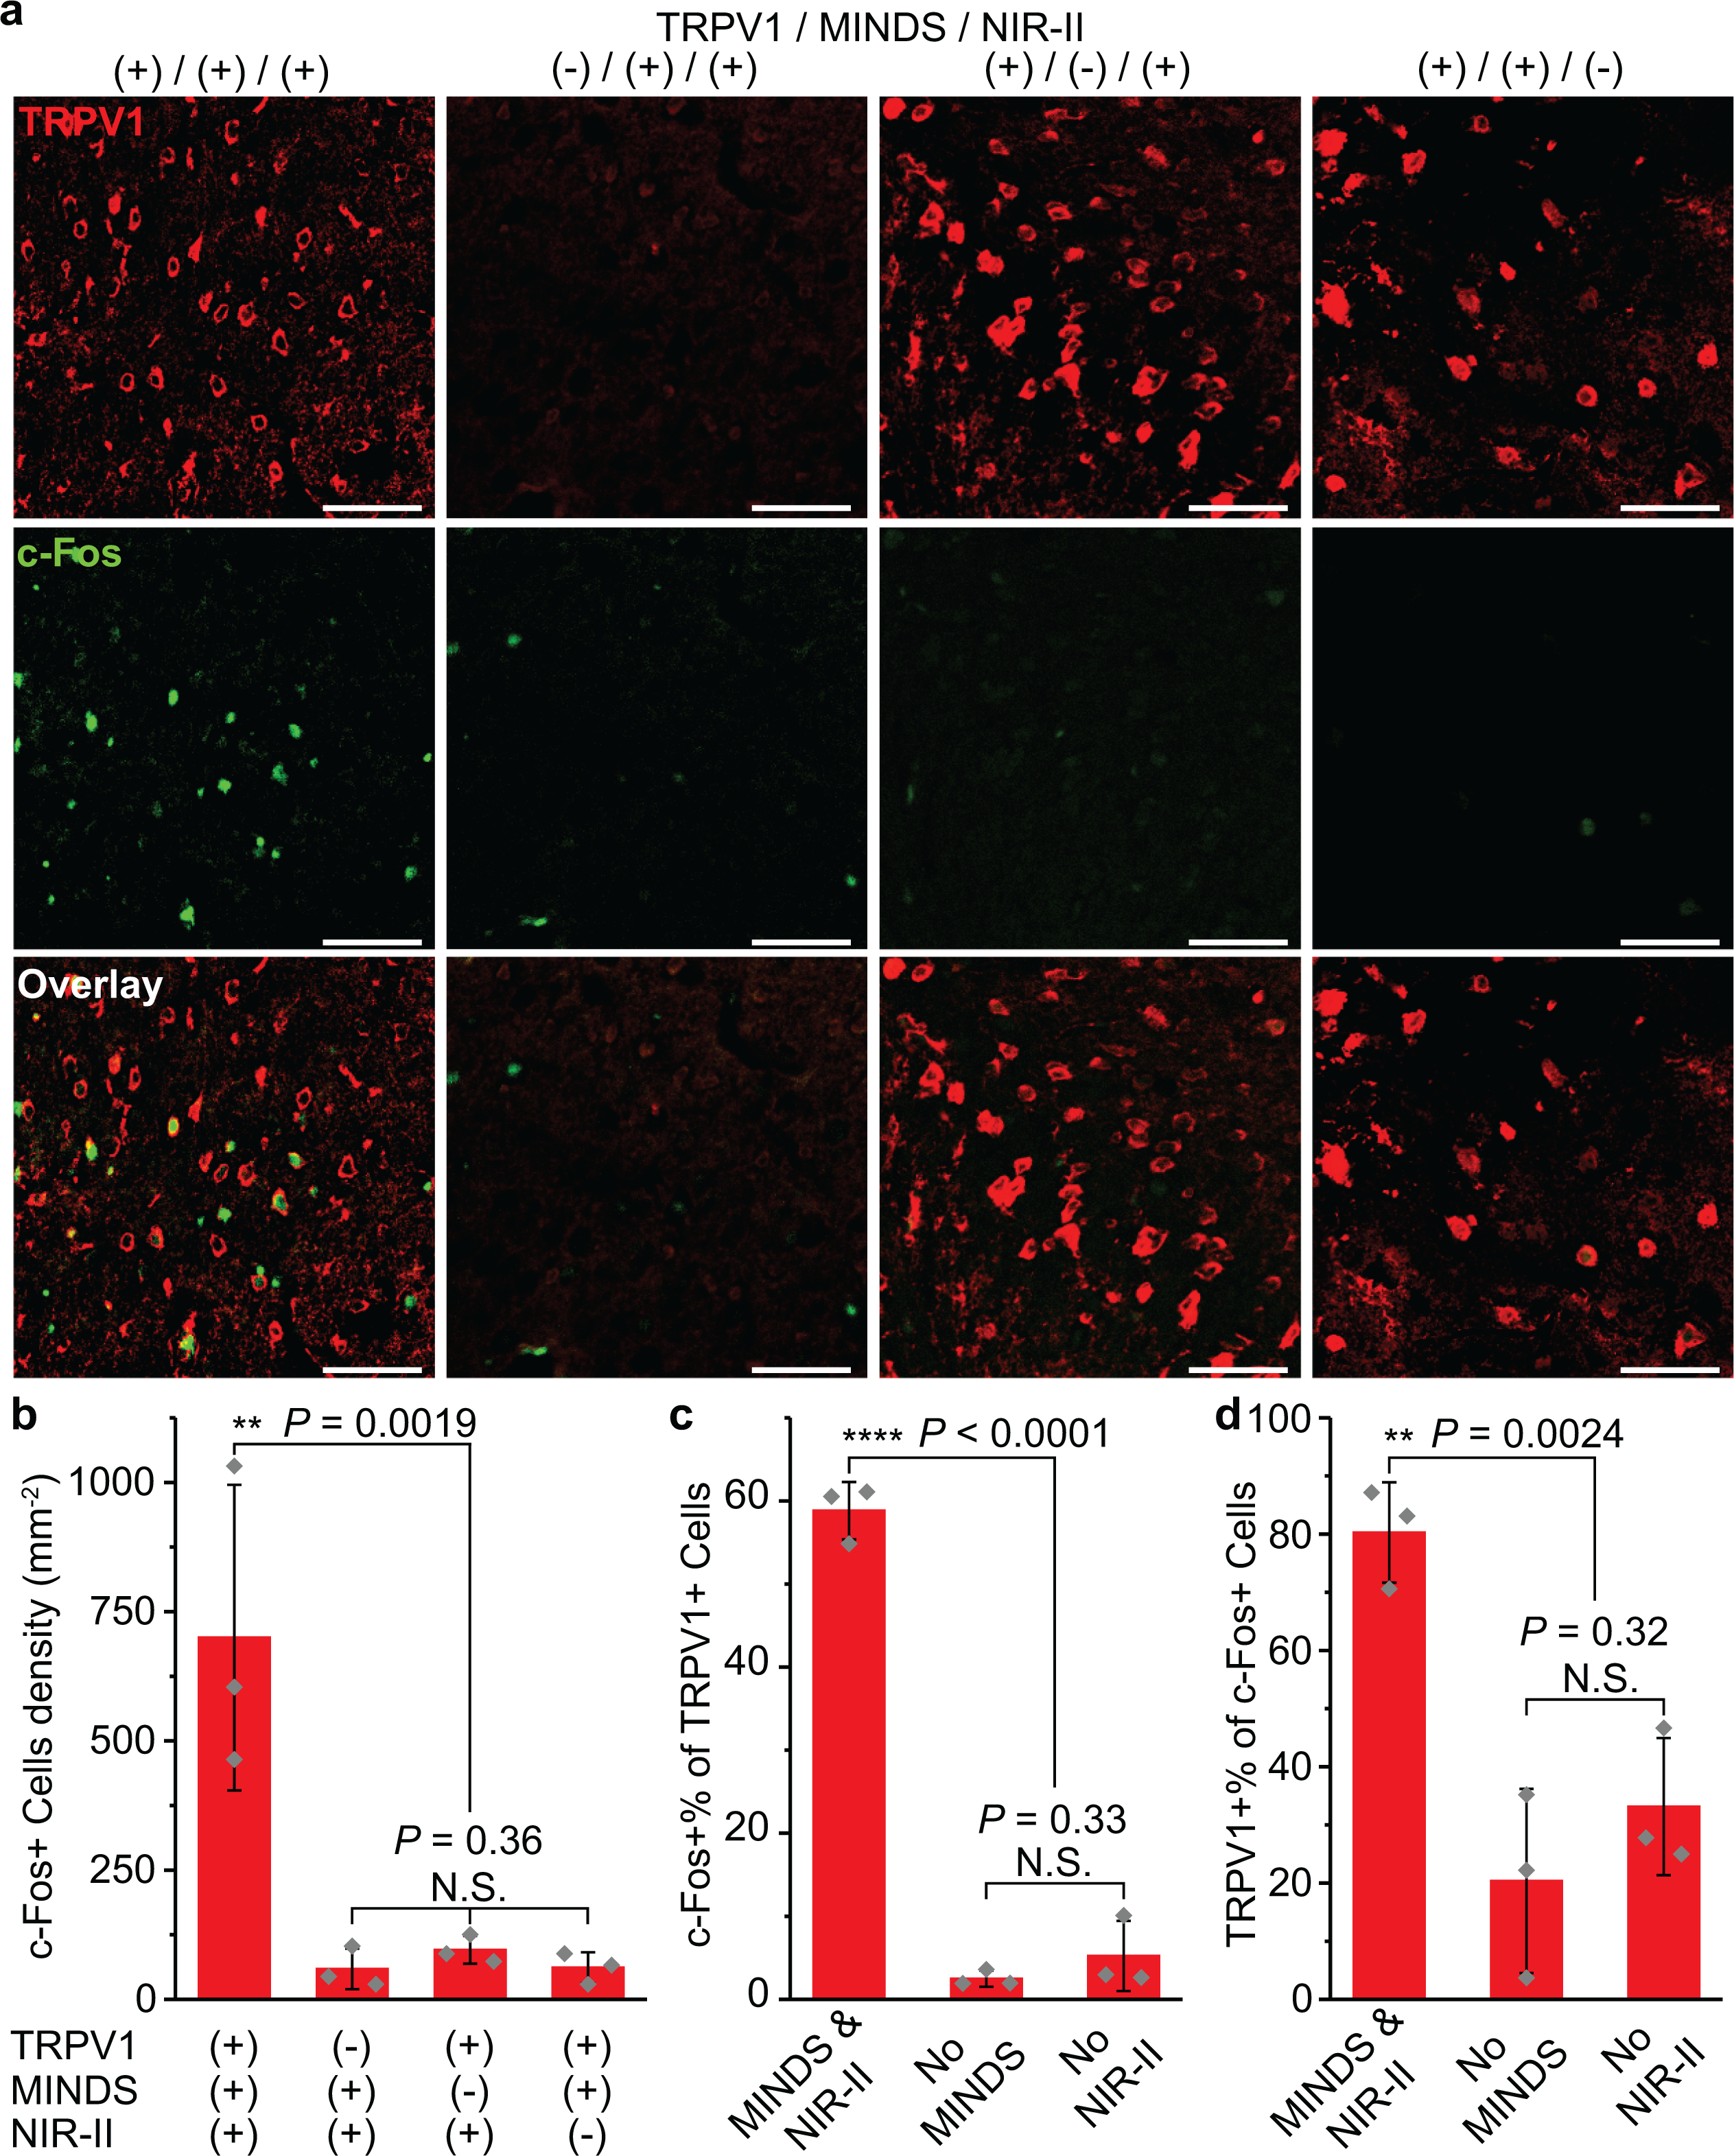
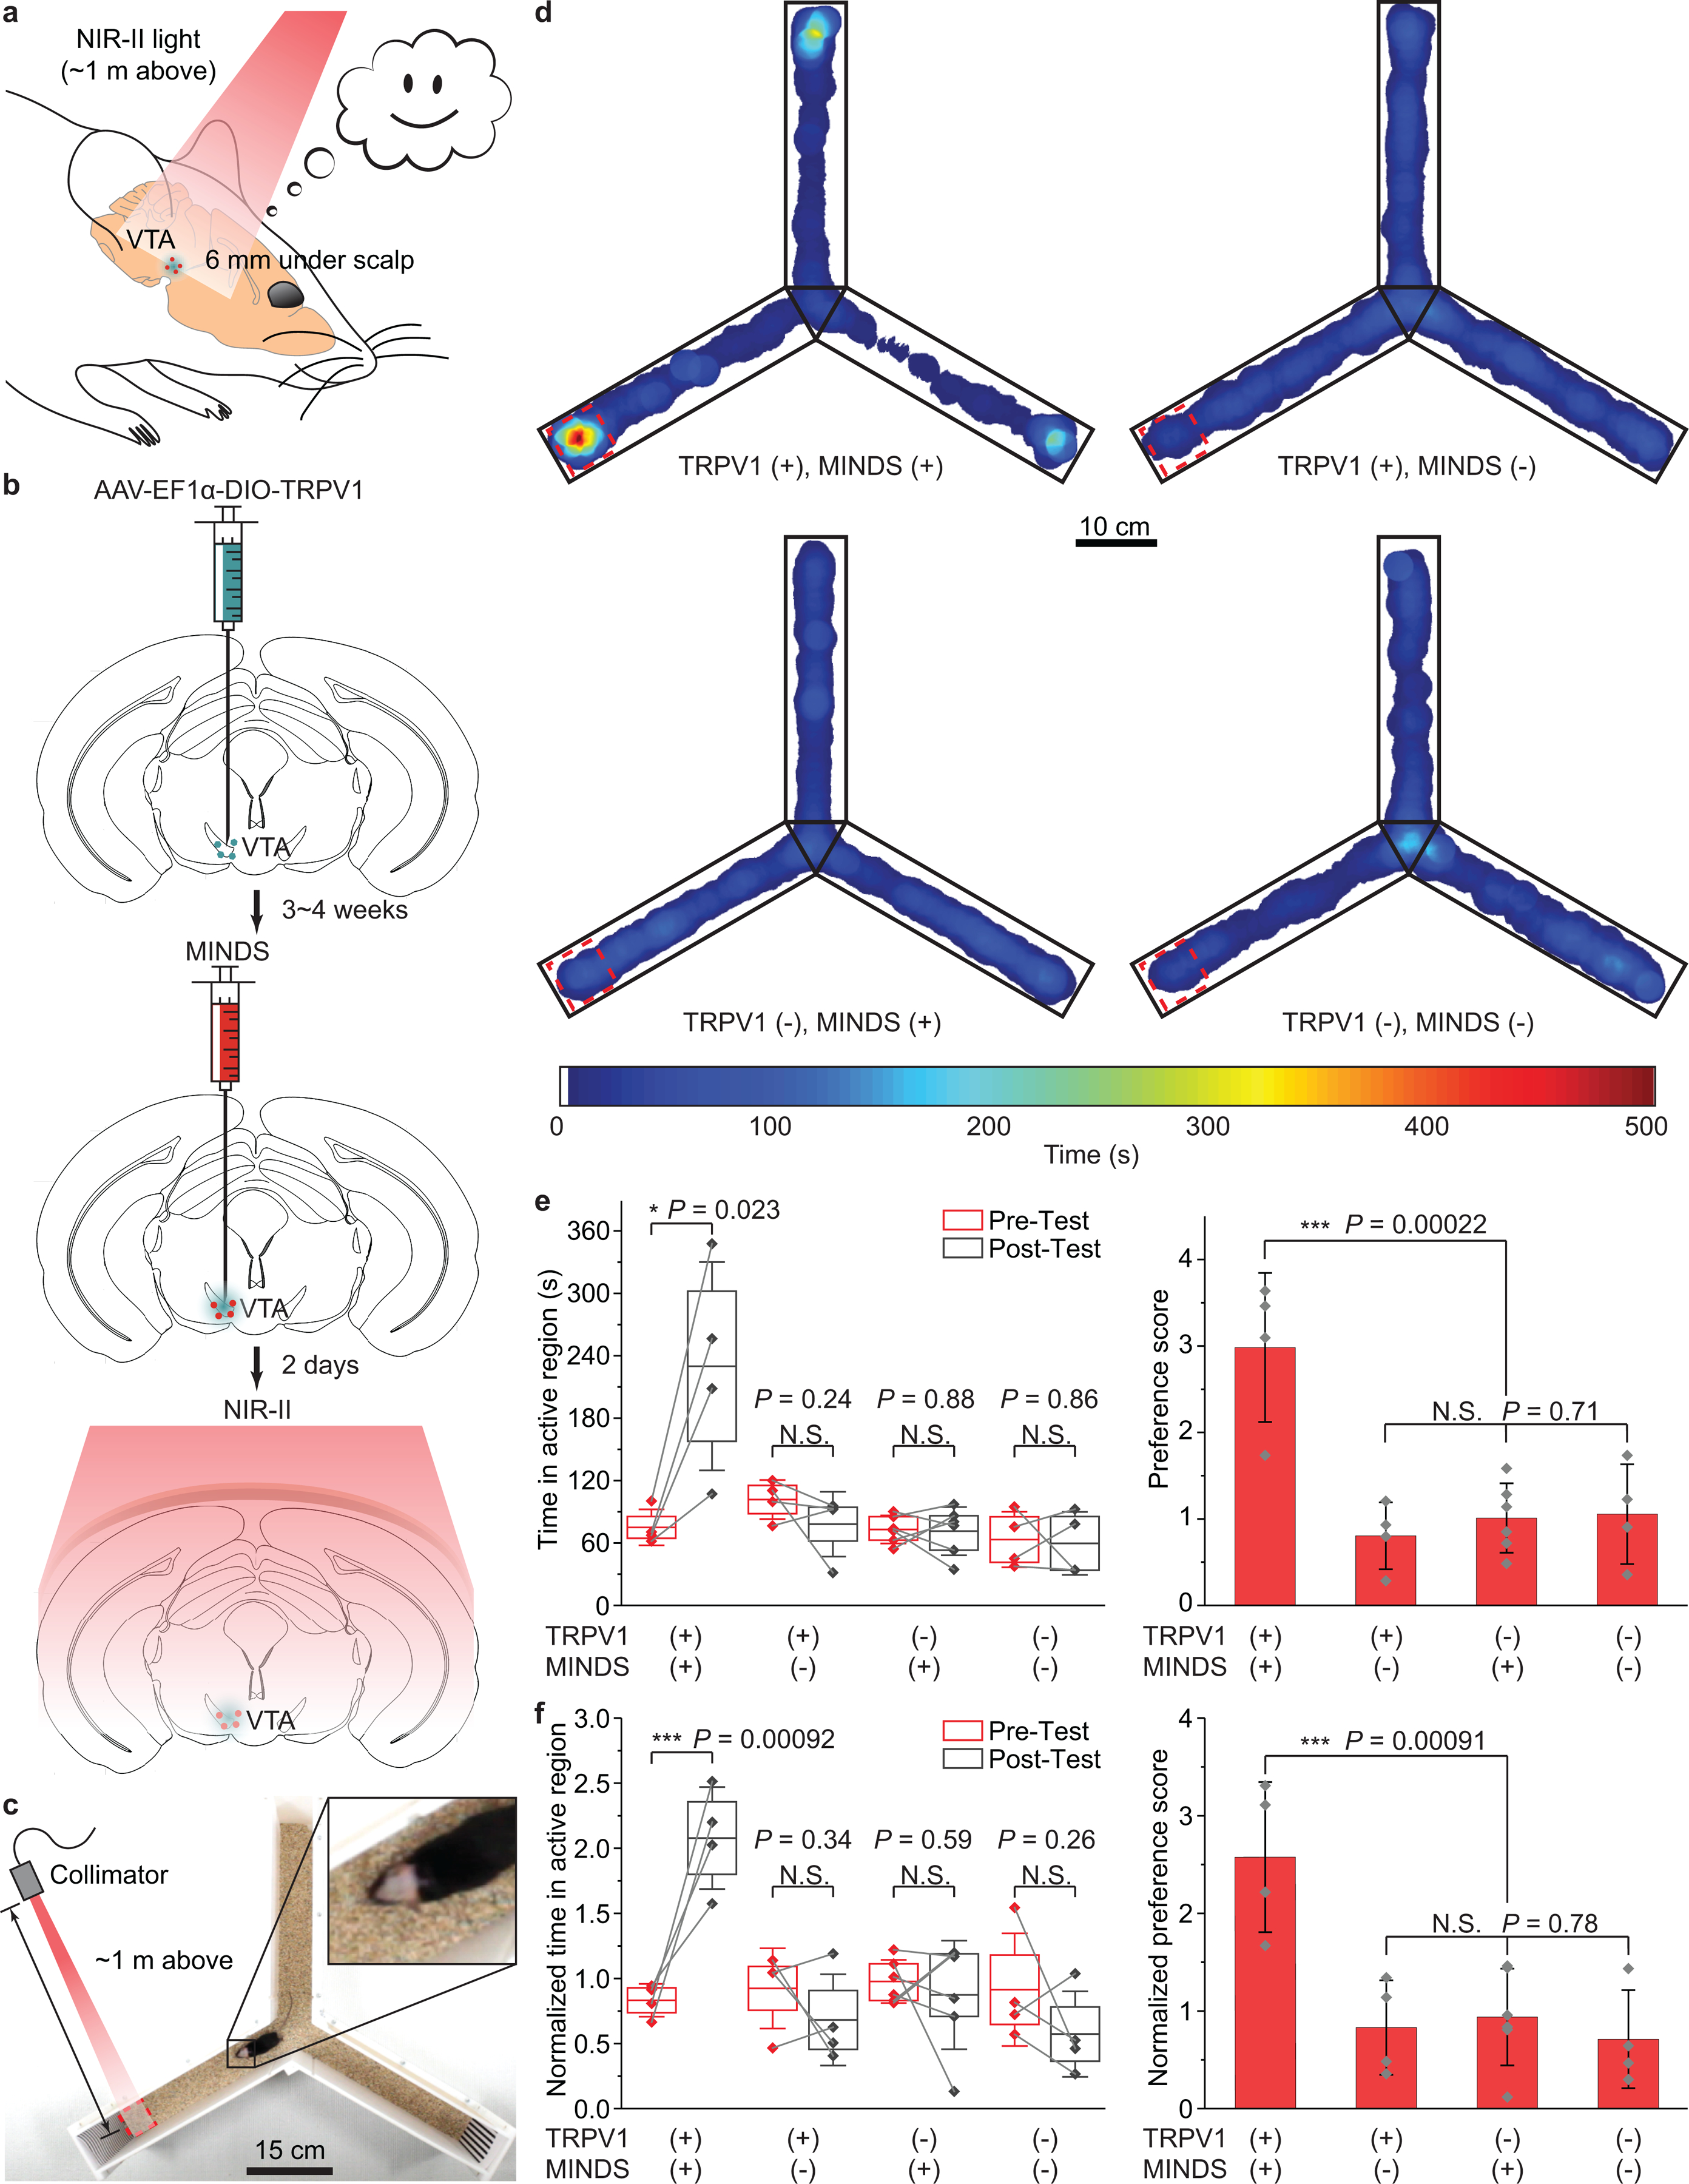
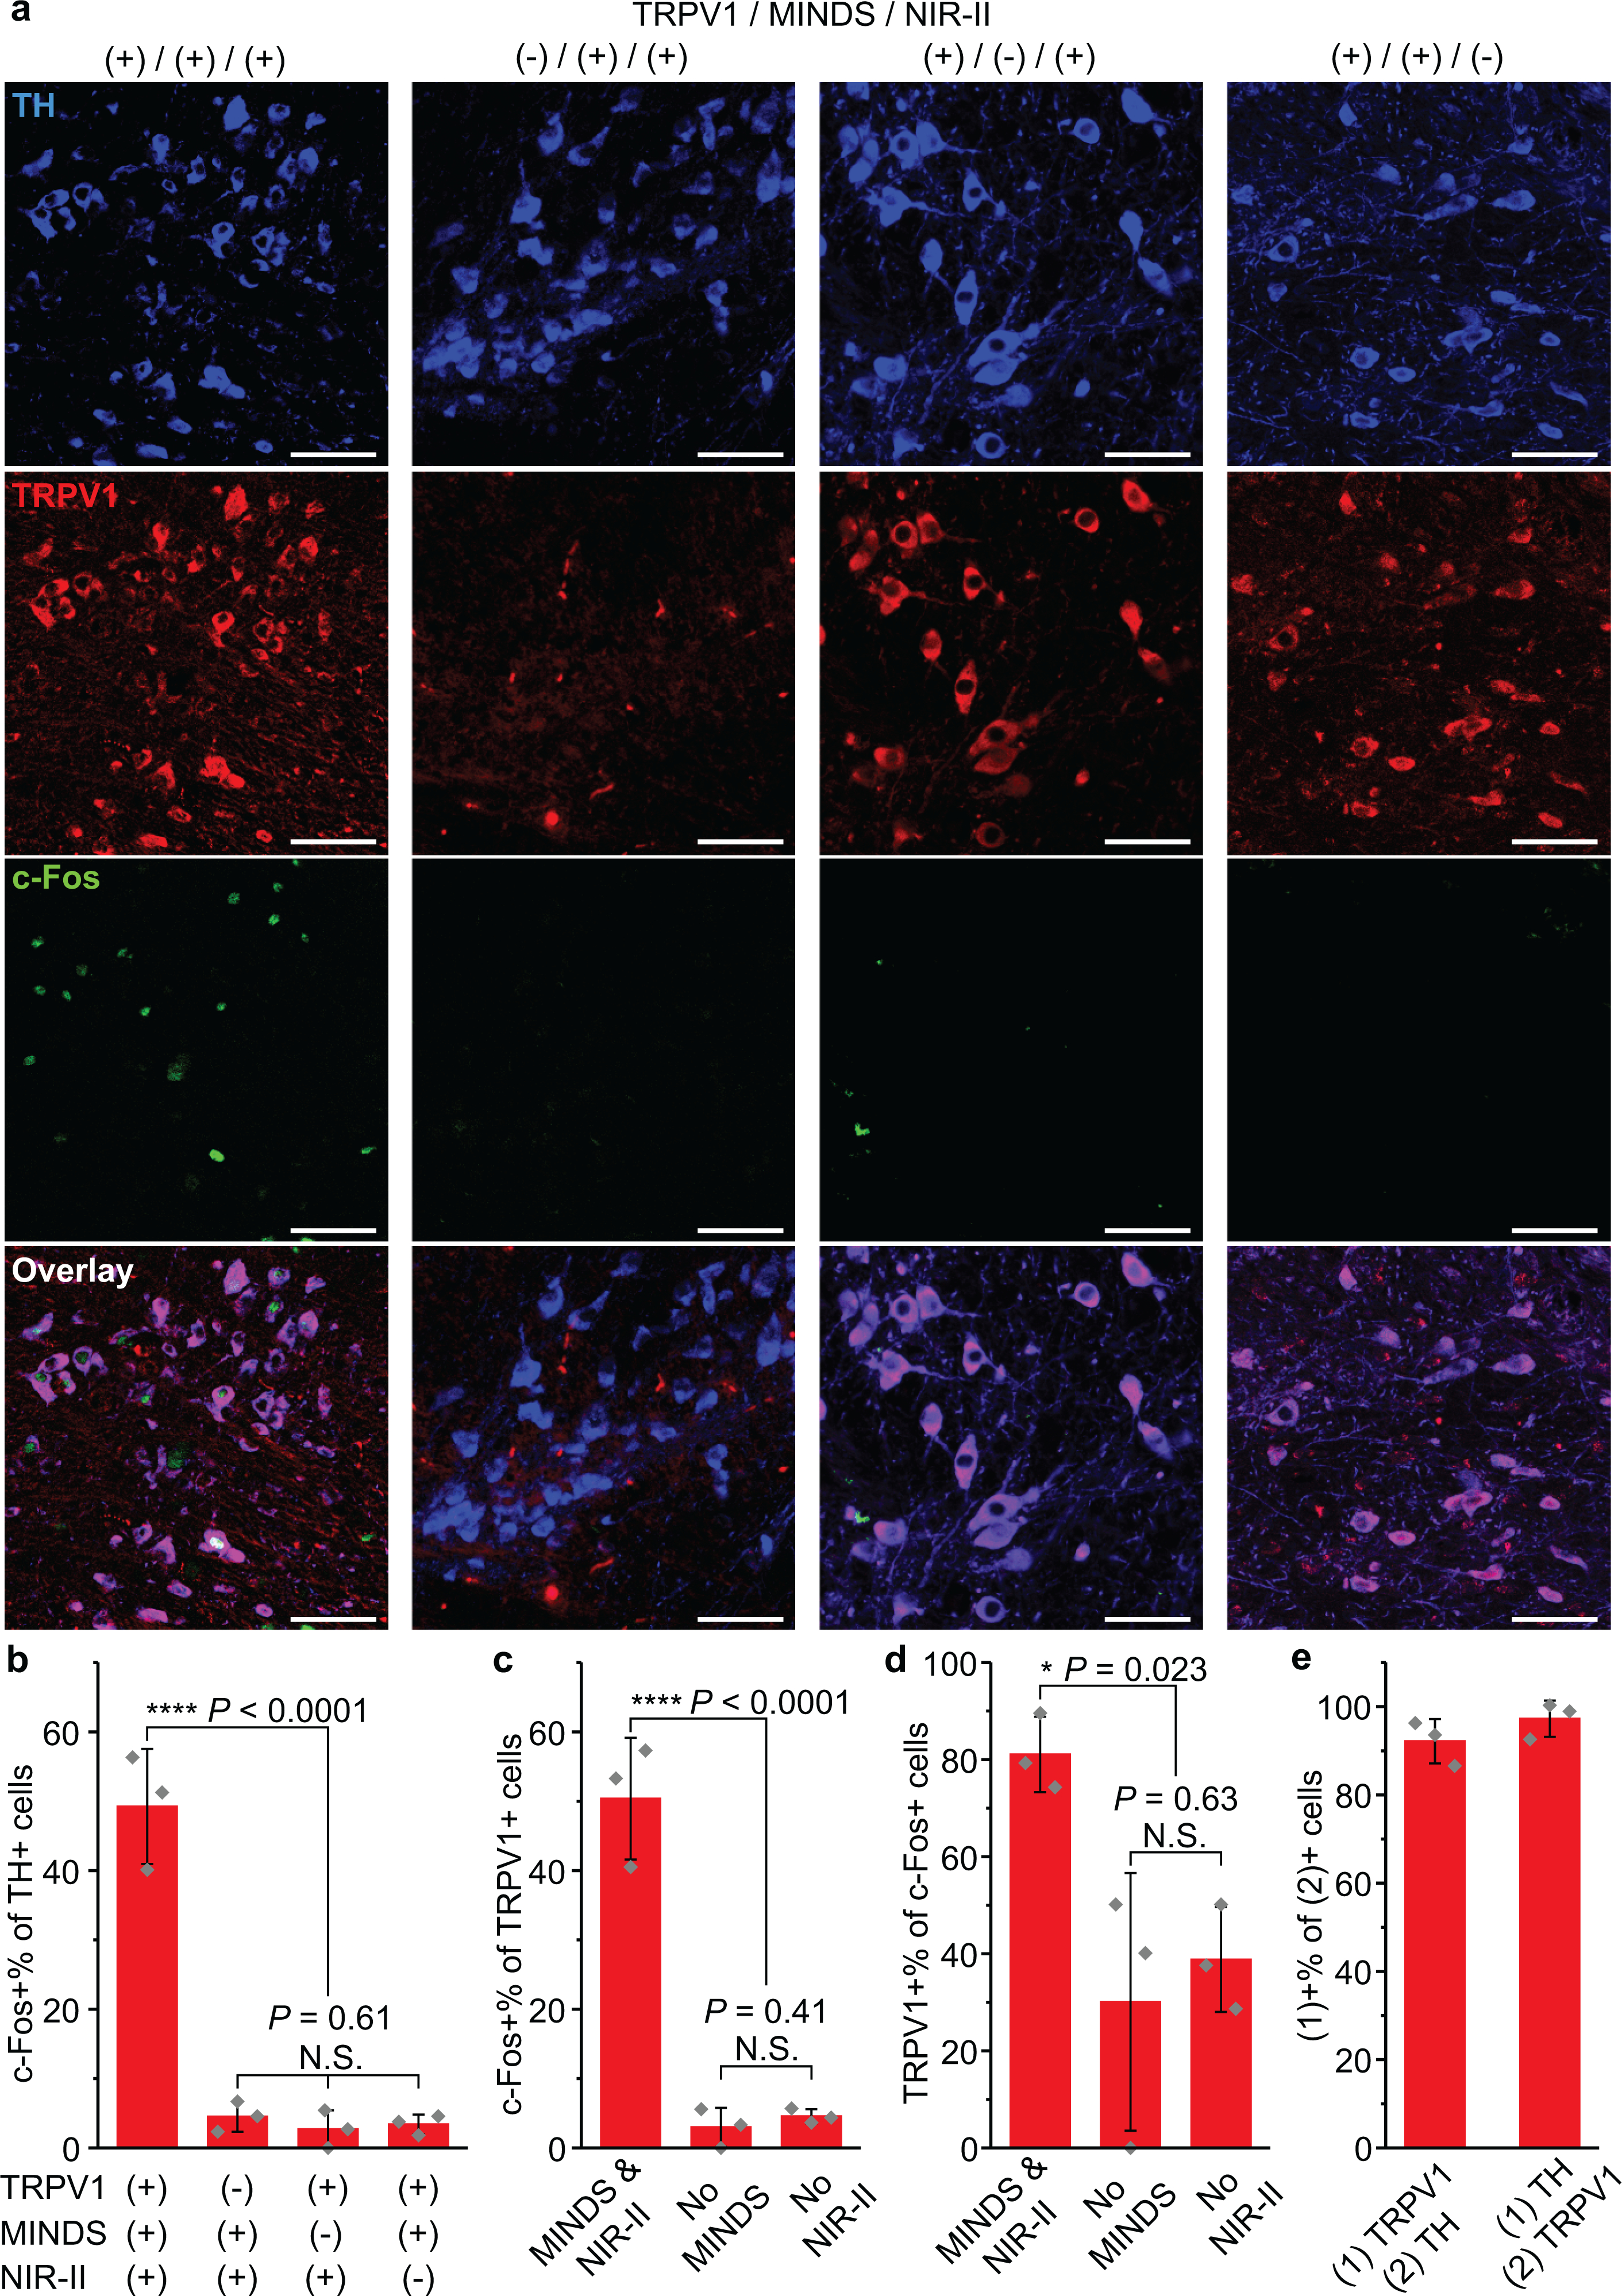
Neural circuitry is typically modulated via invasive brain implants and tethered optical fibres in restrained animals. Here we show that wide-field illumination in the second near-infrared spectral window (NIR-II) enables implant-and-tether-free deep-brain stimulation in freely behaving mice with stereotactically injected macromolecular photothermal transducers activating neurons ectopically expressing the temperature-sensitive transient receptor potential cation channel subfamily V member 1 (TRPV1). The macromolecular transducers, ~40 nm in size and consisting of a semiconducting polymer core and an amphiphilic polymer shell, have a photothermal conversion efficiency of 71% at 1,064 nm, the wavelength at which light attenuation by brain tissue is minimized (within the 400-1,800 nm spectral window). TRPV1-expressing neurons in the hippocampus, motor cortex and ventral tegmental area of mice can be activated with minimal thermal damage on wide-field NIR-II illumination from a light source placed at distances higher than 50 cm above the animal's head and at an incident power density of 10 mW mm-2. Deep-brain stimulation via wide-field NIR-II illumination may open up opportunities for social behavioural studies in small animals.


Conflict of interest statement

Competing interests

The authors declare no competing interests.

Figures

Fig. 1 |
Fig. 1 |. Efficient photothermal conversion of MINDS in the NIR-II window.
a, Schematic showing through-scalp neuromodulation with NIR-II illumination > 50 cm above the mouse head, which activates TRPV1 via the sensitization of MINDS (red circles). b, Schematic showing the composition of MINDS, highlighting the pBBTV conjugated copolymers in the core (red hexagons) and the PLGA-PEG polymer comprising the shell (green spirals). c, A representative TEM image of MINDS. The experiment was repeated three times independently with similar results. d, Distribution of the hydrodynamic diameters of MINDS revealed by DLS measurement. Data are presented as mean values +/− standard deviation (SD). (n = 3 independent experiments). e, Absorption spectrum of MINDS dispersion in PBS, showing strong absorption in the 1000–1700 nm NIR-II window (red shade). f, Representative photothermal heating and cooling curve of 1.8 mg mL−1 MINDS dispersion, where the red bar indicates illumination with a 1064-nm laser at a power density of 10 mW mm−2. g, Thermal images showing efficient photothermal heating of 25 μg mL−1 MINDS (right), in comparison with the same solution before NIR-II illumination (left) and PBS (middle). Both the PBS and MINDS images were taken when the temperature reached equilibrium after 30 min under 10 mW mm−2 1064-nm illumination. h, Thermal images of cell pellets incubated with PBS and MINDS, showing effective heating of cells with MINDS. Both images were taken when the temperature of the cell pellet reached equilibrium after 10 min under 10 mW mm−2 1064-nm illumination.
Fig. 2 |
Fig. 2 |. NIR-II photothermal activation of MINDS-sensitized TRPV1 in vitro.
a, Schematic showing NIR-II photothermal activation of TRPV1 expressed in the plasma membrane of cells mediated by MINDS. b, Calcium imaging of HEK293T cells under different experimental conditions. A calcium signal increase is only seen when the NIR-II laser illuminates TRPV1+/MINDS+ cells. The experiment was repeated three times independently with similar results. Scale bars represent 50 μm. c, Percentage of responsive cells upon NIR-II illumination. A cell is defined responsive if its calcium signal rises over 50% of original intensity within 5 s of NIR-II illumination (i.e., ΔF/F0> 50%). (n = 3 independent experiments for each group, including 874 cells in total; one-way analysis of variance (ANOVA), F(3,8) = 38, P < 0.0001; F(2,6) = 1.23, P = 0.36). Data are presented as mean values +/− SD. d, Statistical analysis of calcium signal changes for different groups of cells (n = 9 replicates with 15 cells in each replicate), shown as the ratio of maximum calcium signal change after NIR-II illumination over the original calcium signal before NIR-II illumination. (One-way ANOVA, F(3,32) = 40.74, P < 0.0001; F(2,24) = 1.82, P = 0.18). Data are presented as mean values +/− SD. e, Temporal dynamics of the calcium signal for different groups of cells, showing an average latency time of 0.9 ± 0.2 s for calcium signal to increase over 3 SD of baseline and 1.1 ± 0.2 s to increase to 50% of the maximum. Data are presented as mean values +/− standard error of the mean (n = 9 replicates with 15 cells in each replicate). (P ≥ 0.05 (N.S.), ****P < 0.0001. N.S., not significant.)
Fig. 3 |
Fig. 3 |. Through-scalp NIR-II neuromodulation of the mouse hippocampus and motor cortex.
a, Representative traces showing the increase in neuron firing rate in the mouse hippocampus upon 1064-nm light illumination (left). The neuron firing rate returned to the baseline after the 1064-nm light was turned off (right). b, Schematic showing through-scalp NIR-II activation of motor neurons (located ca. 2 mm underneath scalp surface) that ectopically overexpress TRPV1 channels and project to the spinal cord for controlling the unilateral limb via the sensitization of MINDS (red dots). c, A representative image showing the arena for motor behavioural modulation by distant NIR-II illumination (invisible in the image since the camera used to take this image is insensitive to the NIR-II wavelength). d, Schematics illustrating the process of TRPV1 virus delivery (green dots, top), injection of MINDS (red dots, middle, where the green haze indicates neural tissue transduced with TRPV1), and NIR-II activation of TRPV1 neurons through the scalp (bottom). e, Trajectory of the mouse before (black), during (red) and after (gray) distant NIR-II illumination. f, Angular displacement (number of revolutions, where positive indicates counter-clockwise revolutions and negative indicates clockwise revolutions) before, during and after NIR-II illumination. g, Bar chart showing the statistics of onset and offset latency times for M2 neural stimulation with NIR-II illumination. See Methods for the definitions of onset and offset latency times. Data are presented as mean values +/− SD and each point indicates an independent trial from a total of N = 13 trials. h, Statistical analysis of rotational movements of animals under different experimental conditions. (n = 6 mice for TRPV1+/MINDS+ and n = 3 mice for all other groups; one-way ANOVA, F(1,16) = 76.13, P < 0.0001; F(1,12) = 0.32, P = 0.58; F(1,12) = 0.36, P = 0.56; F(1,26) = 0.01, P = 0.92). Data are presented as mean values +/− SD and each point indicates an independent trial. (P ≥ 0.05 (N.S.), ****P < 0.0001.)
Fig. 4 |
Fig. 4 |. Immunohistology of the M2 region after NIR-II illumination.
a, Confocal images of the M2 region under different experiment conditions. An increase in c-Fos expression driven by NIR-II stimulation was only observed in the presence of both TRPV1 and MINDS. The scale bars indicate 50 μm. The number of images taken is reflected in the n values for b–d. b, Statistical analysis for the density of c-Fos+ cells for the four experiment conditions in a (one-way ANOVA, F(3,8) = 13.11, P = 0.0019; F(2,6) = 1.22, P = 0.36). c, Percentage of c-Fos+ cells within the TRPV1+ cell population. (one-way ANOVA, F (2,6) = 296.45, P < 0.0001; F(1,4) = 1.2, P = 0.33). d, Percentage of TRPV1+ cells within the c-Fos+ cell population. (one-way ANOVA, F(2,6) = 19.32, P < 0.0024; F(1,4) = 1.26, P = 0.32). Both c and d were analysed for the three experimental groups with TRPV1 transduction. All data are presented as mean values +/− SD n = 3 mice per group (P ≥ 0.05 (N.S.), **P < 0.01, ****P < 0.0001.).
Fig. 5 |
Fig. 5 |. Through-scalp NIR-II stimulation of a deep-brain region.
a, Schematic showing through-scalp NIR-II activation of VTA dopaminergic neurons (located ca. 6 mm underneath the scalp surface) that ectopically express TRPV1 via the sensitization of MINDS (red dots). b, Schematics illustrating the process of the specific transduction of dopaminergic neurons with TRPV1 (green dots, left), injection of MINDS (red dots, middle, where the green haze indicates neural tissue transduced with TRPV1), and distant NIR-II illumination for neural modulation through the scalp (right). c, Photograph showing the setup of a Y-maze for contextual conditioning test. d, Representative post-test heat maps showing the time of travel of mice under different experimental conditions. Red dashed squares indicate NIR-II irradiated regions. e, Statistical analysis of time spent in the NIR-II illuminated region (left) and preference score (right) for different TRPV1/MINDS combinations in the VTA. (One-way ANOVA, left: F(1,6) = 9.29, P = 0.023; F(1,6) = 1.69, P = 0.24; F(1,10) = 0.02, P = 0.88; F(1,6) = 0.03, P = 0.86; right: F(3,14) = 13.35, P = 0.00022; F(2,11) = 0.36, P = 0.71.) f, Statistical analysis of the normalized time spent in the NIR-II illuminated region (left) and the normalized preference score (right) for different TRPV1/MINDS combinations in the VTA. (One-way ANOVA, left: F(1,6) = 36.67, P = 0.00092; F(1,6) = 1.07, P = 0.34; F(1,10) = 0.32, P = 0.59; F(1,6) = 1.57, P = 0.26; right: F(3,14) = 9.93, P = 0.00091; F(2,11) = 0.25, P = 0.78.) See Methods for the definitions of preference score, normalized time in the active region and normalized preference score. In the left panels of both e and f, the centre lines, lower bound, upper bound, and whiskers indicate the mean, 25th percentile, 75th percentile, and ±1 SD, respectively. In the right panels of e and f, data are presented as mean values +/− SD. n = 6 mice for TRPV1–/MINDS+ and n = 4 mice for all other groups, with data points shown for each animal. (P ≥ 0.05 (N.S.), *P < 0.05, ***P < 0.001.)
Fig. 6 |
Fig. 6 |. Immunohistology of the VTA region after NIR-II illumination.
a, Confocal images of the VTA region under different experimental conditions. An increase in c-Fos expression driven by NIR-II stimulation was only observed in the presence of both TRPV1 and MINDS. The scale bars indicate 50 μm. The number of images taken is reflected in the n values for b–d. b, Percentage of c-Fos+ neurons in the TH+ cell population, corresponding to the four conditions presented in a. (One-way ANOVA, F(3,8) = 75.69, P < 0.0001; F(2,6) = 0.54, P = 0.61.) c, Percentage of c-Fos+ cells within the TRPV1+ cell population. (One-way ANOVA, F(2,6) = 75.83, P < 0.0001; F(1,4) = 0.85, P = 0.41.) d, Percentage of TRPV1+ cells within the c-Fos+ cell population. Both c and d were analysed for the three experimental groups with TRPV1 transduction. (One-way ANOVA, F(2,6) = 7.59, P = 0.023; F(1,4) = 0.28, P = 0.63.) e, Statistics of TRPV1 expression in TH+ neurons (left bar) and TH expression in TRPV1+ neurons (right bar). All data are presented as mean values +/− SD (n = 3 mice per group, P ≥ 0.05 (N.S.), *P < 0.05, ****P < 0.0001).

Similar articles

Cited by

References

    1. Fenno L, Yizhar O & Deisseroth K The development and application of optogenetics. Annu. Rev. Neurosci. 34, 389–412 (2011). - PMC - PubMed
    1. Tsai H-C et al. Phasic firing in dopaminergic neurons is sufficient for behavioral conditioning. Science 324, 1080–1084 (2009). - PMC - PubMed
    1. Montgomery KL et al. Wirelessly powered, fully internal optogenetics for brain, spinal and peripheral circuits in mice. Nat. Methods 12, 969–974 (2015). - PMC - PubMed
    1. Lozano AM et al. Deep brain stimulation: current challenges and future directions. Nat. Rev. Neurol. 15, 148–160 (2019). - PMC - PubMed
    1. Carvalho-de-Souza JL et al. Photosensitivity of neurons enabled by cell-targeted gold nanoparticles. Neuron 86, 207–217 (2015). - PMC - PubMed

Publication types