. 2022 Mar 21;13(1):1509.
doi: 10.1038/s41467-022-29007-y.

Asymmetric peptidoglycan editing generates cell curvature in Bdellovibrio predatory bacteria

Affiliations

Asymmetric peptidoglycan editing generates cell curvature in Bdellovibrio predatory bacteria

Emma J Banks et al. Nat Commun. .

Abstract

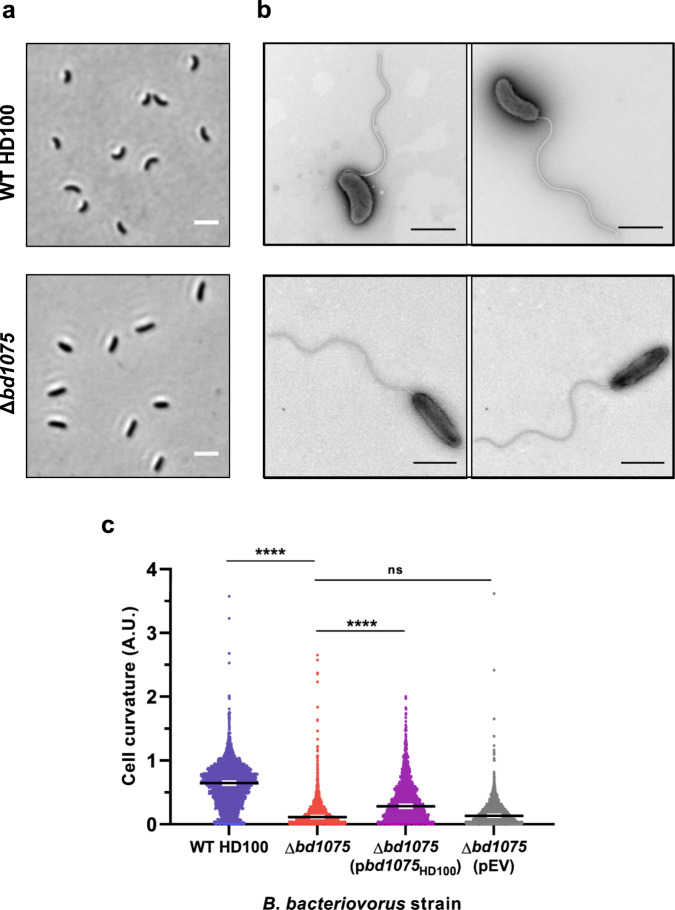
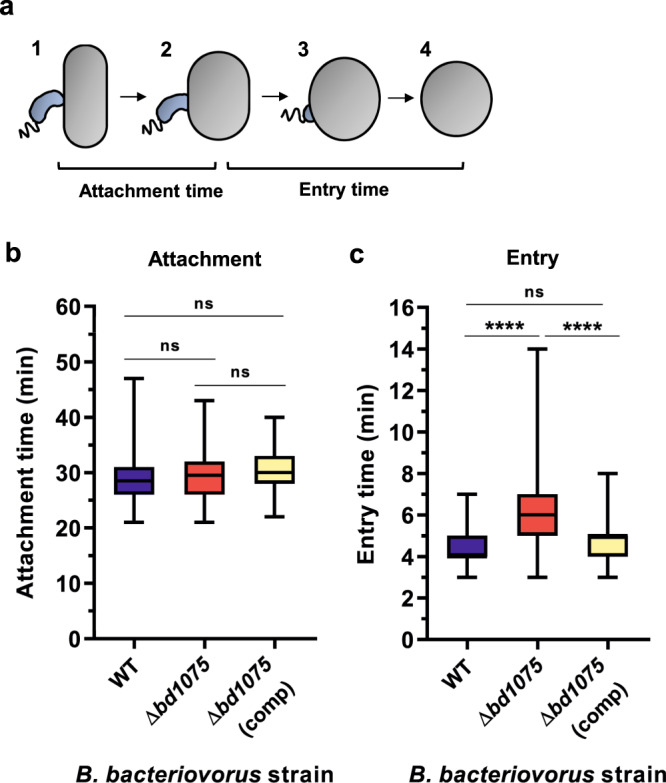
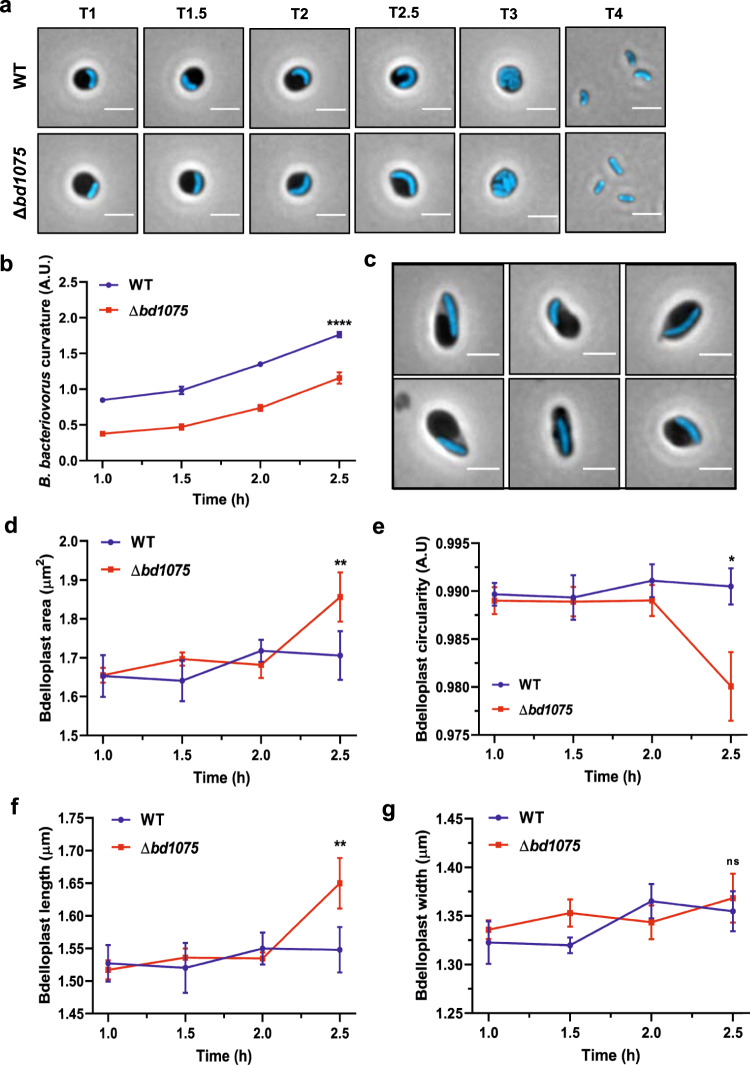
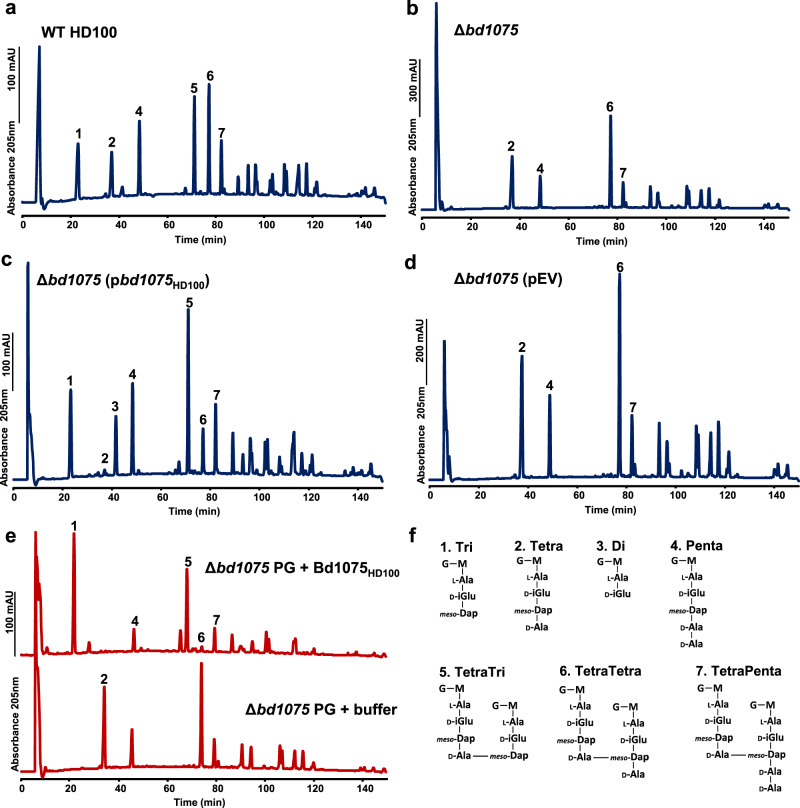
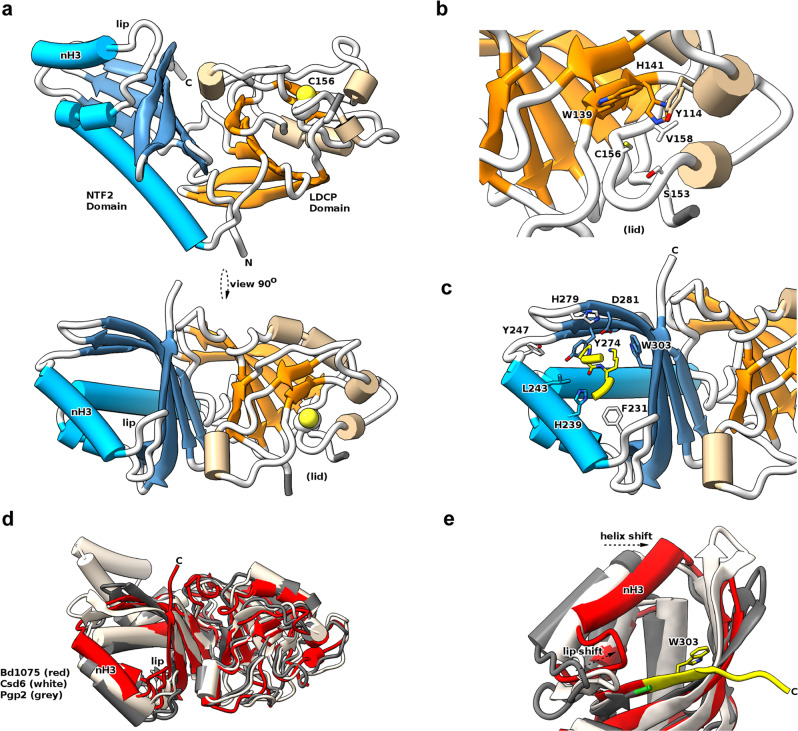
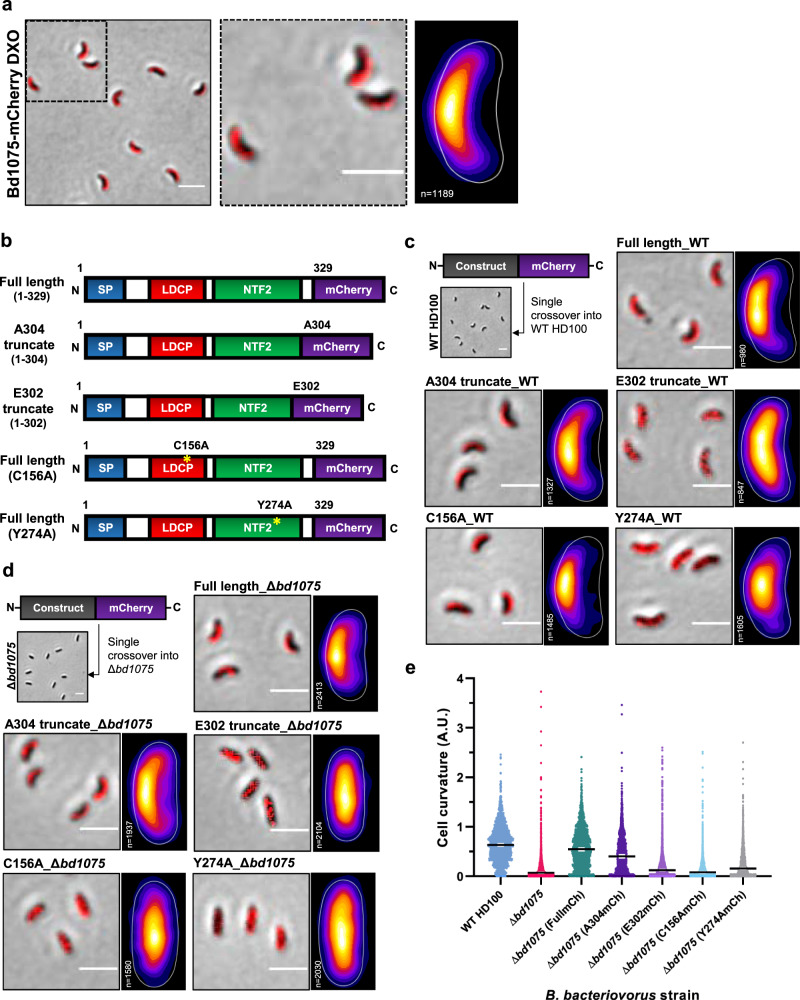
Peptidoglycan hydrolases contribute to the generation of helical cell shape in Campylobacter and Helicobacter bacteria, while cytoskeletal or periskeletal proteins determine the curved, vibrioid cell shape of Caulobacter and Vibrio. Here, we identify a peptidoglycan hydrolase in the vibrioid-shaped predatory bacterium Bdellovibrio bacteriovorus which invades and replicates within the periplasm of Gram-negative prey bacteria. The protein, Bd1075, generates cell curvature in B. bacteriovorus by exerting LD-carboxypeptidase activity upon the predator cell wall as it grows inside spherical prey. Bd1075 localizes to the outer convex face of B. bacteriovorus; this asymmetric localization requires a nuclear transport factor 2-like (NTF2) domain at the protein C-terminus. We solve the crystal structure of Bd1075, which is monomeric with key differences to other LD-carboxypeptidases. Rod-shaped Δbd1075 mutants invade prey more slowly than curved wild-type predators and stretch invaded prey from within. We therefore propose that the vibrioid shape of B. bacteriovorus contributes to predatory fitness.


Conflict of interest statement

The authors declare no competing interests.

Figures

Fig. 1
Fig. 1. Bd1075 generates the curvature of B. bacteriovorus HD100 predator cells.
a Phase-contrast images of attack-phase B. bacteriovorus cells showing the curvature of wild-type (WT) HD100 cells in comparison to non-vibrioid ∆bd1075 cells. Images are representative of cells from at least 5 biological repeats. Scale bars = 2 µm. b Transmission electron micrographs of WT HD100 and ∆bd1075 cells stained with 0.5% uranyl acetate. Scale bars = 1 µm. Images are representative of 3 biological repeats. c Curvature measurements of B. bacteriovorus attack-phase cells. n = 2503 cells (WT HD100), 2149 cells (∆bd1075), 1920 cells (∆bd1075 (pbd1075HD100)), or 2269 cells (∆bd1075 (pEV)) from 3 biological repeats. Error bars represent 95% confidence intervals of the median. ns non-significant (p > 0.05), ****p < 0.0001; Kruskal–Wallis test with Dunn’s multiple comparisons. Frequency distributions are included in Supplementary Fig. 5a. Source Data are provided as a Source Data file.
Fig. 2
Fig. 2. Prey attachment and entry times of B. bacteriovorus wild-type and ∆bd1075.
a Schematic to illustrate the measurement of attachment and entry times. Attachment time: number of frames (1 frame = 1 min) between initial predator attachment to prey and the first sign of predator entry into prey (stages 1–2). Entry time: number of frames between the first sign of predator entry and the predator residing completely inside the prey bdelloplast (stages 2–4). b Duration of attachment to and c entry into E. coli S17-1 prey by B. bacteriovorus HD100 wild-type (WT), ∆bd1075, and ∆bd1075 complemented by single-crossover reintroduction of the bd1075HD100 gene into the genome of the mutant: ∆bd1075 (comp), measured by time-lapse microscopy. n = 90 cells, with 30 cells analyzed from each of 3 biological repeats. Box: 25th to 75th percentiles; whiskers: range min-max; box line: median; ns: non-significant (p > 0.05); ****p < 0.0001; Kruskal–Wallis test with Dunn’s multiple comparisons. Additional data plots are included in Supplementary Fig. 8, Supplementary Fig. 9, and Supplementary Fig. 10. Examples of B. bacteriovorus invasions are shown in Supplementary Fig. 11 and Supplementary Movies 1 (WT), 2 (∆bd1075) and 3 (∆bd1075 (comp)). Source Data are provided as a Source Data file.
Fig. 3
Fig. 3. Intrabacterial growth and bdelloplast topology effects of B. bacteriovorus strains.
a Growth of B. bacteriovorus wild-type (WT) and Δbd1075 strains inside E. coli S17-1 pZMR100 prey bdelloplasts. B. bacteriovorus strains express the cytoplasmic fusion protein Bd0064-mCerulean3 to allow visualization of intraperiplasmic predator cells. T = hours elapsed since predators and prey were mixed. Scale bars = 2 µm. Images are representatives of cells from 3 biological repeats. b Curvature of B. bacteriovorus WT and Δbd1075 strains during predation upon E. coli S17-1 pZMR100 as depicted in a. Error bars represent standard error of the mean. ****p < 0.0001; two-tailed Mann–Whitney test. c Examples of Δbd1075 cells which appear to stretch and deform the E. coli prey bdelloplast at T = 2.5 h during 3 repeats of predatory timecourses as shown in a. These represented ~9.2% of total bdelloplasts. Scale bars = 2 µm. d Area, e circularity, f length, and g width of E. coli prey bdelloplasts during predation by WT or Δbd1075 predators. For data in cg, n = 169 cells (1 h), 134 cells (1.5 h), 150 cells (2 h), and 160 cells (2.5 h) for the wild-type strain and n = 205 cells (1 h), 160 cells (1.5 h), 245 cells (2 h), and 250 cells (2.5 h) for Δbd1075 from 3 biological repeats. Error bars represent standard error of the mean. ns non-significant (p = 0.053); **p = 0.0039 (Area) or p = 0.0083 (Length), *p = 0.031; two-tailed Mann–Whitney test. Data presented with medians +95% CI and full data distributions are shown in Supplementary Figs. 12 and 13, respectively. Source Data are provided as a Source Data file.
Fig. 4
Fig. 4. Muropeptide composition of B. bacteriovorus HD100.
ad Muropeptide elution profiles obtained by HPLC. Peptidoglycan sacculi were isolated from attack-phase B. bacteriovorus cells. a Wild-type (WT) HD100, bbd1075, cbd1075 (pbd1075HD100)—bd1075HD100 expressed in ∆bd1075, and dbd1075 (pEV)—empty vector control in ∆bd1075. Sacculi were digested by cellosyl and the resulting muropeptides were reduced with sodium borohydride and analyzed by HPLC. Representative chromatograms of 2 biological repeats are shown. e HPLC muropeptide elution profiles of ∆bd1075 sacculi treated with either purified Bd1075HD100 enzyme (above) or buffer control (below). Data are from 1 biological repeat. f Structures of the seven main muropeptide fractions. Numbers correspond to those above peaks in ae and were assigned based on the retention times of corresponding known E. coli muropeptides. G: N-acetylglucosamine, M: N-acetylmuramitol, L-Ala: L-alanine, D-iGlu: D-glutamic acid, meso-Dap: meso-diaminopimelic acid, D-Ala: D-alanine. Minor peaks are annotated in Supplementary Fig. 17 (for ad) and Supplementary Fig. 16a (for e) and were assigned by mass spectrometry analysis (Supplementary Table 2).
Fig. 5
Fig. 5. Structure of Bd1075 and features different to other characterized LD-CPase enzymes.
a Two orthogonal views of the Bd1075 fold, with catalytic residue C156 in space-fill form and features labeled. b Close-up view of the Bd1075 LD-CPase catalytic domain with selected residues that form the active site pocket displayed in stick form. c Close-up view of the Bd1075 NTF2 pocket, demonstrating complexation of a loop (residues 106–109 colored yellow, P107 and K108 in stick form) from a neighboring molecule in the crystal lattice. d Comparison of Bd1075 (red, 7O21: https://www.rcsb.org/structure/7O21), Csd6 (white, 4XZZ: https://www.rcsb.org/structure/4XZZ), and Pgp2 (gray, 6XJ6: https://www.rcsb.org/structure/6XJ6) structures. Helix 3 of the Bd1075 NTF2 domain (labeled ‘nH3’) and the associated loop (‘lip’) are relatively closer to the NTF2 pocket than the respective features of Csd6/Pgp2. e Close-up of the NTF2 terminus from structural alignment in d, demonstrating the relative extension of the Bd1075 C-terminus (colored yellow, includes NTF2 pocket-forming residue W303) in comparison to the shorter Csd6/Pgp2 termini (end residue colored green). The relative shifts of the nH3 helix and lip loop to constrict the NTF2 pocket are denoted by dashed arrows.
Fig. 6
Fig. 6. The NTF2 domain is required to target Bd1075 to the convex cell face and generate curvature.
a B. bacteriovorus Bd1075-mCherry double-crossover (DXO) attack-phase cells (left), showing the localization of wild-type Bd1075-mCherry to the convex cell face, and representative of 3 biological repeats. Dashed boxed region is shown in a close-up (middle). Scale bars = 2 μm. Heatmap (right) depicts the location of wild-type Bd1075-mCherry foci detected in n = 1189 cells from 3 biological repeats. White-yellow = highest intensity, purple-black = lowest intensity. b Schematics of Bd1075-mCherry single-crossover constructs used in ce. Full-length: Residues 1–329 (wild-type complete protein) fused to mCherry, A304: Residues 1–304 (contains a completed NTF2 domain including the B. bacteriovorus-specific residue W303) fused to mCherry, E302: Residues 1–302 (does not complete the NTF2 domain) fused to mCherry, C156A: Residues 1–329 (full-length with a point mutation of C156A in the catalytic LD-CPase domain) fused to mCherry, and Y274A: Residues 1–329 (full-length with a point mutation of Y274A in the NTF2 domain) fused to mCherry. c, d Bd1075-mCherry single-crossover constructs introduced into either B. bacteriovorus HD100 c wild-type (contains a native wild-type copy of bd1075) or d Δbd1075 (lacking a wild-type copy of bd1075). Attack-phase cell images and adjacent heatmaps show targeting of Bd1075-mCherry. Images and heatmaps were generated from 3 biological repeats (n = number of cells analyzed). Scale bars = 2 μm. e Curvature measurements of B. bacteriovorus Δbd1075 attack-phase cells containing different single-crossover Bd1075-mCherry fusions. n = 2099 cells (WT HD100), 1886 cells (Δbd1075), 2577 cells (Δbd1075 (FullmCh)), 2170 cells (Δbd1075 (A304mCh)), 2812 cells (Δbd1075 (E302mCh)), 2083 cells (Δbd1075 (C156AmCh)), or 2523 cells (Δbd1075 (Y274AmCh)) per strain from 3 biological repeats. Error bars represent 95% confidence intervals of the median. All pairwise comparisons between strains (except for Δbd1075 vs Δbd1075 (C156AmCh) were significant (p < 0.0001; Kruskal–Wallis test with Dunn’s multiple comparisons). Frequency distributions are included in Supplementary Fig. 5c. Source Data are provided as a Source Data file.

References

    1. Stolp H, Starr MP. Bdellovibrio bacteriovorus gen. et sp. n., a predatory, ectoparasitic, and bacteriolytic microorganism. Antonie Van. Leeuwenhoek. 1963;29:217–248. - PubMed
    1. Dashiff A, Junka RA, Libera M, Kadouri DE. Predation of human pathogens by the predatory bacteria Micavibrio aeruginosavorus and Bdellovibrio bacteriovorus. J. Appl. Microbiol. 2011;110:431–444. - PubMed
    1. Kadouri DE, To K, Shanks RM, Doi Y. Predatory bacteria: a potential ally against multidrug-resistant Gram-negative pathogens. PLoS ONE. 2013;8:e63397. - PMC - PubMed
    1. Atterbury RJ, et al. Effects of orally administered Bdellovibrio bacteriovorus on the well-being and Salmonella colonization of young chicks. Appl. Environ. Microbiol. 2011;77:5794–5803. - PMC - PubMed
    1. Shatzkes K, et al. Predatory bacteria attenuate Klebsiella pneumoniae burden in rat lungs. MBio. 2016;7:e01847-16. - PMC - PubMed

Publication types

MeSH terms