. 2022 Mar;28(3):513-516.
doi: 10.1038/s41591-022-01735-0. Epub 2022 Mar 21.

Whole-genome risk prediction of common diseases in human preimplantation embryos

Affiliations

Whole-genome risk prediction of common diseases in human preimplantation embryos

Akash Kumar et al. Nat Med. 2022 Mar.

Abstract

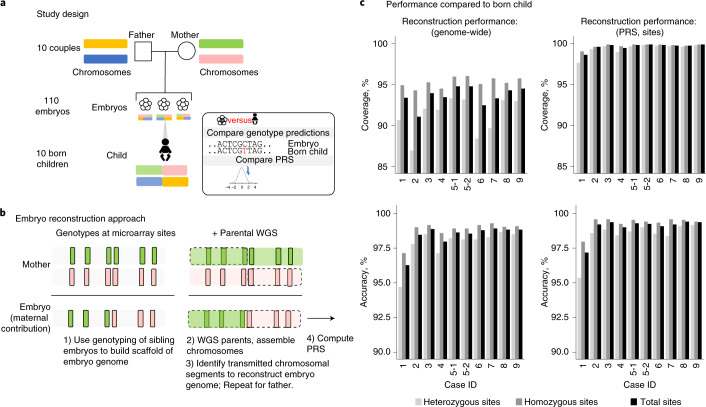
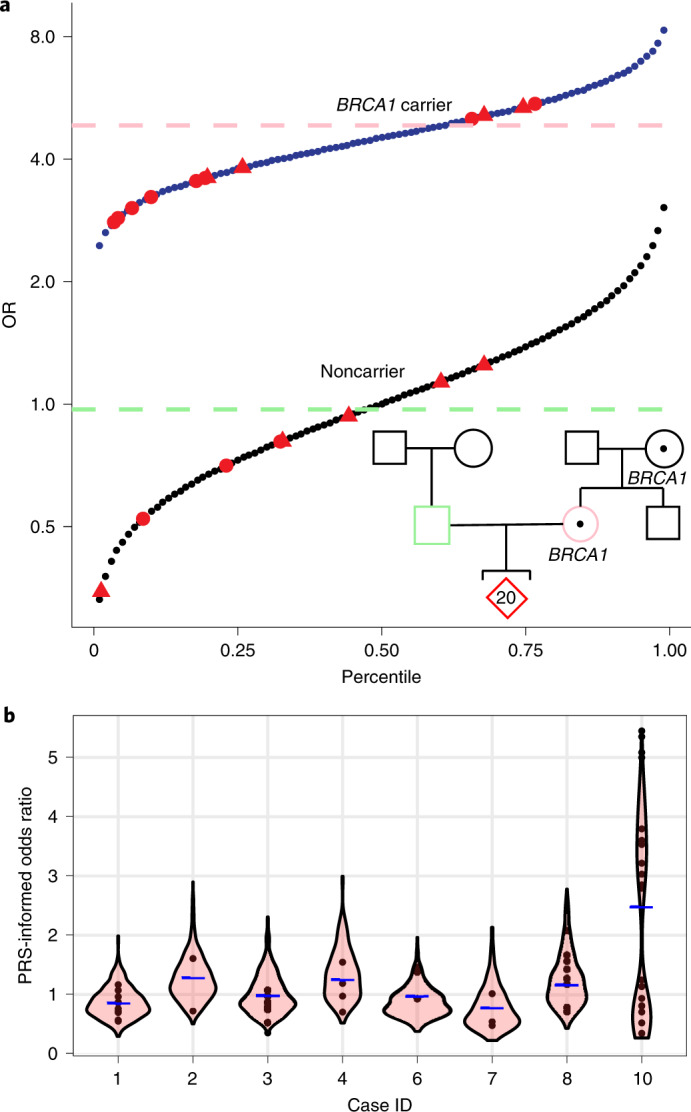
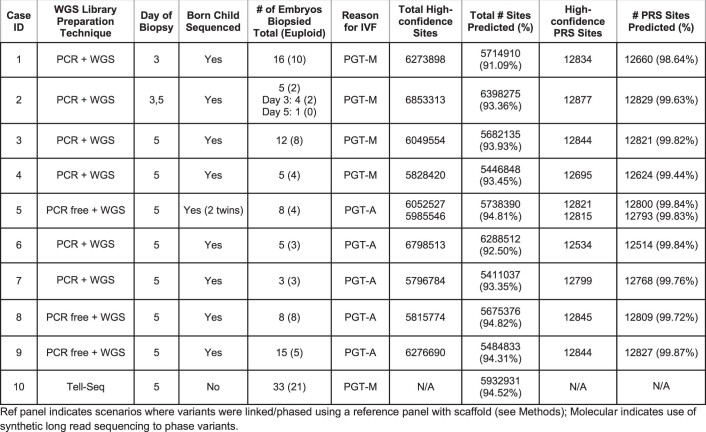
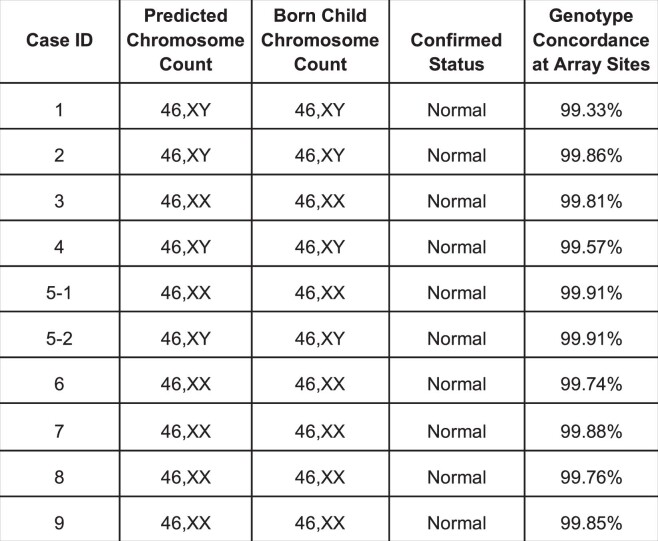
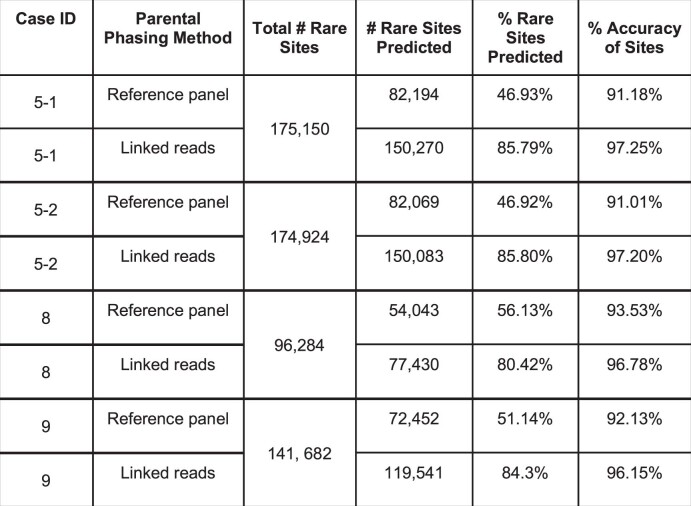
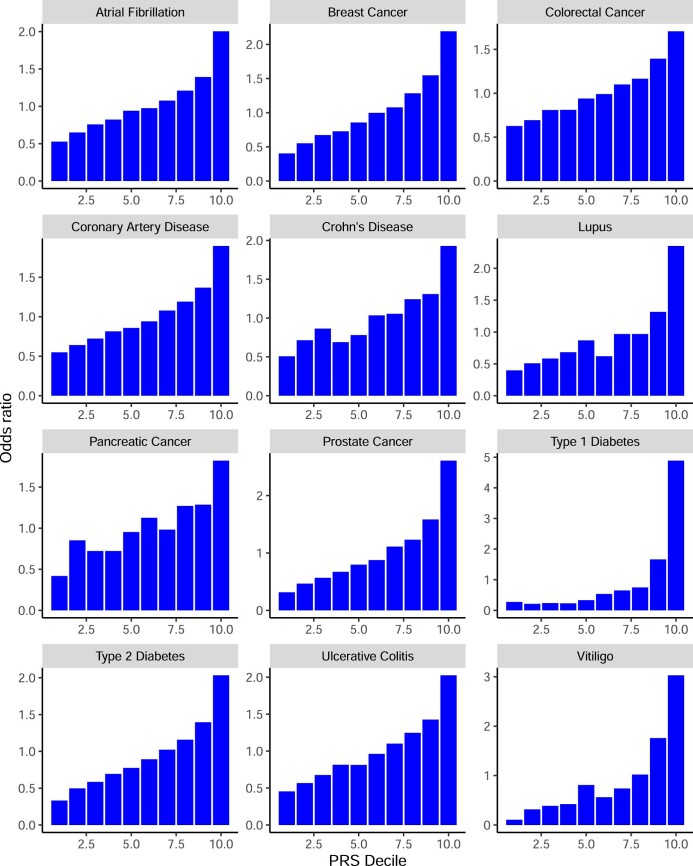
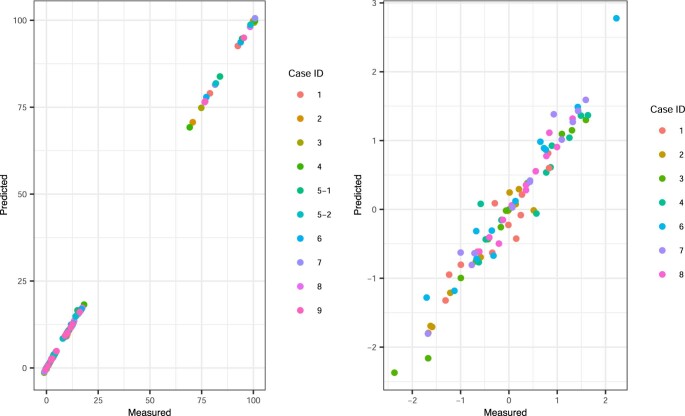
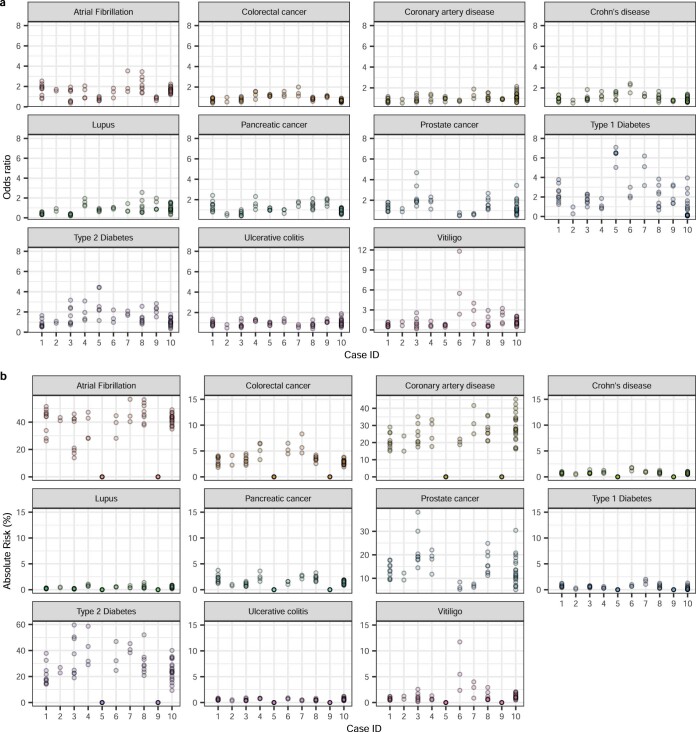
Preimplantation genetic testing (PGT) of in-vitro-fertilized embryos has been proposed as a method to reduce transmission of common disease; however, more comprehensive embryo genetic assessment, combining the effects of common variants and rare variants, remains unavailable. Here, we used a combination of molecular and statistical techniques to reliably infer inherited genome sequence in 110 embryos and model susceptibility across 12 common conditions. We observed a genotype accuracy of 99.0-99.4% at sites relevant to polygenic risk scoring in cases from day-5 embryo biopsies and 97.2-99.1% in cases from day-3 embryo biopsies. Combining rare variants with polygenic risk score (PRS) magnifies predicted differences across sibling embryos. For example, in a couple with a pathogenic BRCA1 variant, we predicted a 15-fold difference in odds ratio (OR) across siblings when combining versus a 4.5-fold or 3-fold difference with BRCA1 or PRS alone. Our findings may inform the discussion of utility and implementation of genome-based PGT in clinical practice.


Conflict of interest statement

A.K., K.I., J.S., O.S., T.T., D.H. and M.R. are either current or previous employees of, and M.B., G.G., P.C.N., B.L. and L.G. are either current or previous consultants with, MyOme. M.R., D.K., M.B. and M.K. are current employees of Natera. The remaining authors declare no competing interests.

Figures

Fig. 1
Fig. 1. WGR and approach.
a, This research study involved reconstruction of 110 embryo genomes from 10 couples and comparison to the genome sequence of the born child. Twelve PRS models were computed from the born-child samples and the 10 corresponding reconstructed embryos and compared for concordance. b, WGR involves whole-genome sequencing (WGS) of prospective parents and single-nucleotide polymorphism (SNP) microarray genotyping of sibling embryos (Methods and Supplemental Note 1). Allele measurements at each SNP are color-coded based on the parental haplotype of origin illustrated in a. A combination of molecular and statistical/population-based techniques phase the parents’ chromosomes, infer the locations of meiotic recombination for each embryo and correct errors introduced in the process of testing single-cell or few-cell embryo biopsies (Methods). Reconstructed embryo whole genomes are used to predict common disease risk by calculating PRSs and inferring the inheritance of rare variants with high impact on disease risk. c, Performance by comparing genotypes from WGR with the born child’s DNA shows genotype accuracies ranging from 99.0% to 99.4% at sites used in polygenic prediction in day-5 embryos and 97.2% to 99.1% in day-3 embryos. Case 1 includes only day-3 embryos, and case 2 includes both day-3 and day-5 embryos. All other cases included day-5 embryos only. Statistics are subdivided by genotype (heterozygous or homozygous) in the born child.
Fig. 2
Fig. 2. Intra- and interfamilial differences in predicted genetic risk for breast cancer susceptibility.
a, Integrated polygenic/monogenic prediction in research participants with family history of breast cancer, BRCA1 variant and multiple embryos (red). Thirteen embryos carried a pathogenic BRCA1 variant. Using a logistic model fit on over 22,000 individuals in the UKB with relevant clinical and genetic information using PRS and carrier status as separate variables, we predicted the odds of disease for each embryo as per Fahed et al.. The blue line indicates OR as a function of PRS for BRCA1 carriers, and the black line indicates OR for noncarriers. The method accounts for the reduction in effect of PRS in the context of positive BRCA1 status, captured in the difference in slope of the two lines. The female participant’s PRS is shown as a pink dashed line, and the male participant’s PRS is shown as a green dashed line (projected as female risk for comparison). Similarly, male embryos (triangles) are shown separately. b, Genomic risk for breast cancer is shown across ten couples and their embryos. Predicted genetic disease risk for each embryo (circles) is shown along with a violin-plot distribution of results from 500 simulated embryos (as described in Methods), with average parental PRS shown as a blue dash. Inheritance of a pathogenic BRCA1 variant (a) accounts for increased variability and a bimodal distribution in breast cancer disease risk for case 10.
Extended Data Fig. 1
Extended Data Fig. 1. Summary of PGT assays performed.
A total of 29 individuals were sequenced on a variety of sequencing platforms. PGT from embryo biopsies were performed by a commercial lab (Natera, formerly Gene Security Network) on the HumanCytoSNP-12 BeadChip array, ranging from 3 to 33 embryos. Coverage and accuracy assessed at genomic positions that are high-confidence genotype calls in parents and born child.
Extended Data Fig. 2
Extended Data Fig. 2. Prediction of aneuploidy and genotypes across embryos and comparison with born children.
Genotype predictions at chromosomal microarray positions for each embryo were compared to genotypes measured from WGS of the born child. Predictions obtained using SNP Array and Parental Support.
Extended Data Fig. 3
Extended Data Fig. 3. Performance of whole-genome reconstruction on individually rare variants using synthetic long-read sequencing as a method to phase parents.
This method was performed on the parental genomes in 4 cases (Case ID 5, 8, 9 and 10). Accuracy could not be assessed for Case ID10 as no born child was available for comparison. Variants with an allele frequency <0.1% or not present in the gnomAD database were considered rare. Only high-confidence variants (as described in Methods) from both Tell-Seq and PCR-free WGS protocols were evaluated.
Extended Data Fig. 4
Extended Data Fig. 4. Performance of polygenic risk score in UK Biobank cohort of adults.
Empirical odds ratios per decile of PRS score calculated in British White individuals in the UK Biobank.
Extended Data Fig. 5
Extended Data Fig. 5. Correlation of polygenic risk score from embryo predictions and born child.
a, Illustrates the close correlation between predicted and measured (born child) raw polygenic risk score, consistent with genotype concordance between predicted and measured polygenic risk. b, Correlation between predicted and measured z-score derived from raw polygenic risk score (r2=0.947). Case IDs 5 and 9 were excluded from this analysis as the approach to mean-center polygenic risk using population ancestry is unable to account for admixture.
Extended Data Fig. 6
Extended Data Fig. 6. Variability in predicted disease risk across 11 additional conditions.
a, Predicted relative risk of disease. b, Predicted absolute disease risk. Autoimmune conditions (Type 1 diabetes, Vitiligo) exhibit greater variability in predicted disease risk as has been previously reported. Note: Risk for the embryo in case ID 7 carrying the APC risk allele, rs1801155, is based solely on that allele. A competing hazards method (Gail et al 1989) was used to calculate the absolute risk for atrial fibrillation, coronary artery disease, prostate cancer and Type 2 diabetes. Age- and ethnicity-specific overall and disease specific mortality rates were taken from the CDC Wonder database (Underlying Cause of Death 1999–2019). Individuals with >20% admixture of African/Asian ancestry as determined using ELAI software were not considered in this analysis.
Extended Data Fig. 7
Extended Data Fig. 7. Obtaining a phased parental genome.
Each parent’s genome is phased using PS parental haplotypes (see Supplemental Note 1) and population reference panels using SHAPEIT4. The PS parental haplotypes serve as a scaffold (step 1) consisting of approximately 200,000 variants. WGS of both parents are provisionally phased using population reference panels and compared with PS Parental Haplotypes. Overlapping positions between the parental support haplotypes and provisionally phased WGS are marked as having concordant (1) or discordant (0) phase (step 2) and grouped into blocks (step 3). Interval regions between these blocks are suggestive of either meiotic recombination or error in phasing one or both parents; these sites are discarded (positions marked with ‘X’ in step 3). All remaining sites are used in subsequent assembly of the ‘Phased Parental Genome’ (step 4).
Extended Data Fig. 8
Extended Data Fig. 8. Embryo reconstruction approach.
Phased parent genomes and parental support (PS) embryo genotypes are used to reconstruct the embryo’s genome at euploid chromosomes. The phased parent genomes are determined in Extended Data Fig. 7. One parent’s (parent 1) transmitted haplotypes are shown in pink (labeled 1 and 2) and the other parent’s (parent 2) phased haplotypes are shown in purple (labeled 3 and 4). In step 1, the embryo’s PS genotype determines which parental haplotype is transmitted to the embryo (dotted line). Missing data in the embryo or the parents’ phased genomes is excluded. In step 2, positions where genotypes are available from both parents are combined to create the predicted embryo genome; positions with missing data are excluded.
Extended Data Fig. 9
Extended Data Fig. 9. Normalization of polygenic risk scores.
Polygenic risk scores before (left) and after (right) centering and standardization for 5 populations within the UK Biobank. Standardized PRS scores have approximately zero mean and unit variance in each population.
Extended Data Fig. 10
Extended Data Fig. 10. Distributions of simulated embryo risk.
Comparison of simulated distributions of odds ratios assuming linked and unlinked neighboring SNPs for one study couple (case ID 3). Atrial fibrillation demonstrates a bimodal distribution with linked SNPs with several simulated children predicted to have an OR of 2, consistent with predictions made on embryos (Extended Data Fig. 6). Simulations on linked SNPs used an approach described in Methods and Caballero et al..

Comment in

Similar articles

Cited by

References

    1. Kumar A, et al. Whole genome prediction for preimplantation genetic diagnosis. Genome Med. 2015;7:35. doi: 10.1186/s13073-015-0160-4. - DOI - PMC - PubMed
    1. Handyside AH, et al. Validation and first clinical application of karyomapping for preimplantation diagnosis (PGD) of Gaucher disease combined with 24 chromosome screening. Fertil. Steril. 2010;94:S79–S80. doi: 10.1016/j.fertnstert.2010.07.309. - DOI
    1. Treff NR, et al. Preimplantation genetic testing for polygenic disease relative risk reduction: evaluation of genomic index performance in 11,883 adult sibling pairs. Genes (Basel) 2020;11:648. doi: 10.3390/genes11060648. - DOI - PMC - PubMed
    1. Treff NR, et al. Utility and first clinical application of screening embryos for polygenic disease risk reduction. Front. Endocrinol. 2019;10:845. doi: 10.3389/fendo.2019.00845. - DOI - PMC - PubMed
    1. Karavani E, et al. Screening human embryos for polygenic traits has limited utility. Cell. 2019;179:1424–1435. doi: 10.1016/j.cell.2019.10.033. - DOI - PMC - PubMed

Publication types