. 2022 May;605(7908):146-151.
doi: 10.1038/s41586-022-04630-3. Epub 2022 Mar 21.

Eicosanoid signalling blockade protects middle-aged mice from severe COVID-19

Affiliations

Eicosanoid signalling blockade protects middle-aged mice from severe COVID-19

Lok-Yin Roy Wong et al. Nature. 2022 May.

Abstract

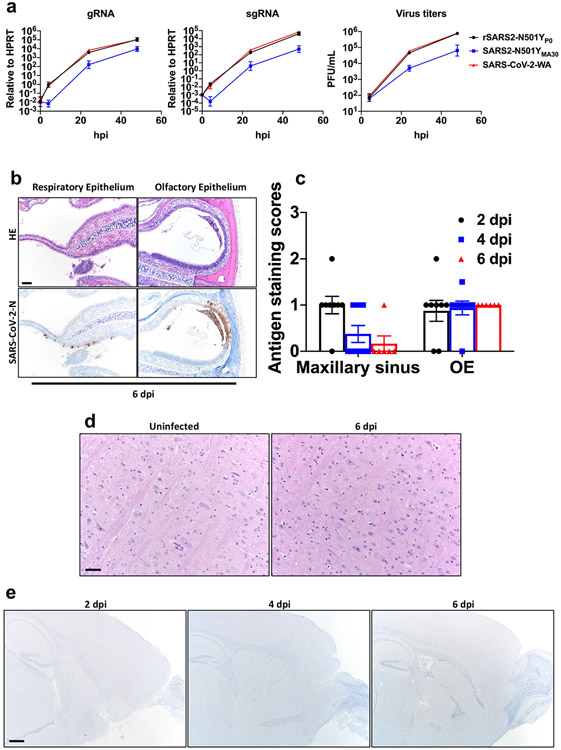
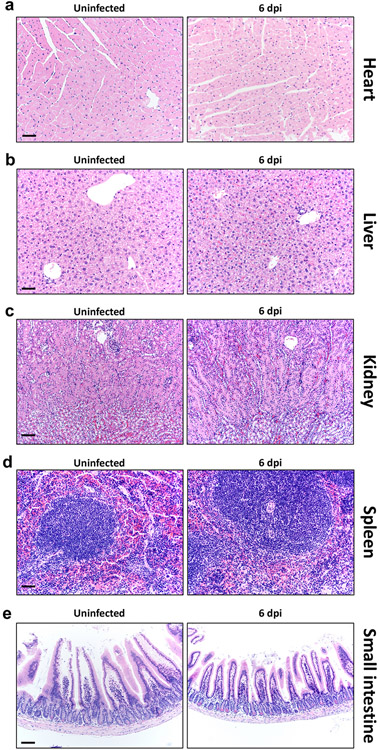
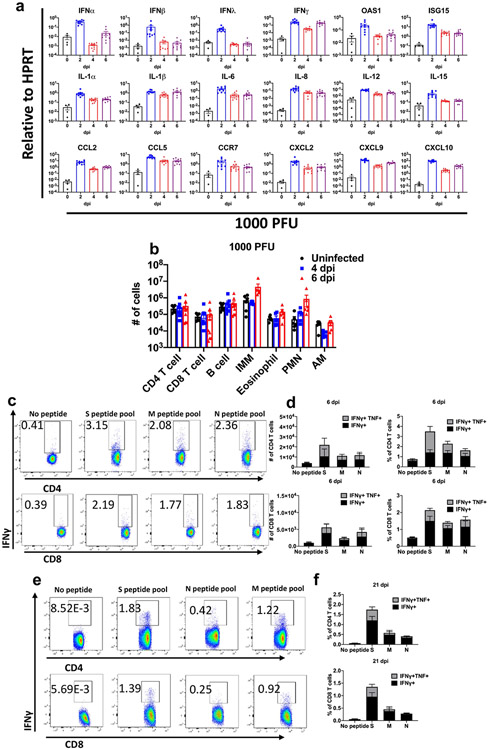
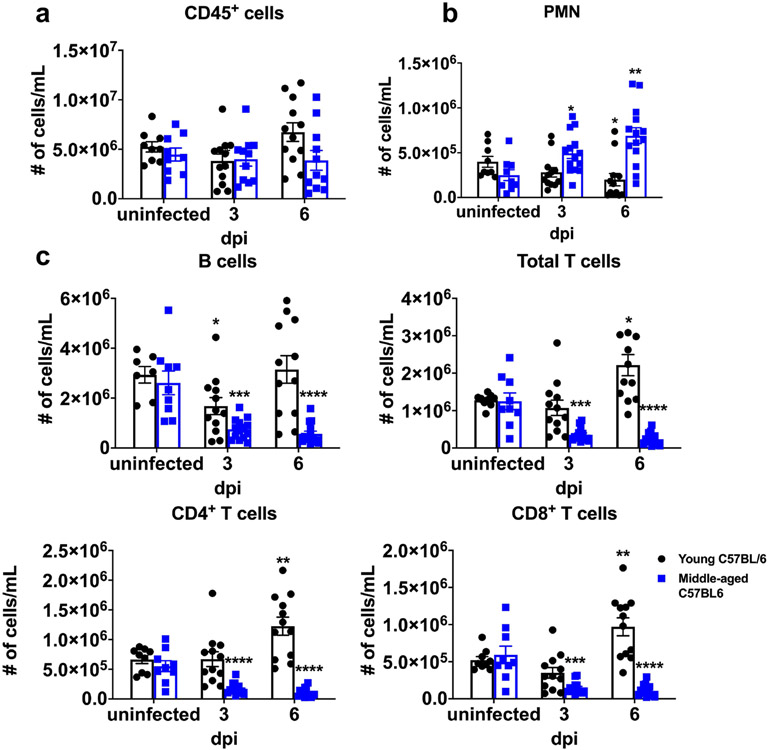
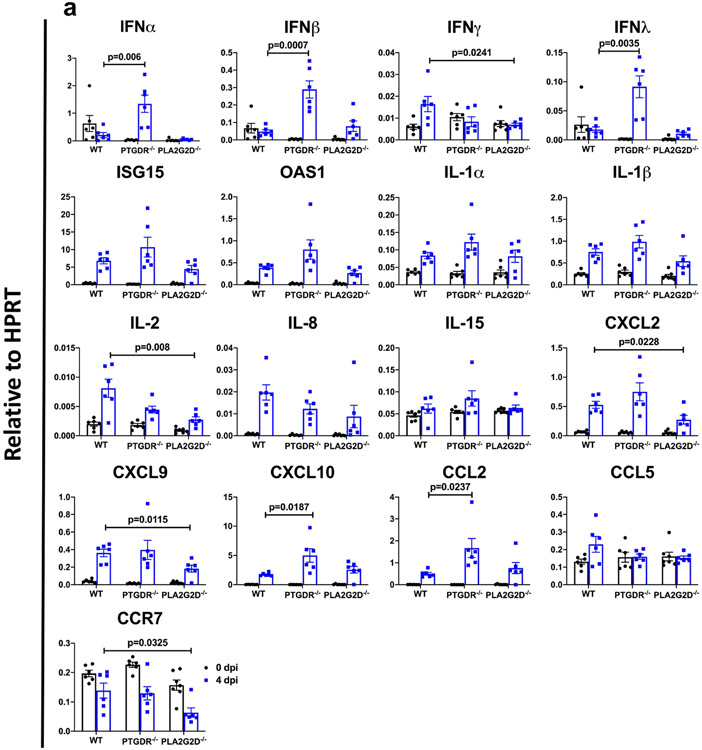
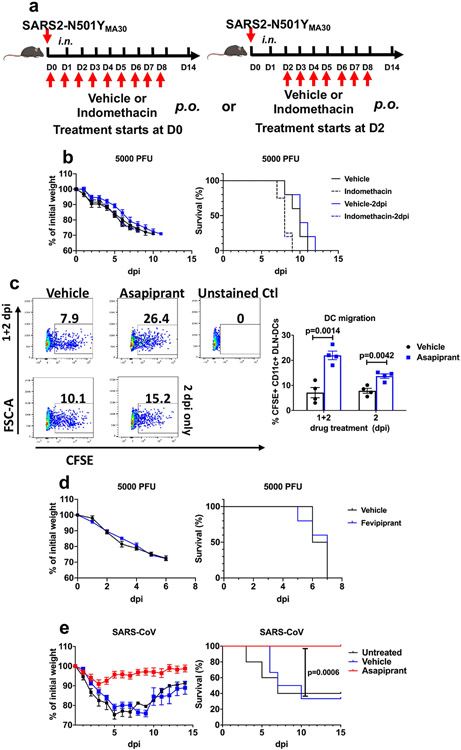
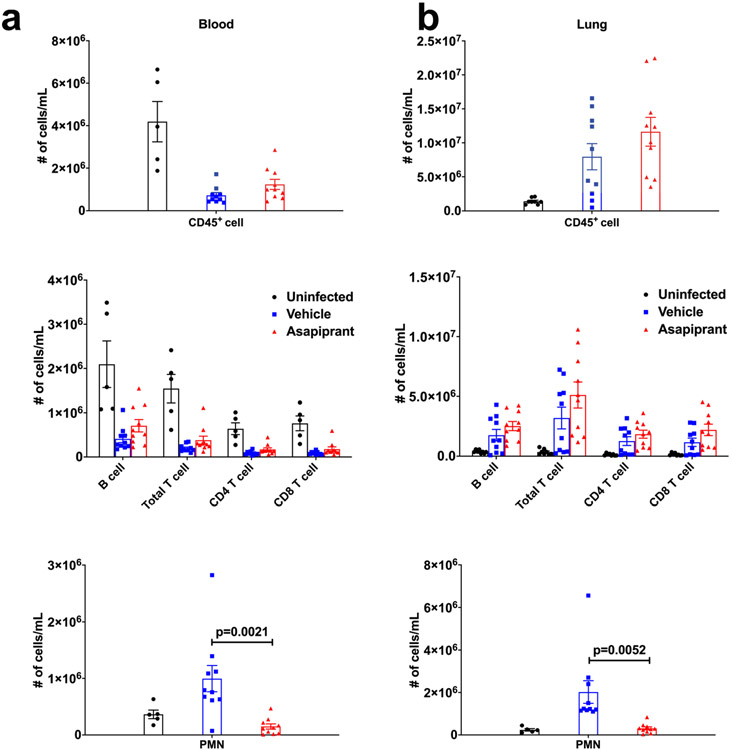
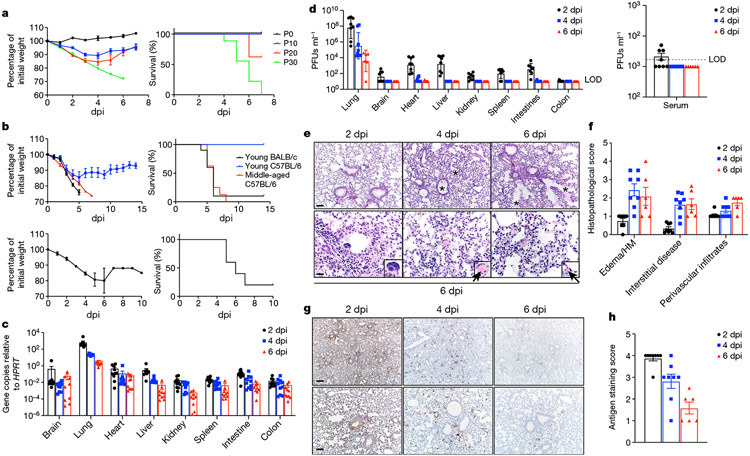
Coronavirus disease 2019 (COVID-19) is especially severe in aged populations1. Vaccines against severe acute respiratory syndrome coronavirus 2 (SARS-CoV-2) are highly effective, but vaccine efficacy is partly compromised by the emergence of SARS-CoV-2 variants with enhanced transmissibility2. The emergence of these variants emphasizes the need for further development of anti-SARS-CoV-2 therapies, especially for aged populations. Here we describe the isolation of highly virulent mouse-adapted viruses and use them to test a new therapeutic drug in infected aged animals. Many of the alterations observed in SARS-CoV-2 during mouse adaptation (positions 417, 484, 493, 498 and 501 of the spike protein) also arise in humans in variants of concern2. Their appearance during mouse adaptation indicates that immune pressure is not required for selection. For murine SARS, for which severity is also age dependent, elevated levels of an eicosanoid (prostaglandin D2 (PGD2)) and a phospholipase (phospholipase A2 group 2D (PLA2G2D)) contributed to poor outcomes in aged mice3,4. mRNA expression of PLA2G2D and prostaglandin D2 receptor (PTGDR), and production of PGD2 also increase with ageing and after SARS-CoV-2 infection in dendritic cells derived from human peripheral blood mononuclear cells. Using our mouse-adapted SARS-CoV-2, we show that middle-aged mice lacking expression of PTGDR or PLA2G2D are protected from severe disease. Furthermore, treatment with a PTGDR antagonist, asapiprant, protected aged mice from lethal infection. PTGDR antagonism is one of the first interventions in SARS-CoV-2-infected animals that specifically protects aged animals, suggesting that the PLA2G2D-PGD2/PTGDR pathway is a useful target for therapeutic interventions.


Figures

Extended Data Fig. 1 ∣
Extended Data Fig. 1 ∣. Infection of human respiratory cells and distribution of SARS2-N501YMA30 antigen in sinonasal cavity and brain.
a, Quantification of genomic RNA (gRNA), subgenomic RNA (sgRNA) and virus titers in Calu-3 cells at the indicated times after infection with 0.01 MOI of the indicated viruses. Data in a are geometric mean ± geometric SD and are representative of two independent experiments. b, Sinonasal cavity from young BALB/c mice infected with 5000 PFU of SARS2-N501YMA30, H&E stain (top panels). Regions of respiratory epithelium and olfactory epithelium exhibited uncommon regional scattered (bottom-left panel) to localized SARS-CoV-2 nucleocapsid immunostaining, (bottom panels). Scale bar 90 μm. OE: olfactory epithelium. c, Summary scores of nucleocapsid staining, as described in Methods (n = 8 at 2, 4 dpi; n = 6 at 6 dpi). Data in c are mean ± s.e.m. d, Brains from uninfected or infected young BALB/c mice at 6 dpi lacked overt lesions, H&E stain. Scale bar 45 μm. e, Brains from uninfected mice or young BALB/c mice infected with 5000 PFU at 2,4, and 6 dpi revealed no SARS-CoV-2 nucleocapsid immunostaining. Scale bar 460 μm. Data were pooled from two independent experiments. Data in b,d are representative of two independent experiments with similar results.
Extended Data Fig. 2 ∣
Extended Data Fig. 2 ∣. Histological analysis of extrapulmonary tissue.
Mice infected with 5000 PFU of SARS2-N501YMA30 were sacrificed at 6 dpi with 5000 PFU of SARS2-N501YMA30 and tissues were prepared for histological examination. Tissues from uninfected mice were analyzed in parallel. ae, heart (a), liver (b), kidney (c), spleen (d), and small intestine (e) were studied. No overt, group-specific lesions were observed. Scale bars, 45 μm (a, b, d) and 90 μm (c, e), H&E stain. Two sections of each organ from 6 mice per group were evaluated. Representative images from two independent experiments are shown.
Extended Data Fig. 3 ∣
Extended Data Fig. 3 ∣. Inflammatory mediators and immune effector cells in infected lungs.
Mice were infected with 1000 PFU SARS2-N501YMA30 to ensure survival until 6 dpi. a, Cytokine and chemokine transcripts were measured by qRT–PCR after isolation of RNA from the lungs of uninfected (0 dpi) and infected young BALB/c mice. Each lung was collected from an individual mouse. Mock (0 dpi), n = 4; 2, 4, and 6 dpi, n = 10. b, Quantification of immune cells (as gated in Supplementary Fig. 1) in the lungs (n = 6 for uninfected group; n = 9 for CD4, CD8 and B cells; n = 6 for IMM, eosinophils, PMNs and AM, for both 4 and 6 dpi) each lung was collected from an individual mouse). IMM: inflammatory monocytes/macrophages; PMN: neutrophils; AM: alveolar macrophages. c, e, Representative FACS plots of IFNγ+ CD4 and CD8 T cells after stimulation with indicated peptide pools in the lungs of young BALB/c mice at 6 (c) and 21 (e) dpi. d, f, Summary data for IFNγ and TNF expression are shown (n = 5, 6 dpi; n = 4, 21 dpi). Data in a, b, d are mean ± s.e.m. a and b are pooled data from two independent experiments. Data in c-f are from one of two independent experiments.
Extended Data Fig. 4 ∣
Extended Data Fig. 4 ∣. Lymphopenia in SARS2-N501YMA30-infected middle-aged mice.
Numbers of immune cells in the blood of young and middle-aged C57BL/6 mice at 3 and 6 days after infection with 5000 PFU of SARS2-N501YMA30 (n = 9 for uninfected controls in both groups; n = 14 for middle-aged mice at 3 and 6 dpi; n = 12 for young mice at 3 and 6 dpi). a. CD45+ cells; b. PMN: Polymorphonuclear cells. c. B and T cells. P values determined by two-tailed Student’s t test. P values indicated are determined from the corresponding time point compared to uninfected control of the same group. P = 0.0483 (6 dpi vs uninfected, young C57BL/6; PMN); P = 0.0117 (3 dpi vs uninfected, middle-aged C57BL/6, PMN); P = 0.0016 (6 dpi vs uninfected, middle-aged C57BL/6, PMN); P = 0.0264 (3 dpi vs uninfected, young C57BL/6; B cells); P = 0.0001 (3 dpi vs uninfected, 6 dpi vs uninfected middle-aged C57BL/6, B cells); P = 0.0109 (6 dpi vs uninfected, young C57BL/6; Total T cells); P = 0.0001 (3 dpi vs uninfected, middle-aged C57BL/6, Total T cells); P < 0.0001 (6 dpi vs uninfected, middle-aged C57BL/6, Total T cells); P = 0.0072 (6 dpi vs uninfected, young C57BL/6; CD4+ T cells); P < 0.0001 (3 dpi vs uninfected, 6 dpi vs uninfected, middle-aged C57BL/6, CD4+ T cells); P = 0.0065 (6 dpi vs uninfected, young C57BL/6; CD8+ T cells); P = 0.0001 (3 dpi vs uninfected, middle-aged C57BL/6, CD8+ T cells); P < 0.0001 (6 dpi vs uninfected, middle-aged C57BL/6, CD8+ T cells). *P ≤ 0.05, **P ≤ 0.01, ***P ≤ 0.001, ****P ≤ 0.0001. Data in a are mean ± s.e.m. Data are pooled from two independent experiments.
Extended Data Fig. 5 ∣
Extended Data Fig. 5 ∣. Cytokine and chemokine expression profile in middle-aged WT, PTGDR−/− or PLA2G2D−/− C57BL/6 mice after SARS2-N501YMA30 infection.
a, Middle-aged WT, PTGDR−/− and PLA2G2D−/− C57BL/6 mice were infected with 5000 PFU SARS2-N501YMA30. Cytokine and chemokine transcripts were detected by qRT–PCR from the lungs of uninfected (0 dpi) and infected mice at 4 dpi. Each lung was collected from an individual mouse. n = 6 for all groups at 0 and 4 dpi except for PLA2G2D−/− mice at 0 dpi where n = 7. Data are mean ± s.e.m. Data are pooled from two independent experiments.
Extended Data Fig. 6 ∣
Extended Data Fig. 6 ∣. Effects of asapiprant, indomethacin and fevipiprant in aged mice infected with SARS-CoV-2 or SARS-CoV.
a, Schematic showing experimental design for results shown in panel b (mouse image with BioRender. com). b, Percentage of initial weight and survival of middle-aged C57BL/6 mice infected with 5000 PFU of SARS2-N501YMA30 after indomethacin treatment (n = 5 in all groups except in the group when indomethacin was given at 0 dpi, where n = 4). c, Middle-aged C57BL/6 mice were instilled with CFSE intranasally 6 h before infection with 5000 PFU of SARS2-N501YMA30. One group of mice received vehicle or asapiprant at 1 and 2 dpi (1+2) while another group of mice received drug treatment only at 2 dpi (2). Mice were euthanized at 3 dpi and lung draining lymph node (DLN; mediastinal) were harvested and analyzed with flow cytometry. rDC migration from the lung to DLN was measured as the frequency of CFSE+CD11c+ cells in the DLN (n = 4). d, Percentage of initial weight and survival of middle-aged C57BL/6 mice infected with 5000 PFU of SARS2-N501YMA30 with fevipiprant (CRTH2 inhibitor) treatment (two times a day; days 2 to 8; 5 mg/kg) (n = 4, vehicle; n = 5, fevipiprant). e, Percentage of initial weight and survival of middle-aged C57BL/6 mice infected with 104 PFU of SARS-CoV, with vehicle or asapiprant treatment from day 2 to 8 (n = 5, untreated; n = 12, vehicle and asapiprant). P values determined by two-tailed Student’s t test in a and log-rank (Mental-Cox) in e. Data are mean ± s.e.m. and are representative of at least two independent experiments.
Extended Data Fig. 7 ∣
Extended Data Fig. 7 ∣. Asapiprant reversed neutrophilia but not lymphopenia in infected mice.
Numbers of immune cells in the blood (a) and lung (b) of middle-aged C57BL/6 mice at 6 days after infection with 5000 PFU of SARS2-N501YMA30 with vehicle or asapiprant treatment starting at 2 dpi (n = 5 for uninfected controls; n = 10 vehicle- and asapiprant-treated mice). PMN: Polymorphonuclear neutrophils. P values determined by two-tailed Student’s t test. Data are mean ± s.e.m. Data are pooled from two independent experiments.
Fig. 1 ∣
Fig. 1 ∣. Clinical, virological and pathological disease in mice infected with SARS2-N501YMA30.
a, Weight (left) and survival (right) of young BALB/c mice infected with passage (P) 0 (n = 3; 105 PFUs), P10 (n = 8; 9,000 PFUs), P20 (n = 8; 9,000 PFUs) or P30 (n = 9; 5,000 PFUs) SARS-CoV-2. P refers to the number of mouse lung passages. b, Weight (left panels) and survival (right panels) of young BALB/c (n = 10), young C57BL/6 (n = 6) or middle-aged C57BL/6 (n = 8) mice infected with 5,000 PFUs of SARS2-N501YMA30 (upper panel). Weight (left) and survival (right) of middle-aged C57BL/6 (n = 5) mice infected with 5,000 PFUs of BAC-derived SARS2-N501YMA30 (lower panel). Data are representative of two independent experiments. Data in a and b (left) are mean ± s.e.m. c, d, Viral genomic RNA (c) and infectious viral titres (d) at 2, 4 and 6 dpi with 5,000 PFUs of SARS2-N501YMA30 (n = 10 at all time points in c; n = 8 at 2 and 4 dpi, and n = 6 at 6 dpi in d). Serum titres are shown in the right panel of d. LOD, limit of detection. Data in c and d are geometric mean ± geometric s.d. eh, Lungs from SARS2-N501YMA30-infected mice (n = 8 at 2 and 4 dpi; n = 6 at 6 dpi) were stained with haematoxylin and eosin (H&E) (e) or immunostained for SARS-CoV-2 nucleocapsid (g), and the pathological lesions and staining were quantified (f and h, respectively). e, Infected lungs exhibited airway edema (asterisks, top panels), multinucleated syncytial cells (inset in lower left panel), vascular thrombosis (arrows, insets in lower middle and right insets). Scale bars, 90 μm (top) and 22 μm (bottom); H&E stain. f, Summary scores of lung lesions (n = 8 at 2 and 4 dpi; n = 6 at 6 dpi). HM, hyaline membranes. g, Lungs from SARS2-N501YMA30-infected mice (n = 8 at 2 and 4 dpi; n = 6 at 6 dpi) were immunostained to detect SARS-CoV-2 nucleocapsid protein. Scale bars, 230 μm (top) and 90 μm (bottom). h, Summary scores of nucleocapsid immunostaining of lungs (n = 8 at 2 and 4 dpi; n = 6 at 6 dpi). Data in f and h are mean ± sem.
Fig. 2 ∣
Fig. 2 ∣. Analysis of alterations in SARS2-N501YMA30 that arise during mouse adaptation.
a, Schematic showing the genome of SARS-CoV-2. Initial N501Y alteration engineered into SARS-CoV-2 is shown in red. Viral proteins encoding alterations in SARS2-N501YMA30 are shaded in yellow and the corresponding alterations are highlighted in blue. ORF1a, open reading frame 1a. b, Summary of alterations that emerged in different virus passages. P30 virus is highlighted in green c, In silico modelling of the effects of alterations that emerged in serial mouse passaging on the affinity and stability of the S protein complexes with mACE2. d, Percentage of initial weight (left) and survival (right) of young BALB/c mice infected with viruses from two distinct plaque isolates purified from P30 virus. Virus from plaque 30.1 (black) encodes an extra alteration (E484K) in the S protein compared to virus from plaque 30.4 (blue) (n = 6 for both groups). e, Modelling of the receptor-binding interface between the S protein of 2019-nCoV/USA-WA1/2020 (left) and SARS2-N501YMA30 (right) viruses and mACE2 reveals critical interactions mediated by alterations that emerged through serial passaging. f, Percentage of initial weight (left) and survival (right) of young BALB/c mice and young or old C57BL/6 mice infected with 105 PFUs of B1.351 (n = 7 for young BALB/c; n = 8 for young C57BL/6; n = 9 for middle-aged C57BL/6). Data in d and f (left) are mean ± s.e.m.
Fig. 3 ∣
Fig. 3 ∣. Absence of PLA2G2D or PTGDR expression, or blocking PGD2/PTGDR signalling, inhibits SARS2-N501YMA30 infection in vivo.
a, Weight (left) and survival (right) of middle-aged WT (n = 8), Ptgdr−/− (n = 9) or Pla2g2d−/− (n = 9) C57BL/6 mice infected with 5,000 PFUs of SARS2-N501YMA30. b, Viral titres in lungs at 2 (n = 7) and 5 dpi (n = 7). P values were determined by a log-rank (Mantel–Cox) test (a) and a two-tailed Student’s t-test (b). P < 0.0001, Pla2g2d−/− versus WT; not significant, Ptgdr−/− versus WT (a). P < 0.0001, Pla2g2d−/− versus WT, 2 dpi; P < 0.0001, Ptgdr−/− versus WT and Pla2g2d−/− versus WT, 5 dpi (b). c, Lungs at 5 dpi from WT mice exhibited edema (marked with asterisks) and cellular infiltration/interstitial thickening whereas these were significantly reduced in lungs from Ptgdr−/− or Pla2g2d−/− mice. H&E stain. Scale bar, 40 μm. d, Summary scores (n = 6 for WT; n = 6 for Ptgdr−/−; n = 8 for Pla2g2d−/−). P values were determined by two-tailed Student’s t-test. P = 0.03, Ptgdr−/− versus WT and P = 0.0007, Pla2g2d−/− versus WT, edema/HM; P = 0.004, Pla2g2d−/− versus WT, interstitial disease. e, Asapiprant structure. f, Experimental design for g and k. Vehicle or asapiprant was administered orally at 2–8 dpi to middle-aged (gj) or young (k) C57BL/6 mice infected intranasally with SARS2-N501YMA30. g, Weight (left) and survival (right) of vehicle-treated (n = 10) or asapiprant-treated (n = 12) middle-aged mice. The P value was determined by a two-tailed Student’s t-test. P < 0.0001, asapiprant-treated versus vehicle-treated group. h, Lung viral titres of vehicle-treated (n = 8) or asapiprant-treated (n = 8) middle-aged mice at 5 dpi. The P value was determined by a two-tailed Student’s t-test. P < 0.0001, asapiprant-treated versus vehicle-treated group. i, The vehicle-treated group exhibited edema (asterisks) with occasional hyaline membranes (arrows), which were uncommon in asapiprant-treated mice at 5 dpi; H&E stain. Scale bar, 20 μm. j, Summary scores (n = 8 for vehicle-treated mice; n = 9 for asapiprant-treated mice). P values were determined by two-tailed Student’s t-test. P = 0.002, asapiprant-treated versus vehicle-treated group, edema/HM; P = 0.0002, asapiprant-treated versus vehicle-treated group, interstitial disease. HM, hyaline membranes. k, Weight (left) and survival (right) of vehicle-treated (n = 4) or asapiprant-treated (n = 4) young C57BL/6 mice infected with 5,000 PFUs of SARS2-N501YMA30. Data in a, d, g (left), j and k (left) are mean ± s.e.m. Data in b and h are geometric mean ± s.d.
Fig. 4 ∣
Fig. 4 ∣. Expression of PTGDS, PTGDR, PLA2G2D, PGD2, and 11β-PGF increases in human samples with age.
a, b, Expression of PGD2 genes (PTGDS (left panels) and PTGDR (right panels)) versus age in 103 healthy human lungs from GEO series GSE150910 (a) and 578 lungs from the GTEx project (b). The filled squares in b indicate the median expression for each age group. Expression levels of PTGDS and PTGDR were significantly associated with age in both studies (two-tailed Student’s t-test P values P = 0.0108 and 0.0305, respectively, in a; analysis of variance F-test P values P < 0.0001 and 0.0028, respectively, in b). TPM, transcripts per million. c, Dendritic cells derived from peripheral blood mononuclear cells from 6 young (24–39 years, mean 29 years) and 5 aged (56–73 years, mean 62 years) donors were mock infected or infected with SARS-CoV-2. Cells and supernatants were collected at 5 dpi. RNA isolated from cells was assessed for transcript levels of the indicated genes. d, Levels of the indicated prostaglandins in cell supernatants measured by enzyme-linked immunosorbent assay. Data in c, d are mean ± s.e.m. P values determined by two-tailed Student’s t-test (c, d).

References

    1. Channappanavar R & Perlman S Age-related susceptibility to coronavirus infections: role of impaired and dysregulated host immunity. J. Clin. Invest 130, 6204–6213 (2020). - PMC - PubMed
    1. Plante JA et al. The variant gambit: COVID-19’s next move. Cell Host Microbe 29, 508–515 (2021). - PMC - PubMed
    1. Vijay R et al. Critical role of phospholipase A2 group IID in age-related susceptibility to severe acute respiratory syndrome-CoV infection. J. Exp. Med 212, 1851–1868 (2015). - PMC - PubMed
    1. Zhao J, Zhao J, Legge K & Perlman S Age-related increases in PGD2 expression impair respiratory DC migration, resulting in diminished T cell responses upon respiratory virus infection in mice. J. Clin. Invest 121, 4921–4930 (2011). - PMC - PubMed
    1. Wan Y, Shang J, Graham R, Baric RS & Li F Receptor recognition by the novel coronavirus from Wuhan: an analysis based on decade-long structural studies of SARS coronavirus. J. Virol 94, e00127–20 (2020). - PMC - PubMed

Publication types

Supplementary concepts