. 2022 Apr;19(4):461-469.
doi: 10.1038/s41592-022-01417-2. Epub 2022 Mar 21.

DaXi-high-resolution, large imaging volume and multi-view single-objective light-sheet microscopy

Affiliations

DaXi-high-resolution, large imaging volume and multi-view single-objective light-sheet microscopy

Bin Yang et al. Nat Methods. 2022 Apr.

Abstract

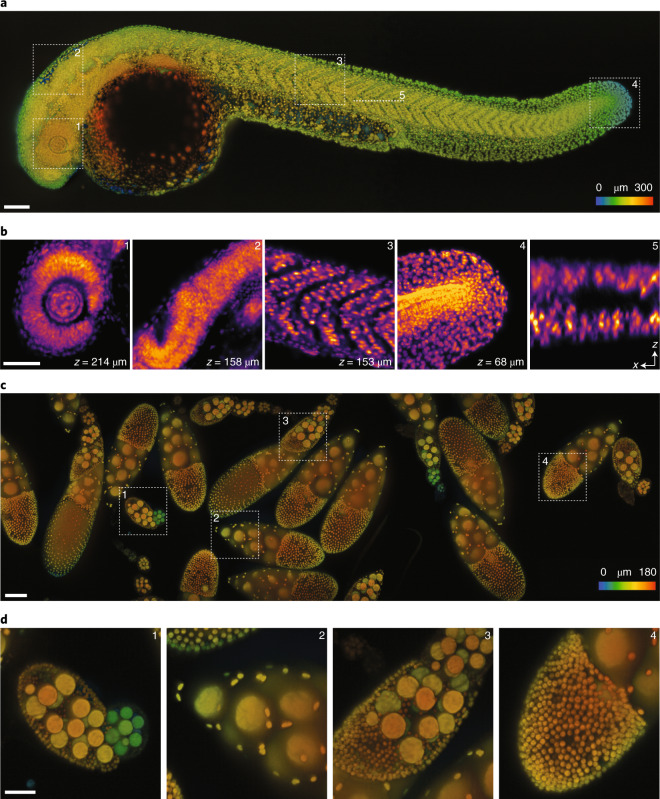
The promise of single-objective light-sheet microscopy is to combine the convenience of standard single-objective microscopes with the speed, coverage, resolution and gentleness of light-sheet microscopes. We present DaXi, a single-objective light-sheet microscope design based on oblique plane illumination that achieves: (1) a wider field of view and high-resolution imaging via a custom remote focusing objective; (2) fast volumetric imaging over larger volumes without compromising image quality or necessitating tiled acquisition; (3) fuller image coverage for large samples via multi-view imaging and (4) higher throughput multi-well imaging via remote coverslip placement. Our instrument achieves a resolution of 450 nm laterally and 2 μm axially over an imaging volume of 3,000 × 800 × 300 μm. We demonstrate the speed, field of view, resolution and versatility of our instrument by imaging various systems, including Drosophila egg chamber development, zebrafish whole-brain activity and zebrafish embryonic development - up to nine embryos at a time.


Conflict of interest statement

A patent application has been filed by B.Y. and L.A.R. covering the reported microscope design. The remaining authors declare no competing interests.

Figures

Fig. 1
Fig. 1. Design of a high-resolution, large field of view and multi-view single-objective light-sheet microscope.
a, Simplified scheme of the optical setup. b, In this setup, the light-sheet excitation and emission pass through a single objective. The fluorescence is collected by O1 and relayed downstream with full NA detection, ensuring high-resolution imaging. c, The full NA detection is achieved by oblique remote focusing using a bespoke objective with a monolithic glass tip and zero working distance. The glass tip compresses the collection half-angle allowing a tilt range from 0 to 55°. d, During imaging, the stage moves the sample along the scanning axis. To avoid motion blur, the galvo mirror moves the light sheet alongside the stage movement during the camera exposure for each image. The galvo mirror moves back during the readout time and restarts this compensatory movement during the next exposure. Illumination and detection planes remain centered along the entire optical train to give optimal light collection, minimal aberrations and thus pristine image quality. e, Our instrument is capable of dual light-sheet excitation. This improves illumination coverage and image contrast, as for most points in the sample, one of the two light-sheet orientations will have a shorter penetration depth through the sample giving a more contrasted and complete image. The dual-view imaging is achieved through an imaging flipping module consisting of two galvo mirrors and three normal mirrors along the optical path (f and g). f, The illumination light goes along the path highlighted in orange or blue, resulting in opposing incident angle at the sample space. g, Similarly, the fluorescence light goes through either of the two paths, resulting in the flipping of the image with respect to that of the other path (blue and orange arrows before and after propagation through the unit), ensuring that the intermediate image is always formed on the front surface of O3. h, The microscope is converted from upright (dipping, left side) to inverted (immersion, right side) by repositioning the coverslip from the focal space of O2 to that of O1, without sacrificing the optical performance.
Fig. 2
Fig. 2. Characterization of the microscope.
a, Imaging volume geometry. The coverslip is parallel to the xy plane. The optical axis of the microscope is along the z axis (depth). The sample is illuminated by an oblique light sheet in the xy plane, where x’ is the light-sheet propagation direction. The field of view in the xy plane is 800 μm (y) by 420 μm (x’), corresponding to 800 μm (y) by 300 μm (depth, z) in the yz plane. Volumetric data were acquired by scanning the sample, along the x axis, with respect to the illumination plane. By using light-sheet stabilized stage scanning, the scanning range (up to 75 mm, compared to 300 μm with galvo scanning) is only limited by the stage. b, Representative PSF obtained by imaging 100-nm green fluorescence beads. Projections along xy, xz and zy are shown. The PSF is slightly tilted and its long axis (z”) is about 20° with respect to the z axis. Taking this into consideration, the line profiles of the PSF were plotted and fitted along the three principal axes, that is x”, y and z”. The FWHM are, respectively, 479.9 ± 28.0, 379.2 ± 20.9 and 1,864.9 ± 174.3 nm (mean ± s.d., n = 156 fluorescence beads). Scale bar, 1 μm.
Fig. 3
Fig. 3. Large volume imaging of Danio rerio larval development and Drosophila melanogaster egg chambers.
a, Images of a zebrafish larvae (roughly 30 hpf, nuclei labeled with tg(h2afva:h2afva-mCherry) imaged using the microscope. Imaging volume (x,y,z) is 3,000 × 800 × 300 μm acquired every 50 s (two views). The depth is color-coded, where blue and red indicate respectively close to and far from the coverglass. Scale bar, 100 μm. b, Four xy slices from different regions (1–4, dashed squares in a) at various depths and one xz slice (5, dashed line in a) are highlighted. Scale bar, 50 μm. c, Images of Drosophila fly egg chambers. Nuclei of germline cells (large) and somatic cells (small) were labeled by expressing UAS-NLS-GFP under the control of Usp10-Gal4 (BDSC-76169). Imaging volume is 3,000 × 800 × 180 μm acquired every 30 s (single views) for 3 h. The depth is color-coded as above. Scale bar, 100 μm. d, Four regions (dashed squares in c) are highlighted. Scale bar, 50 μm.
Fig. 4
Fig. 4. High-speed multi-view imaging of zebrafish tail development.
a, Axial maximum projection showing the whole zebrafish larva tail at 24 hpf, nuclei labeled with tg(h2afva:h2afva-mCherry). Imaging volume is 1,064 × 532 × 287 μm consisting of 4,000 × 2,000 × 360 voxels per view for a total of 5.7 billion voxels acquired every 40 s. Scale bar, 100 μm. b, Side projection illustrating how the two light-sheets enter the sample at 45° to reach a given point in the sample. Depending on the sample geometry and placement, one of the two light-sheets will have a shorter path to reach that point and hence be less susceptible to absorption, refraction or scattering. Consequently, the corresponding view’s image will be more complete and better contrasted. c, Example regions (single xy plane slices) that demonstrate the complementarity of the two views. In some regions (left) the first view has better image quality, whereas in other regions (right) the second view is better. Scale bar, 3 μm. d, After registration, the two views can be fused together to obtain one high-quality image. e, Time-lapse max-projection frames over a 2.2 h period centered on the dorsomedial tail, during which time the boundary between neighboring somites are accentuated. Scale bar, 80 μm. f, Spatio-temporal zoom centered around a cell division, single xy plane slice. Despite the large field of view, both views are acquired every 40 s making it possible to follow the intermediate steps during mitosis—an important capability for achieving, for example, accurate lineage tracking. Scale bar, 10 μm.
Fig. 5
Fig. 5. Imaging nine zebrafish embryos at a time.
a, Top and side views of nine zebrafish embryos mounted in 0.1% agarose gel. b, The embryos (only eight are shown) were imaged sequentially (at 4.5 min per round) for up to 8 h. Only the final frames at t = 8 h imaging are shown (see also Supplementary Video 6 for the time lapse of all nine embryos). All the embryos developed normally. The images are maximum intensity projection, color-coded for depth, of the 3D volume. Scale bar, 200 μm. c, Five time points from three different fish are shown, illustrating the imaging reproducibility across multiple samples. Scale bars, 50 μm (top right) and 200 μm (bottom left).
Extended Data Fig. 1
Extended Data Fig. 1. Optical setup of the microscope.
(a) Detailed layout of the setup. Objectives lenses: O1 - Olympus XLUMPLFLN 20XW, O2 - Olympus UPLXAPO20X, O3 - Calico AMS-AGY v2.0. Tube lenses: TL1, TL2 and TL3 - Olympus SWTLU-C 180 mm, TL4, TL5 and TL6 - 135 mm custom designed tube lens (using off-the-shelf pieces from Thorlabs, see [ref]), TL7- Thorlabs TTL200-A or TTL165-A. Scanning galvo and switching galvos: Cambridge 6SD12205 20 mm galvo mirrors. Cylindrical lenses: CL1-CL3. Achromatic double lenses: L1-L2. Dichroic mirror: DM - Chroma ZT405/488/561/640rpcv2-UF3. Mirrors: M1-M12, protected-silver coated mirror. 2-axes galvo: Cambridge 6SD12056 10 mm galvo mirrors. EF: emission filters, Chroma ET525/50 m or ET605/75 m. (b) Dual view switching module. The two switching galvo mirrors can switch the light path so that light is reflected either by M5 and M7 or by M6 only. The red arrow is reflected four times along the path and maintains upright, while the green arrow is reflected only three times and becomes inverted. (c) Dual view images of a calibration grid (Thorlabs R1L1S1P). The two images are clearly flipped with respect to each other. The images were taken under bright field illumination and with O3, TL7 and the camera on a straight line with O2.
Extended Data Fig. 2
Extended Data Fig. 2. Light sheet stabilized stage scanning (LS3).
During the acquisition of a 3D image stack, the stage moves continuously, and the galvanometer scanner performs a counteracting motion of the light-sheet and detection planes to cancel out any relative motion between sample and imaging plane (which in our design is always coplanar with the light-sheet illumination), resulting in an effective step-wise scan of the sample.
Extended Data Fig. 3
Extended Data Fig. 3. Analysis of the optical path length when placing a glass coverslip into the imaging medium of an objective.
(a) illustrates the optical system to analyze. Depending on the type of objective, the medium could be air, water, immersion oil, etc. (b) plots the optical path length of an emitter at the coverslip surface as a function of the angle between the emission ray and the optical axis, in the case of air or water medium. (c) shows that 2D map of the optical path difference of using air and water medium. This 2D phase map is then fitted with the first 50 Zernike terms. (d) shows the coefficients of the first 20 Zernike terms. The major non-zero Zernike terms are piston, defocus and primary spherical aberration. Since the piston and defocus terms are trivial, this suggests that the significant aberration is primary spherical and is most likely introduced when the coverslip is moved from the secondary objective (air) to the primary objective (water) in a remote focus system (see Fig. 1). Considering that in practice the primary spherical aberration can be compensated by moving any of the relay tube lenses, one should be able to maintain the optical performance of the microscope when switching the coverslip’s location. Simulation is performed for objectives of NA 1.0 water and NA 0.75 air. The Zernike fitting is done using pyOTF, a simulation software package for modeling optical transfer functions (OTF)/point spread functions (PSF) of optical microscopes written in python. Link: https://github.com/david-hoffman/pyOTF.
Extended Data Fig. 4
Extended Data Fig. 4. Converting the microscope from upright to inverted by repositioning the coverslip in a remote focusing system.
(a) shows the remote focusing system composed of two objectives whose pupil planes are conjugated by a 4 f relay system. Yellow dot: fluorescent bead. O1: 20x, 1.0NA, water dipping. O2: 20x, 0.8NA, air. According to their factory design, O1 should be used directly facing the sample without any coverslip in between. O2 requires a coverslip between the objective front lens and the image plane, as shown in (a). This configuration is well suited for an upright microscope where the primary objective is used in a dipping configuration. (b) shows a representative PSF of the setup in (a) measured with 100 nm green fluorescence beads. The average FWHMs are respectively 400.5 + - 16.9 nm (x), 349.9 + - 20.4 nm (y) and 1356.8 + - 97.4 nm (z), n = 7 beads. Interestingly, according to our analysis (see Extended Data Fig. 3), one can reposition the coverslip at the focal space of O2 to that of O1 as shown in (c) and can still achieve similar optical performance, turning the system to an inverted configuration. (d) shows a representative PSF of such a system (c). The average FWHMs are respectively 382.2 + - 8.9 nm (x), 376.4 + - 22.0 nm (y), 1353.6 + - 48.6 nm (z), n = 6 beads. The numbers are indeed similar to that of the top configuration (a).
Extended Data Fig. 5
Extended Data Fig. 5. Coordinate system of the microscope.
The objective front lens is parallel to the xy plane. The optical axis of the microscope is along the z axis (depth). The sample is illuminated by an oblique light sheet in the x’y plane, where x’ is the light sheet propagation direction. Volumetric data were acquired by scanning the sample, along the x-axis, with respect to the illumination plane. Because the PSF is slightly tilted, that is, and its long axis (z”) is about 20° with respect to the z-axis. The line profiles of the PSF were plotted and fitted along the three principal axes (x”, y, and z”) to measure the FWHMs.
Extended Data Fig. 6
Extended Data Fig. 6. PSF measurements across the imaging volume.
In order to have a good sampling of the PSF for accurate estimation of the resolution, we set the effective magnification to 29.6 and the pixel size to 220 nm. With the chip size of our camera being 2048 * 2048, we can achieve a field of view 451 μm (y) * 451 μm (x’). This corresponds to 451 μm (y, width) * 319 μm (z, depth) in the sample coordinates. The scanning range doesn’t affect the imaging quality and can go as far as the stage’s moving range. We then acquire images of 100 nm fluorescence beads at three channels and plot the FWHMs along the three axes of the PSF. Note that the PSF is slightly tilted with respect to the xyz coordinates. Therefore, we perform the FWHMs measurements along the principal axes to give a better estimation of the lateral resolution (x”, y) and especially the axial resolution (z”). This avoids underestimation of the true axial resolution. The left column (a-c) shows the plots of the FWHMs within the imaging volume. The performance is consistent, up to ~ 300 μm depth for all three channels. For large field of view imaging, we can use a different tube lens (TL7, Extended Data Fig. 1) so that the effective magnification is 14.8 and the pixel size is 440 nm. We then achieve a field of view of 901 μm (y) * 451 μm (x’) using half of the camera chip (2048 * 1024). This corresponds to 901 μm (y, width) * 319 μm (z, depth) in the sample coordinates. The right column (d-f) shows the FWHMs across the imaging volume under this configuration. Overall, the PSFs are consistence but they do get widens towards the edge of the field of view. See also Table 1 for the statistics of the FWHMs. Source data
Extended Data Fig. 7
Extended Data Fig. 7. Dual color imaging of a zebrafish larvae.
The larvae is imaged at 2 dpf. The nuclei (magenta) are labelled with tg(h2afva:h2afva-mCherry). The membranes (cyan) are stained using Vybrant DiO cell-labeling solution (Thermal fisher V22889). Dio injections for retrograde live label was applied at 24 hpf, followed by an O/N incubation at 29 C incubator before imaging. (a) 3D volume rendering of the data. (b) Representative xy slice of the 3D data. (c) Magnified view of the region highlighted in the white dashed rectangle in (b).
Extended Data Fig. 8
Extended Data Fig. 8. Whole-brain, neuron-level 3D imaging in larval zebrafish in vivo.
High-resolution images are recorded in steps of 8 μm with an exposure time of 8 ms. A volume of 500 μm * 300 μm * 200 μm, containing the entire brain, is recorded once every 0.3 s. The recording of two different zebrafish lines is shown in (a)-(c) and (d)-(f). (a) and (d) show the max intensity projection of the 3D volumes. (b) and (e) show regions of interest from a single slice of the 3D stack, indicated by the write rectangles in (a) and (d). (c) and (f) give representative fluorescence signal of five different neurons over time.
Extended Data Fig. 9
Extended Data Fig. 9. Imaging the whole brain of the zebrafish embryo.
(a) show the orientation of the embryo mounted on the sample stage, with the head facing the primary objective (O1). (b) 3D rendering of the zebrafish brain images. (c) XY slices of the brain images at different depths up to 167.4 mm.
Extended Data Fig. 10
Extended Data Fig. 10. Data processing pipeline.
The 3D stacks from each view are initially in the x1’yz1’ and x2’yz2’ coordinates respectively. The stacks are then resampling to the sample (that is, xyz) coordinates. This process involves resampling of the voxels from the x1’yz1’ (or x2’yz2’) coordinates to the xyz coordinates (see Extended Data Fig. 5 and see Supplementary Fig. 15). The two stacks are then registered and fused to a single stack (see Supplementary Fig. 16).

References

    1. Huisken J, Swoger J, Bene FD, Wittbrodt J, Stelzer EHK. Optical sectioning deep inside live embryos by selective plane illumination microscopy. Science. 2004;305:1007–1009. doi: 10.1126/science.1100035. - DOI - PubMed
    1. Keller PJ, Schmidt AD, Wittbrodt J, Stelzer EHK. Reconstruction of zebrafish early embryonic development by scanned light sheet microscopy. Science. 2008;322:1065–1069. doi: 10.1126/science.1162493. - DOI - PubMed
    1. McDole K, et al. In toto imaging and reconstruction of post-implantation mouse development at the single-cell level. Cell. 2018 doi: 10.1016/j.cell.2018.09.031. - DOI - PubMed
    1. Shah G, et al. Multi-scale imaging and analysis identify pan-embryo cell dynamics of germlayer formation in zebrafish. Nat. Commun. 2019;10:5753. doi: 10.1038/s41467-019-13625-0. - DOI - PMC - PubMed
    1. McGorty R, et al. Open-top selective plane illumination microscope for conventionally mounted specimens. Opt. Express. 2015;23:16142–16153. doi: 10.1364/OE.23.016142. - DOI - PMC - PubMed

Publication types