Clinical Trial
. 2022 Apr;28(4):724-734.
doi: 10.1038/s41591-022-01726-1. Epub 2022 Mar 21.

PSMA-targeting TGFβ-insensitive armored CAR T cells in metastatic castration-resistant prostate cancer: a phase 1 trial

Collaborators, Affiliations
Clinical Trial

PSMA-targeting TGFβ-insensitive armored CAR T cells in metastatic castration-resistant prostate cancer: a phase 1 trial

Vivek Narayan et al. Nat Med. 2022 Apr.

Abstract

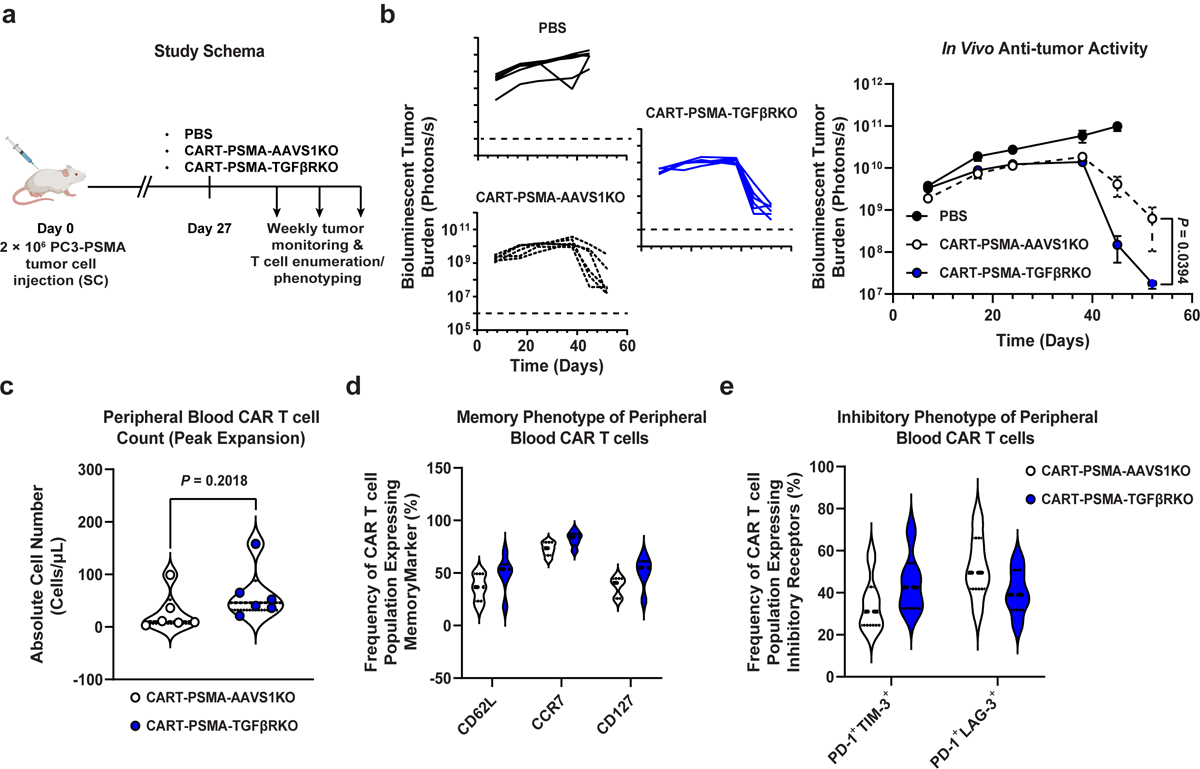
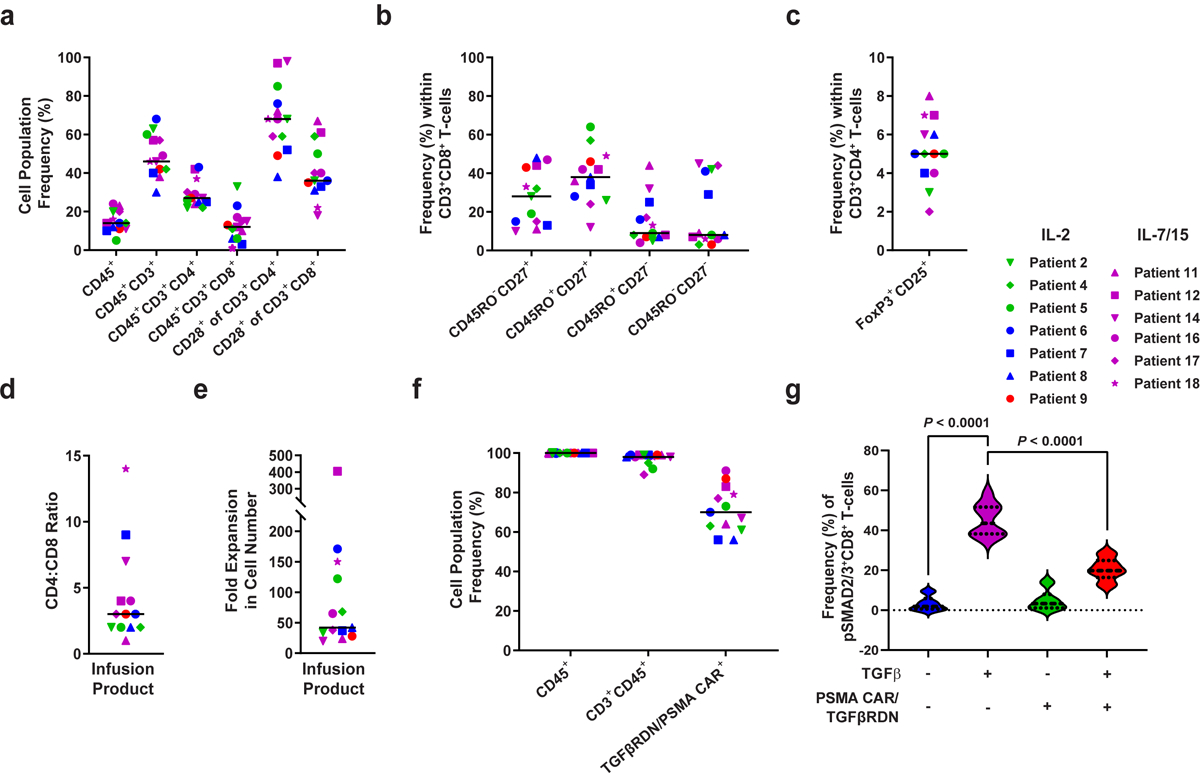
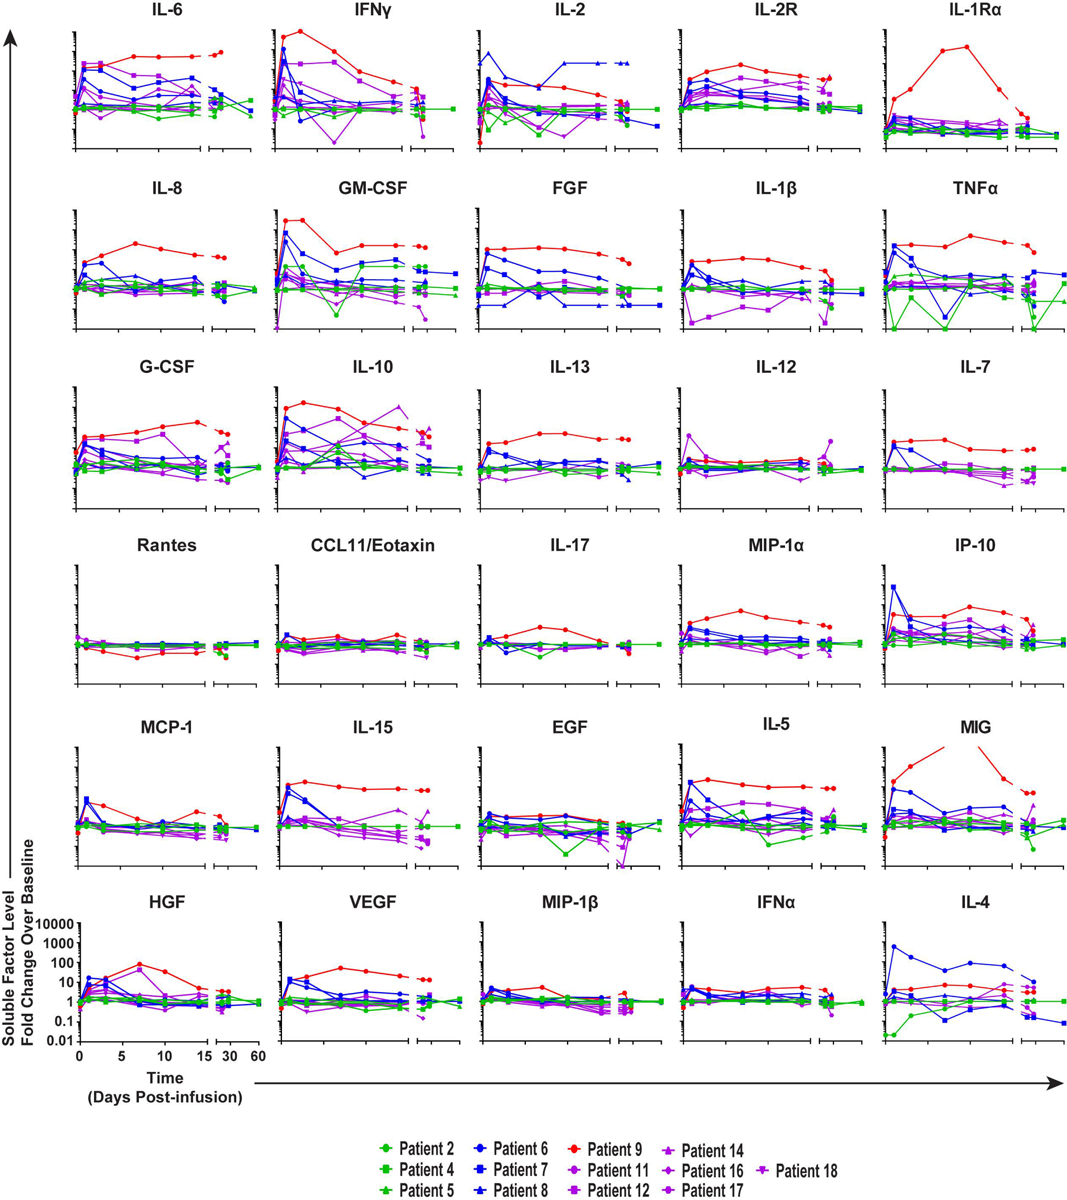
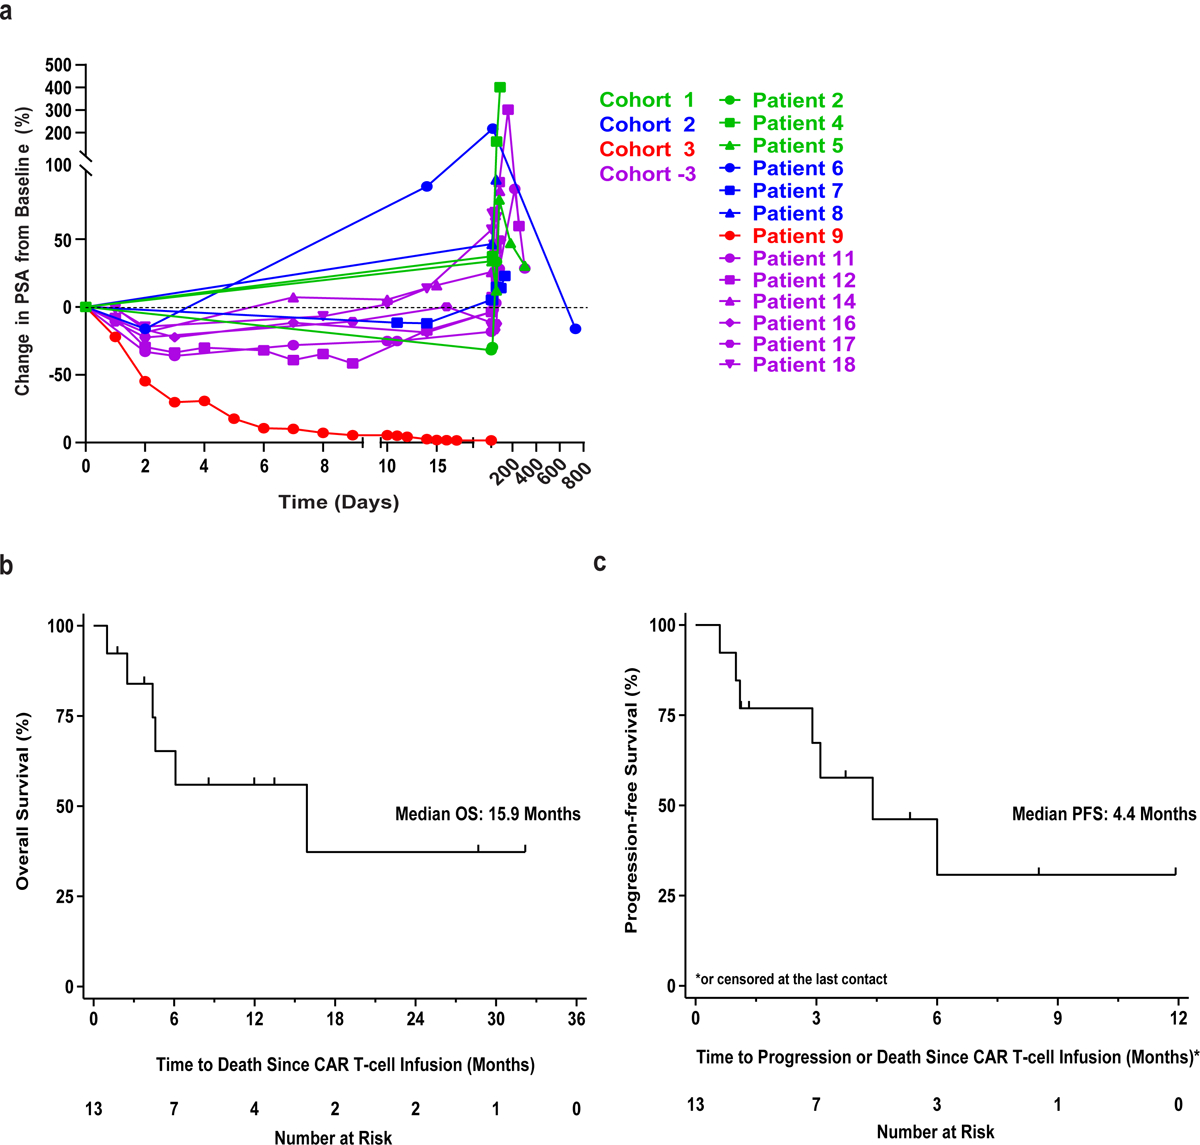
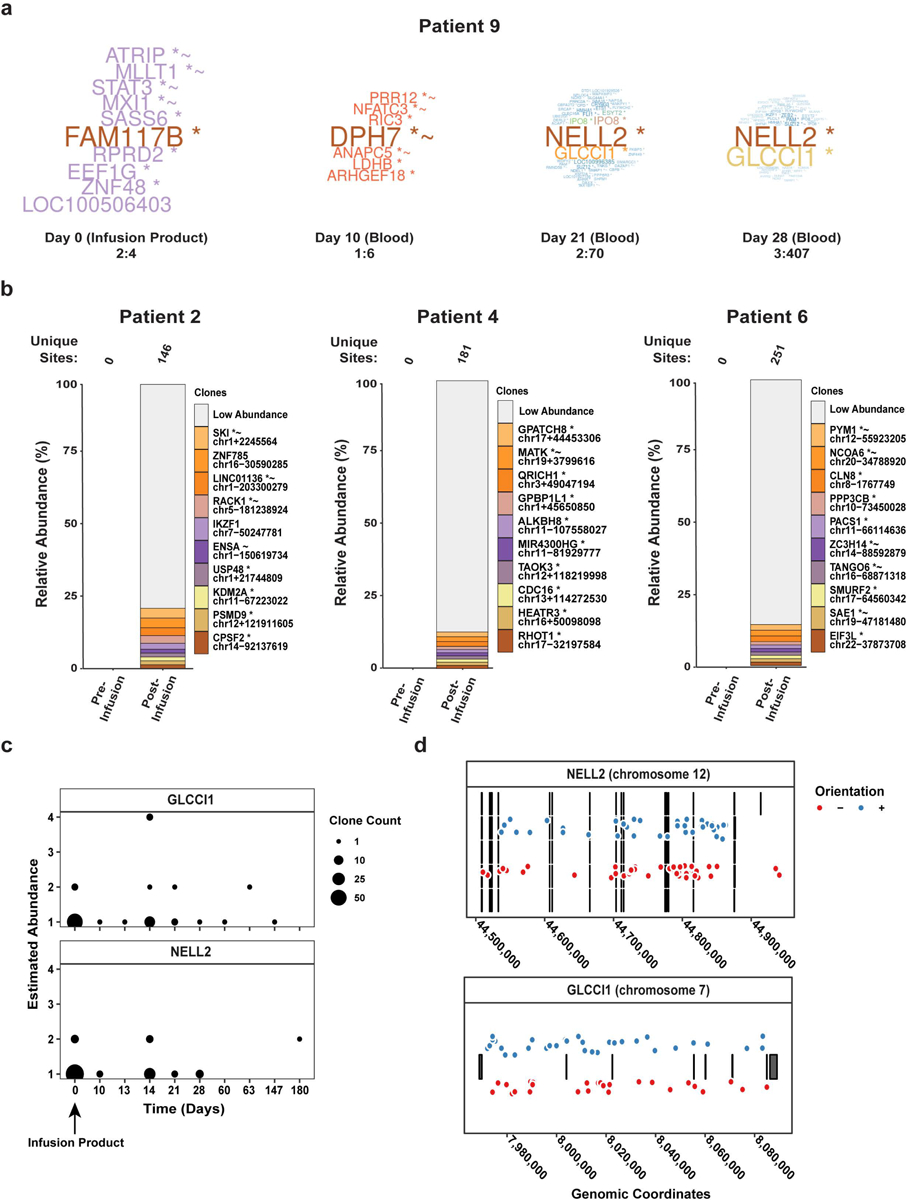
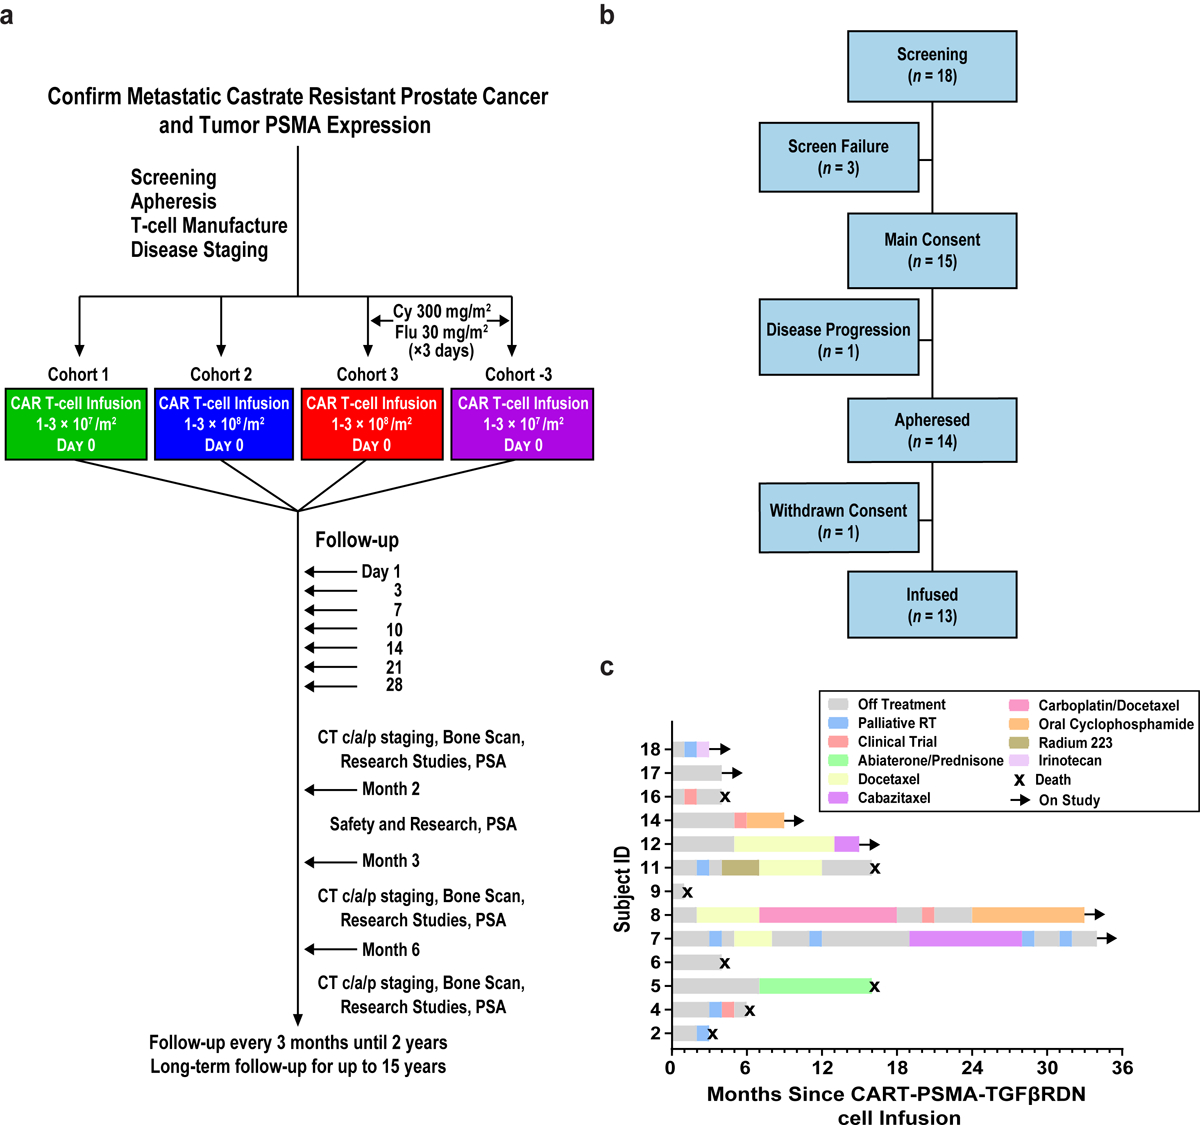
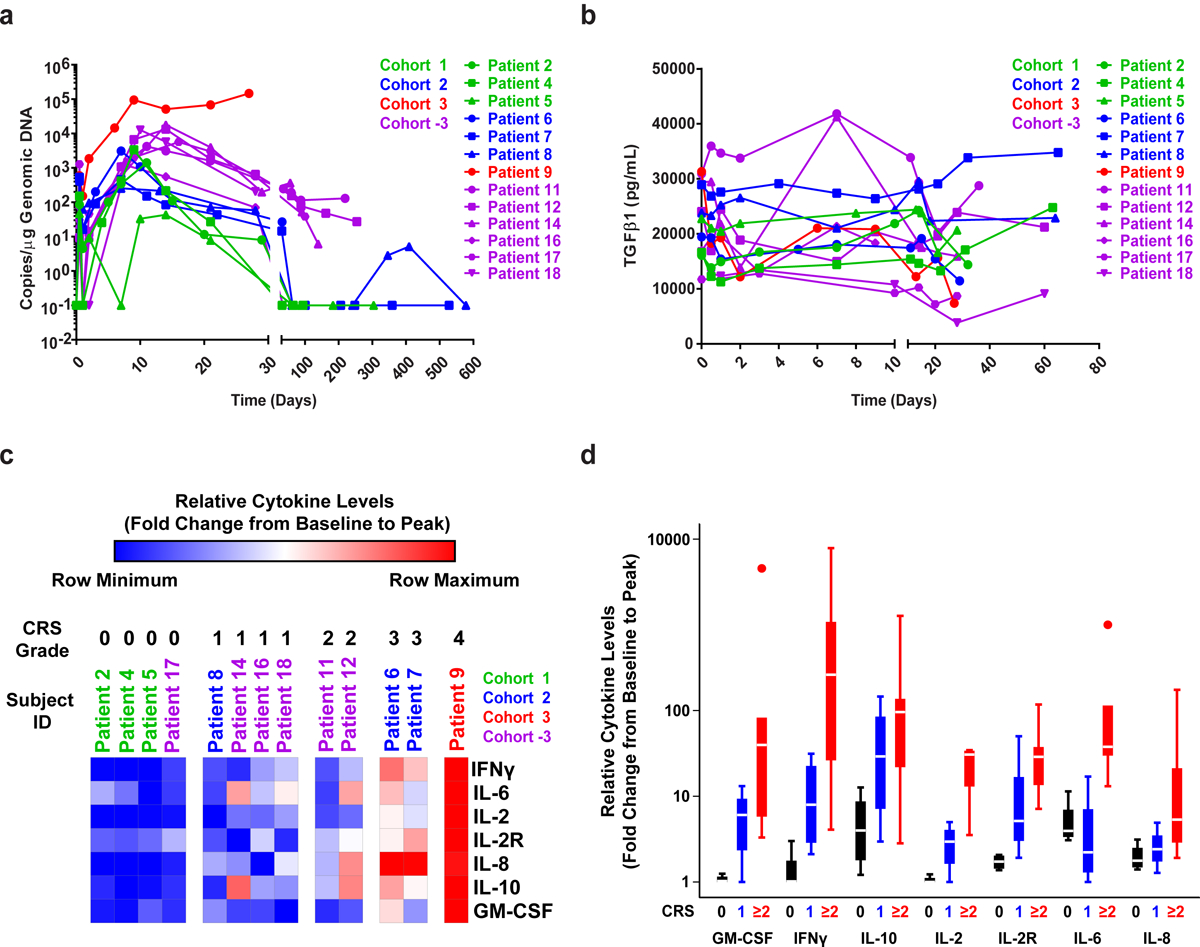
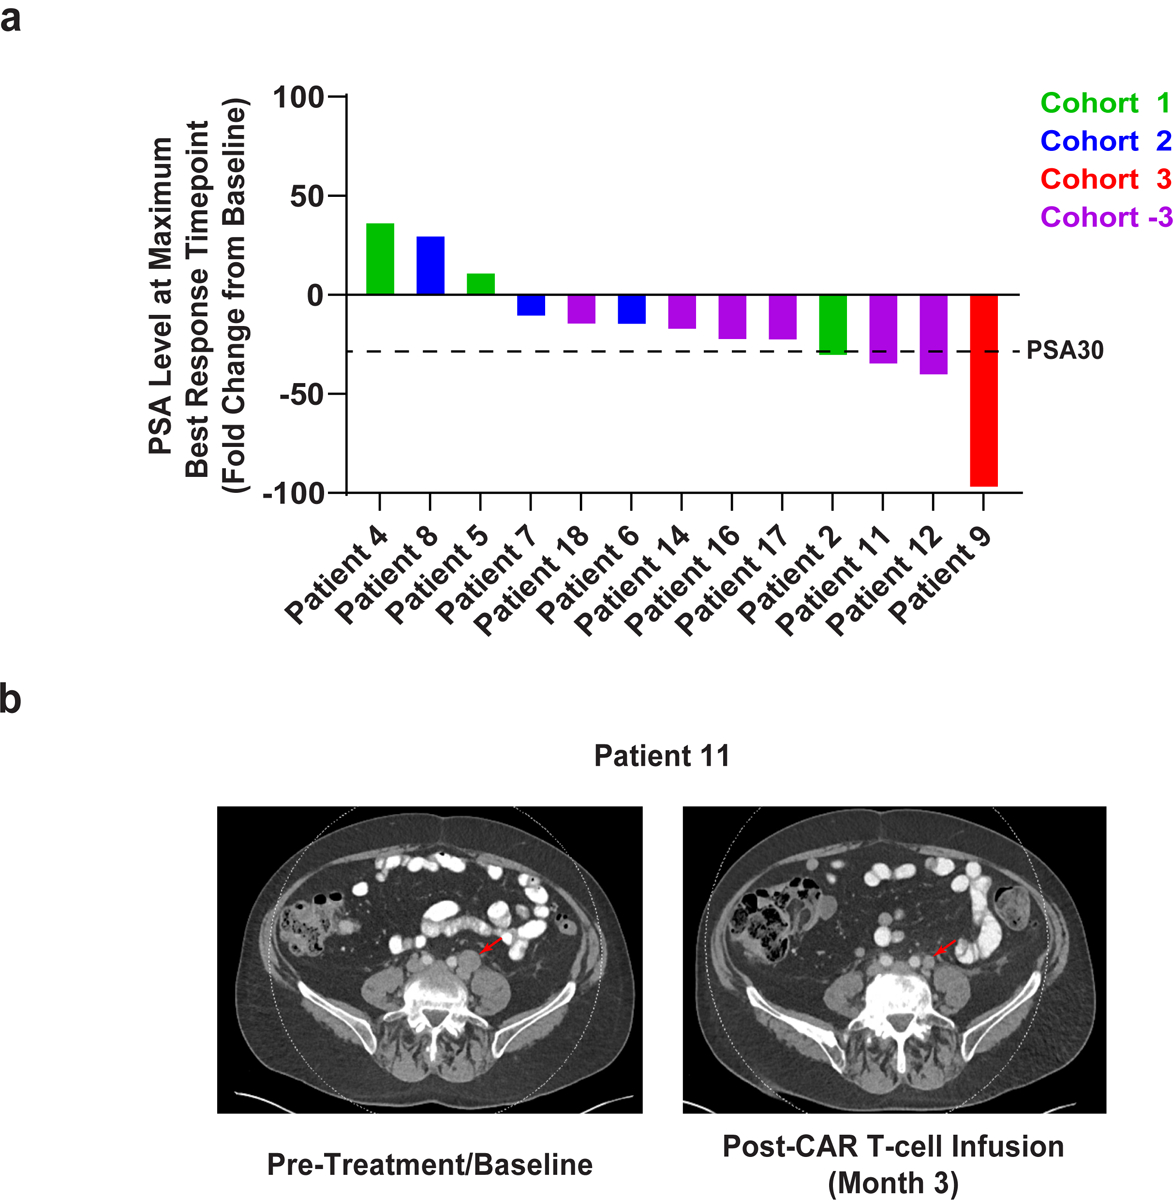
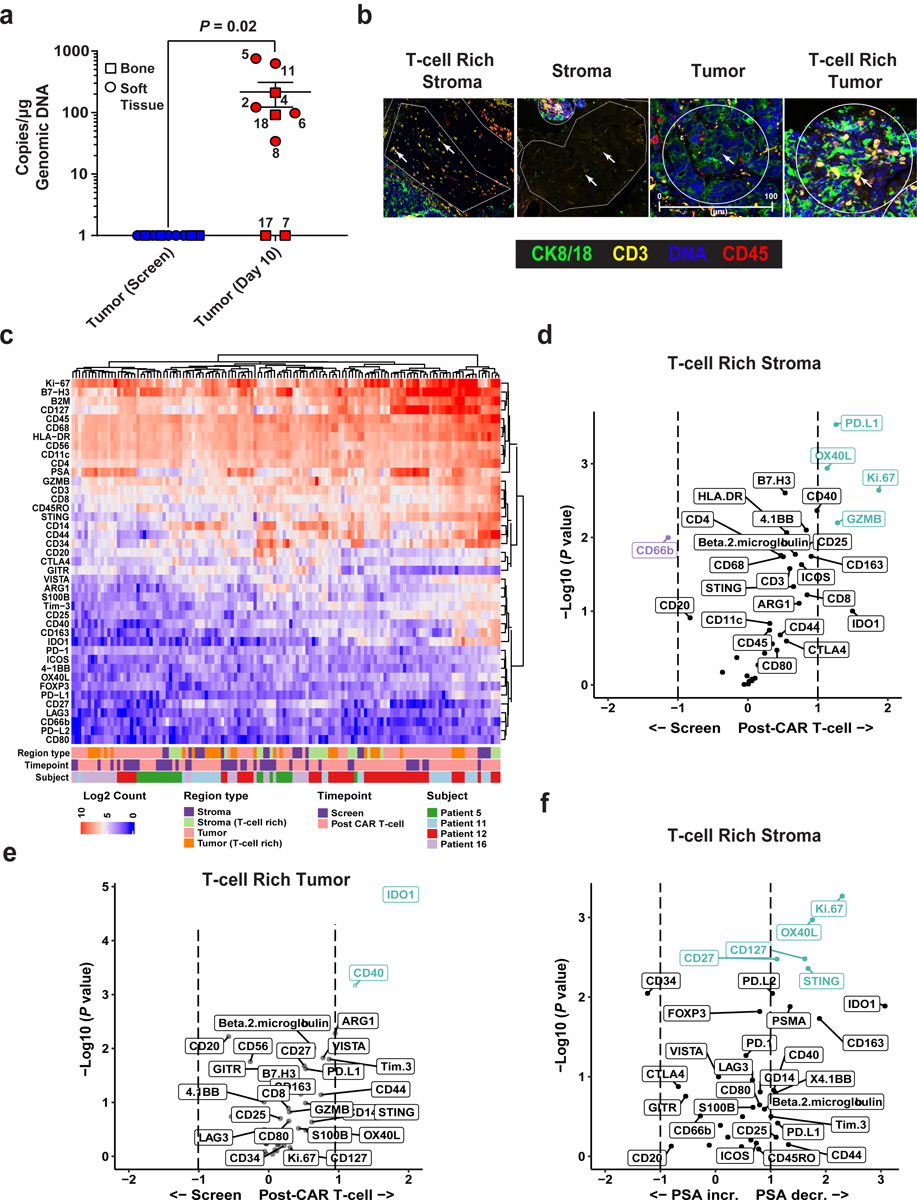
Chimeric antigen receptor (CAR) T cells have demonstrated promising efficacy, particularly in hematologic malignancies. One challenge regarding CAR T cells in solid tumors is the immunosuppressive tumor microenvironment (TME), characterized by high levels of multiple inhibitory factors, including transforming growth factor (TGF)-β. We report results from an in-human phase 1 trial of castration-resistant, prostate cancer-directed CAR T cells armored with a dominant-negative TGF-β receptor (NCT03089203). Primary endpoints were safety and feasibility, while secondary objectives included assessment of CAR T cell distribution, bioactivity and disease response. All prespecified endpoints were met. Eighteen patients enrolled, and 13 subjects received therapy across four dose levels. Five of the 13 patients developed grade ≥2 cytokine release syndrome (CRS), including one patient who experienced a marked clonal CAR T cell expansion, >98% reduction in prostate-specific antigen (PSA) and death following grade 4 CRS with concurrent sepsis. Acute increases in inflammatory cytokines correlated with manageable high-grade CRS events. Three additional patients achieved a PSA reduction of ≥30%, with CAR T cell failure accompanied by upregulation of multiple TME-localized inhibitory molecules following adoptive cell transfer. CAR T cell kinetics revealed expansion in blood and tumor trafficking. Thus, clinical application of TGF-β-resistant CAR T cells is feasible and generally safe. Future studies should use superior multipronged approaches against the TME to improve outcomes.


Conflict of interest statement

Competing Interests

Patents, Royalties, Other Intellectual Property: S.F.L., M.M.D, D.L.S., C.H.J. and J.A.F. have filed patent applications in the field of T-cell therapy for cancer and have received royalties. C.H.J. and A.C. are co-founders of Tmunity Therapeutics. M.M.D. has received research funding from Tmunity Therapeutics and serves on the Scientific Advisory Board for Cellares Corporation. S.F.L. has served as a consultant for Novartis Pharmaceuticals, Kite Pharma, and Wugen and receives clinical trial funding from Novartis Pharmaceuticals. J.A.F. is a member of the Scientific Advisory Boards of Cartography Bio. and Shennon Biotechnologies Inc. The remaining authors declare no competing interests.

Figures

Extended Data Fig. 1
Extended Data Fig. 1. Knockout of the endogenous TGFβRII in CART-PSMA cells enhances in vivo prostate tumor control independently of T cell proliferative capacity, early memory differentiation or inhibitory phenotype.
(a) Schema of CAR T cell transfer into prostate tumor (luciferase-expressing PC3 cell)-engrafted mice. (b) Longitudinal bioluminescent tumor burden of PBS or CAR T cell treated mice (n = 6). Error bars depict s.e.m. P values were calculated using a two-tailed t-test between the two CAR T cell treated groups at day 52 post-tumor injection. (c) Violin plots showing the absolute counts (d) memory and (e) inhibitory phenotypes of CART-PSMA-AAVS1KO or CART-PSMA-TGFβRKO cells in the peripheral blood of mice at the peak of T cell expansion (day 48). Thick dashed lines indicate the median and thin dotted lines show the first and third quartiles. P values were determined with a two-tailed t-test.
Extended Data Fig. 2
Extended Data Fig. 2. Transgenic expression of TGFβRDN significantly increases the proliferative capacity, but not the effector function of CART-PSMA cells compared to knockout of the endogenous TGFβRII.
(a) Efficiency of CRISPR/Cas9-mediated knockout (KO) of the endogenous TGFβRII (TGFβRKO) in CART-PSMA cells derived from n = 4 different subjects, as determined by Sanger sequencing and TIDE analysis. Editing efficiency is presented relative to AAVS1 knockout in donor-matched CART-PSMA cells. Error bars depict the SEM. (b) Representative flow cytometry showing levels of pSMAD2/3 in CART-PSMA cells with knockout of AAVS1, TGFβRII or co-expression of TGFβRDN that were unstimulated or stimulated with recombinant human TGFβ (representative of 3 independent experiments). (c) Expansion capacity of CART-PSMA-TGFβRDN versus CART-PSMA-TGFβRKO cells following serial re-stimulation (indicated by black arrows) with TGFβ-expressing irradiated PC3 prostate tumor cells. Proliferation is presented as a change in fold expansion over the longitudinal growth of stimulated CART-PSMA-AAVS1KO cells. Cells were manufactured from 4 different subjects, with pooled data from 3 independent experiments. Error bars depict the s.e.m. P values were calculated using a two-tailed t-test. (d) Killing kinetics of CART-PSMA-TGFβRDN, CART-PSMA-TGFβRKO and CART-PSMA-AAVS1KO cells co-cultured with PC3 tumor targets. CAR T cells directed against CD19 (irrelevant CAR) served as a negative control. Data are representative of 3 individual experiments performed with engineered T cells from 3 independent subjects. Error bars indicate the s.e.m. (e) Cytokine production from CART-PSMA-TGFβRKO and CART-PSMA-TGFβRDN compared to control CART-PSMA cells following stimulation with PC3 cells. Each data point represents a CAR T cell sample derived from an independent donor. Error bars depict the s.e.m. P values were calculated with a two-tailed t-test.
Extended Data Fig. 3
Extended Data Fig. 3. Characterization of baseline apheresis products and preinfusion TGFβRDN expressing PSMA-directed CAR T cells (CART-PSMA-TGFβRDN).
(a) Frequencies of apheresed CD45+, CD45+CD3+, CD45+CD3+CD4+, CD45+CD3+CD8+ cells and CD28+ T cells were assessed by flow cytometry. (b) Proportions of various CD3+CD8+ T cell subsets at the time of apheresis are shown: naive-like, CD27+CD45RO; central memory, CD27+CD45RO+; effector memory, CD27CD45RO+; effector, CD27CD45RO. (c) Percentages of FoxP3+CD25+ regulatory T cells in apheresis material. (d) CD4:CD8 cell ratio in the pre-infusion CAR T cell product is depicted. (e) Fold expansion of CAR T cell infusion product over 9-days of clinical manufacturing is shown. (f) Frequencies of expanded patient CD3+CD45+ T cells expressing the anti-PSMA CAR and TGFβRDN are plotted. Individual data points for each patient and means (denoted by a black horizontal line) are shown in panels a-f. (g) Expression of a TGFβRDN on manufactured PSMA-targeted CAR T cells prevents TGFβ signaling through SMAD2/3 phosphorylation. Individual data points for each patient and means are shown in all panels. IL-2 denotes patient products manufactured in the presence of this cytokine; IL-7/15 indicates CAR T cell manufacturing using these cytokines. Thick dashed lines in violin plots depict the median and thin dotted lines indicate the first and third quartiles. P values were determined with a two-tailed Student’s t-test for paired samples.
Extended Data Fig. 4
Extended Data Fig. 4. Longitudinal cytokine, chemokine and growth factor profiles in the peripheral blood of mCRPC patients treated with CART-PSMA-TGFβRDN cells.
Fold changes in serum cytokine, chemokine and growth factor levels from baseline (preCAR T cell infusion) to each time point postCART-PSMA-TGFβRDN cell administration were measured in patients by multiplex analysis and are depicted as line graphs.
Extended Data Fig. 5
Extended Data Fig. 5. Antitumor responses and clinical outcomes in subjects infused with CART-PSMA-TGFβRDN cells.
(a) Spider plot showing longitudinal serum PSA changes in patients treated with CART-PSMA-TGFβRDN cells. (b) Overall survival (OS) and (c) progression-free survival (PFS) graphed as Kaplan-Meier estimates for all patients. The x-axis is shown in months. Tick marks indicate each censored subject (that is, patients who are alive at the data cutoff point).
Extended Data Fig. 6
Extended Data Fig. 6. Analysis of CAR lentiviral integration sites in mCRPC and advanced leukemia patients.
(a) The word clouds illustrate CAR-PSMA-TGFβRDN lentiviral integration sites near genes of the most abundant clones from each Patient 9 sample, where the numeric ranges represent the upper and lower clonal abundances. (b) The relative abundances of cell clones are summarized as stacked bar plots. The different bars in each panel denote the major cell clones, as marked by integration sites where the x-axis indicates timepoints and the y-axis is scaled by the proportion of total cells sampled. The top 10 most abundant clones have been named by the nearest gene while the remaining sites are grouped as low abundance. The total number of unique sites are listed above each plot. (c) This panel displays the frequency of NELL2- and GLCCI1-disrupted clones observed at each timepoint across advanced leukemia patients treated with CD19 CAR T cells. The size of the points indicates the number of clones observed at the same timepoint and sharing the same abundance. (d) The distribution of integrated pro-vectors across NELL2 and GLCCI1. Each row of lines and boxes indicates a different splice variant of the transcription unit (5 for NELL2 and 1 for GLCCI1). The points indicate the observed integrated pro-vectors. The color of the points indicates the orientation of the integrated element. Points were displaced vertically for aesthetics, as the vertical distances between points hold no value.
Extended Data Fig. 7
Extended Data Fig. 7. CRISPR/Cas9-mediated mutagenesis of NELL2 and GLCCI1 does not alter the proliferative capacity of CART-PSMA-TGFβRDN cells.
(a) Efficiency of CRISPR/Cas9-induced mutagenesis of NELL2 and GLCCI1 in CART-PSMA-TGFβRDN cells from n = 4 different individuals, as assessed by Sanger sequencing and TIDE analysis. Knockout (KO) effectiveness is shown relative to AAVS1 in subject-matched CART-PSMA-TGFβRDN cells. (b) In vitro proliferative capacity of CRISPR/Cas9-edited CART-PSMA-TGFβRDN cells (n = 4 independent donor samples) following serial restimulation (indicated by black arrows) with irradiated PC3 prostate tumor cells. Error bars indicate the s.e.m. (c) Antigen-dependent fold expansion of AAVS1 and GLCCI1 KO CART-PSMA-TGFβRDN cells in the presence or absence of dexamethasone (DEX; E-4M). Box plots show minimum, lower quartile, median, upper quartile and maximum (n = 6 biologically independent samples).
Extended Data Fig. 8
Extended Data Fig. 8. In vitro assessment of Patient 9 CART-PSMA-TGFβRDN cell transformation.
(a) Assessment of proliferation and (b) viability of Patient 9 CART-PSMA-TGFβRDN cells (derived from the CAR T cell infusion product and day 28 postinfusion PBMC) under cytokine- and stimulation-free conditions. T cells from an unrelated donor transformed with an NPM-ALK fusion kinase were cultured in parallel as a control. (c) Absolute cell counts and (d) viability measurements of the same day 28 cells from Patient 9 above that were stimulated in the presence of anti-CD3/CD28 agonistic antibodies and IL-2 (untransduced = not transduced with NPM-ALK). The patient’s cells were transduced with a lentivirus encoding NPM-ALK and cultured separately as a control for transformation.
Figure 1.
Figure 1.. CART-PSMA-TGFβRDN protocol design and consort diagram.
(a) Protocol schema for screening, apheresis, T-cell manufacturing, treatment with CART-PSMA-TGFβRDN cells and follow-up. (b) Consort diagram indicating the number of patients screened, enrolled in the study, and infused with CART-PSMA-TGFβRDN cells. (c) Swimmer’s plot describing time on study for each subject, subsequent therapies and present status. Black arrows indicate ongoing survival and black X’s denote patient death.
Figure 2.
Figure 2.. Engraftment of CART-PSMA-TGFβRDN cells and cytokine elaboration in the peripheral blood.
(a) CART-PSMA-TGFβRDN cell engraftment in the peripheral blood by qPCR detecting CAR-specific sequences in genomic DNA. CAR T-cell pharmacokinetics over the first month for all subjects and beyond that time point for evaluable patients are shown. (b) Changes in serum TGFβ1 levels in the peripheral blood of each patient infused with CART-PSMA-TGFβRDN cells are depicted over time. (c) Heat maps (grouped by individual patients) and (d) boxplots (grouped by CRS grade: 0, n = 4; 1, n = 4; 2, n = 2; 3, n = 2; 4, n = 2) depicting the fold changes in pro-inflammatory cytokine production from baseline/pre-CAR T-cell infusion to the peak of CAR T-cell expansion are shown. Box plots indicate the range of the central 50% of the data, with a central line marking the median value. Whiskers extend from each box to show the range of the remaining data, with dots placed past the line edges to indicate outliers.
Figure 3.
Figure 3.. Pathological and radiologic evaluations after CART-PSMA-TGFβRDN cell infusion.
(a) Waterfall plot depicting the maximum fold change in serum PSA levels (PSA30 marked with dashed line) after CART-PSMA-TGFβRDN cell infusion. Individual patients are represented by vertical bars on the x-axis. (b) Computed tomography scans demonstrating tumor regression in Patient 11 following administration of an autologous CART-PSMA-TGFβRDN product. Radiologic studies were obtained before therapy and 3 months after adoptive transfer of CAR T-cells. The tumor site is indicated by a red arrow.
Figure 4.
Figure 4.. T-cell trafficking and digital spatial profiling (DSP) of the TME in CRPC biopsies before and after CART-PSMA-TGFβRDN cell infusion.
(a) CART-PSMA-TGFβRDN quantification by qPCR in tumor biopsies at baseline relative to post-CAR T-cell infusion time points in evaluable patients is plotted. Biopsy type (bone or soft tissue) indicated by different shapes. Subject identification numbers are indicated next to data points. Error bars represent the mean with SEM. P value determined using a two-sided Wilcoxon signed-rank test for paired samples. (b) Multi-label immunofluorescent staining of a post-CAR T cell infusion tumor biopsy to visualize tissue morphology and identify various regions of interest (ROIs) for DSP is shown. Cytokeratin (CK) 8/18 was used to identify tumor cells. Other morphology markers included CD3, CD45 and Cyto83 stain for DNA content analysis. Four illustrative ROIs are presented (scale bars, 100μm). Data are representative of 3 independent experiments. (c) Heat map depicts the relative quantification of 42 proteins that were detected in stromal, tumor, and T-cell rich ROIs in biopsy specimens at baseline (screen) and post-CAR T-cell administration. (d) Volcano plots presenting an overview of fold changes in protein expression in T-cell rich stromal ROIs and (e) T-cell rich tumor regions at pre- versus post-CAR T-cell treatment time points. (f) Protein correlates of PSA increase (incr.) and decrease (decr.) in the T-cell rich stromal portion of the TME at 10 days following CART-PSMA-TGFβRDN cell administration. For d-f, protein names colored in purple and green denote markers with a FDR < 0.05.
Figure 5.
Figure 5.. Evaluation of clinical responses and other correlatives following adoptive transfer of CAR T-cells in an mCRPC patient.
(a) Bone scintigraphy (anterior-posterior and posterior-anterior views) for bone metastasis detection in a 71-year-old patient diagnosed with mCRPC is shown. (b) In vivo expansion kinetics of CAR T-cells plotted with changes in serum PSA and (c) TGFβ1 levels over time are depicted. (d) Longitudinal measurements of serum IL-6 and ferritin before and after CAR T-cell infusion are displayed. Various interventions administered for management of cytokine-related toxicity are displayed. (e) Flow cytometric proportions of HLA-DR positive CAR T-cells before and after infusion are shown. (f) Analysis of TCRVβ repertoire diversity in the CART-PSMA-TGFβRDN cell infusion product and following transfer are presented. Each pie chart segment denotes the frequency of clones belonging to a particular TCRVβ family. The annotated nucleotide sequence of the dominant TCRVβ18.1 clone appears below the pie charts. (g) Longitudinal CAR T-cell clonal abundance as indicated by lentiviral integration sites is shown. Different colors (horizontal bars) indicate major cell clones. A key to the sites, named according to the nearest gene, is shown below the graph (abundances < 3% were categorized as “Low Abundance”).

Comment in

Similar articles

Cited by

References

    1. Lu X, et al. Effective combinatorial immunotherapy for castration-resistant prostate cancer. Nature 543, 728–732 (2017). - PMC - PubMed
    1. Venkatachalam S, McFarland TR, Agarwal N & Swami U Immune Checkpoint Inhibitors in Prostate Cancer. Cancers (Basel) 13(2021). - PMC - PubMed
    1. Maude SL, et al. Tisagenlecleucel in Children and Young Adults with B-Cell Lymphoblastic Leukemia. The New England Journal of Medicine 378, 439–448 (2018). - PMC - PubMed
    1. Maude SL, et al. Chimeric antigen receptor T cells for sustained remissions in leukemia. N Engl J Med 371, 1507–1517 (2014). - PMC - PubMed
    1. Schuster SJ, et al. Chimeric Antigen Receptor T Cells in Refractory B-Cell Lymphomas. N Engl J Med 377, 2545–2554 (2017). - PMC - PubMed

Publication types

MeSH terms

Substances

Associated data