

Candidate master microRNA regulator of arsenic-induced pancreatic beta cell impairment revealed by multi-omics analysis
- PMID: 35314868
- PMCID: PMC9095563
- DOI: 10.1007/s00204-022-03263-9
Candidate master microRNA regulator of arsenic-induced pancreatic beta cell impairment revealed by multi-omics analysis
Abstract
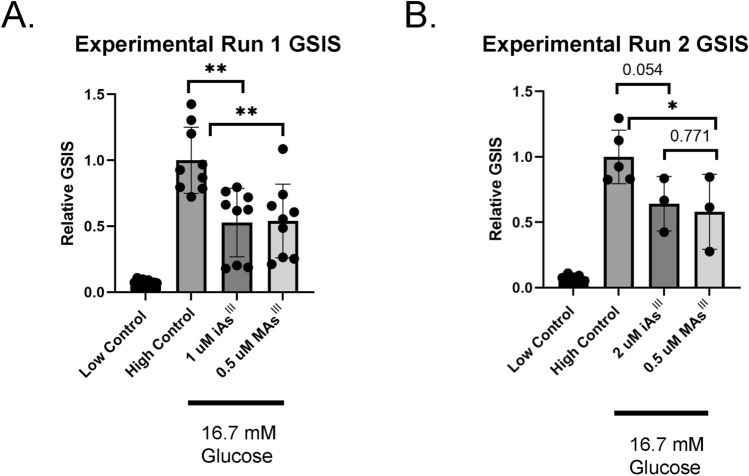
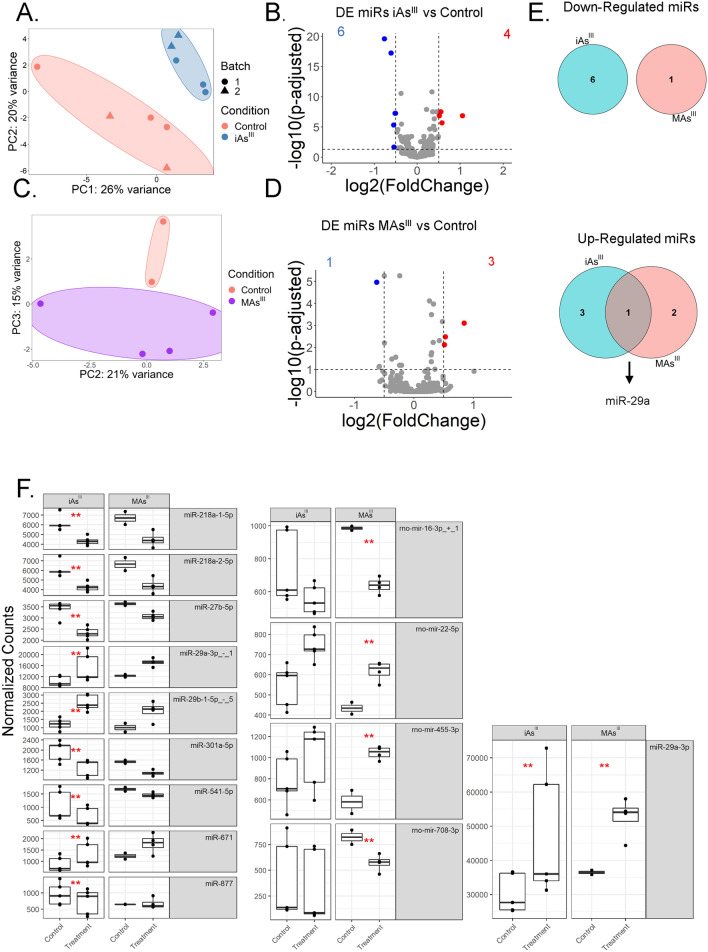
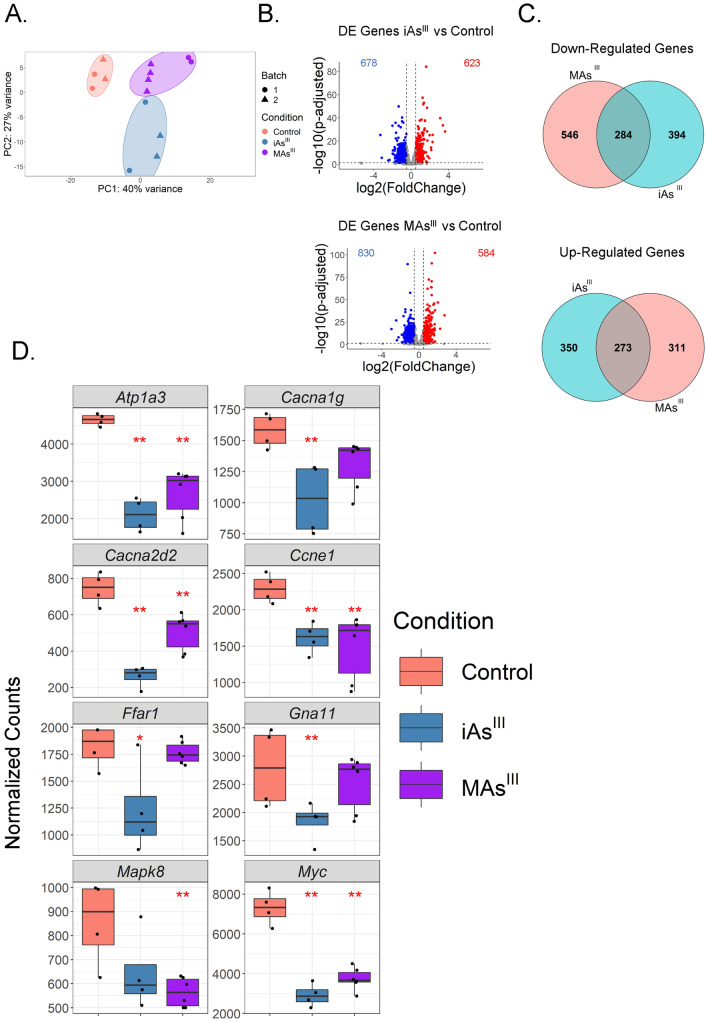
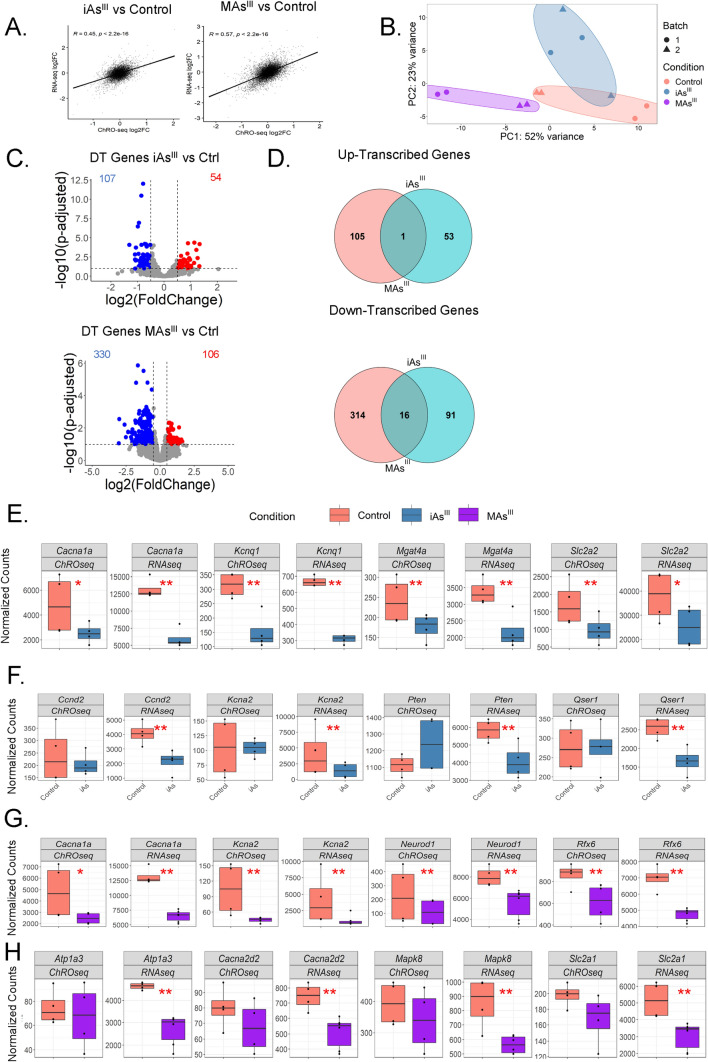
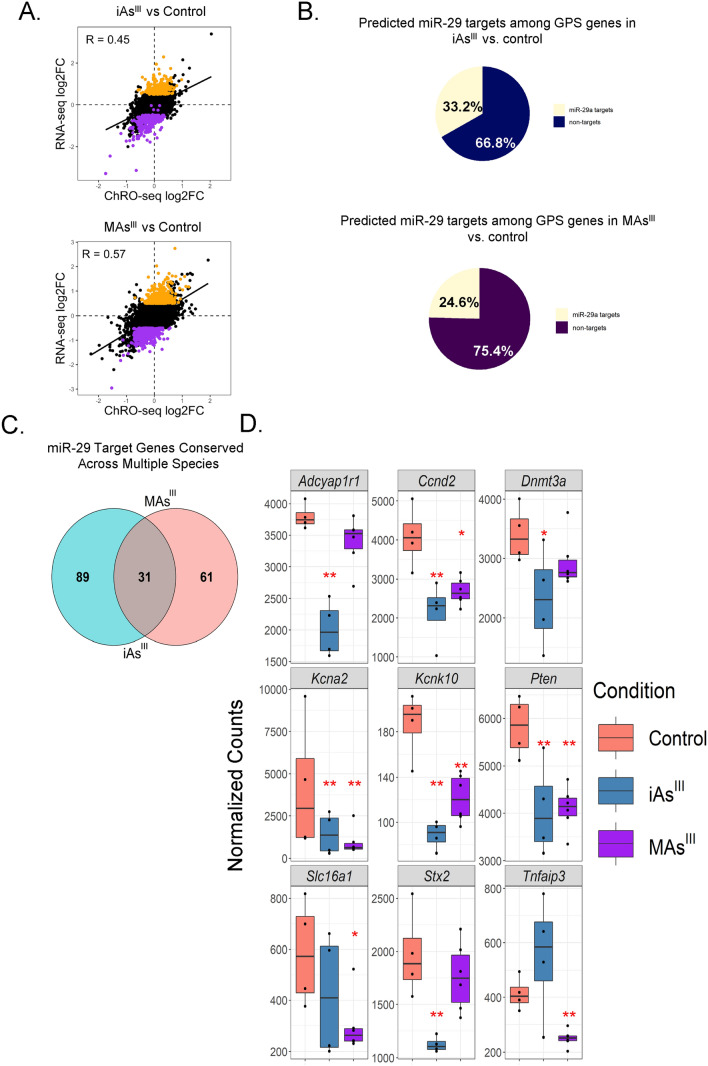
Arsenic is a pervasive environmental toxin that is listed as the top priority for investigation by the Agency for Toxic Substance and Disease Registry. While chronic exposure to arsenic is associated with type 2 diabetes (T2D), the underlying mechanisms are largely unknown. We have recently demonstrated that arsenic treatment of INS-1 832/13 pancreatic beta cells impairs glucose-stimulated insulin secretion (GSIS), a T2D hallmark. We have also shown that arsenic alters the microRNA profile of beta cells. MicroRNAs have a well-established post-transcriptional regulatory role in both normal beta cell function and T2D pathogenesis. We hypothesized that there are microRNA master regulators that shape beta cell gene expression in pathways pertinent to GSIS after exposure to arsenicals. To test this hypothesis, we first treated INS-1 832/13 beta cells with either inorganic arsenic (iAsIII) or monomethylarsenite (MAsIII) and confirmed GSIS impairment. We then performed multi-omic analysis using chromatin run-on sequencing, RNA-sequencing, and small RNA-sequencing to define profiles of transcription, gene expression, and microRNAs, respectively. Integrating across these data sets, we first showed that genes downregulated by iAsIII treatment are enriched in insulin secretion and T2D pathways, whereas genes downregulated by MAsIII treatment are enriched in cell cycle and critical beta cell maintenance factors. We also defined the genes that are subject primarily to post-transcriptional control in response to arsenicals and demonstrated that miR-29a is the top candidate master regulator of these genes. Our results highlight the importance of microRNAs in arsenical-induced beta cell dysfunction and reveal both shared and unique mechanisms between iAsIII and MAsIII.
Keywords: Arsenic; Beta cells; Diabetes; Insulin secretion; MicroRNAs; Sequencing.
© 2022. The Author(s).
Conflict of interest statement
The authors declare no conflicts of interest.
Figures
Similar articles
-
Molecular and Metabolic Analysis of Arsenic-Exposed Humanized AS3MT Mice.Environ Health Perspect. 2023 Dec;131(12):127021. doi: 10.1289/EHP12785. Epub 2023 Dec 27. Environ Health Perspect. 2023. PMID: 38150313 Free PMC article.
-
Exposure to inorganic arsenic and its methylated metabolites alters metabolomics profiles in INS-1 832/13 insulinoma cells and isolated pancreatic islets.Arch Toxicol. 2020 Jun;94(6):1955-1972. doi: 10.1007/s00204-020-02729-y. Epub 2020 Apr 10. Arch Toxicol. 2020. PMID: 32277266 Free PMC article.
-
Systemic pharmacological treatments for chronic plaque psoriasis: a network meta-analysis.Cochrane Database Syst Rev. 2017 Dec 22;12(12):CD011535. doi: 10.1002/14651858.CD011535.pub2. Cochrane Database Syst Rev. 2017. Update in: Cochrane Database Syst Rev. 2020 Jan 9;1:CD011535. doi: 10.1002/14651858.CD011535.pub3. PMID: 29271481 Free PMC article. Updated.
-
C3aR1 on β cells enhances β cell function and survival to maintain glucose homeostasis.Mol Metab. 2025 Jun;96:102134. doi: 10.1016/j.molmet.2025.102134. Epub 2025 Apr 4. Mol Metab. 2025. PMID: 40189102 Free PMC article.
-
The Black Book of Psychotropic Dosing and Monitoring.Psychopharmacol Bull. 2024 Jul 8;54(3):8-59. Psychopharmacol Bull. 2024. PMID: 38993656 Free PMC article. Review.
Cited by
-
Epigenomic reprogramming in iAs-mediated carcinogenesis.Adv Pharmacol. 2023;96:319-365. doi: 10.1016/bs.apha.2022.08.004. Epub 2022 Oct 26. Adv Pharmacol. 2023. PMID: 36858778 Free PMC article.
-
Critical Overview on Endocrine Disruptors in Diabetes Mellitus.Int J Mol Sci. 2023 Feb 25;24(5):4537. doi: 10.3390/ijms24054537. Int J Mol Sci. 2023. PMID: 36901966 Free PMC article. Review.
-
Unveiling the link between arsenic toxicity and diabetes: an in silico exploration into the role of transcription factors.Toxicol Res. 2024 Jul 18;40(4):653-672. doi: 10.1007/s43188-024-00255-y. eCollection 2024 Oct. Toxicol Res. 2024. PMID: 39345741
-
Heritable dysregulation of DNA methylation may underlie the diabetogenic effects of paternal preconception exposure to inorganic arsenic in C57BL/6J mice.Toxicol Appl Pharmacol. 2025 Mar;496:117242. doi: 10.1016/j.taap.2025.117242. Epub 2025 Feb 1. Toxicol Appl Pharmacol. 2025. PMID: 39894169
-
Molecular and Metabolic Analysis of Arsenic-Exposed Humanized AS3MT Mice.Environ Health Perspect. 2023 Dec;131(12):127021. doi: 10.1289/EHP12785. Epub 2023 Dec 27. Environ Health Perspect. 2023. PMID: 38150313 Free PMC article.
References
MeSH terms
Substances
Grants and funding
LinkOut - more resources
Full Text Sources
Medical
