Towards evidence-based conservation of subterranean ecosystems
- PMID: 35315207
- PMCID: PMC9545027
- DOI: 10.1111/brv.12851
Towards evidence-based conservation of subterranean ecosystems
Abstract
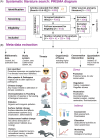
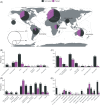
Subterranean ecosystems are among the most widespread environments on Earth, yet we still have poor knowledge of their biodiversity. To raise awareness of subterranean ecosystems, the essential services they provide, and their unique conservation challenges, 2021 and 2022 were designated International Years of Caves and Karst. As these ecosystems have traditionally been overlooked in global conservation agendas and multilateral agreements, a quantitative assessment of solution-based approaches to safeguard subterranean biota and associated habitats is timely. This assessment allows researchers and practitioners to understand the progress made and research needs in subterranean ecology and management. We conducted a systematic review of peer-reviewed and grey literature focused on subterranean ecosystems globally (terrestrial, freshwater, and saltwater systems), to quantify the available evidence-base for the effectiveness of conservation interventions. We selected 708 publications from the years 1964 to 2021 that discussed, recommended, or implemented 1,954 conservation interventions in subterranean ecosystems. We noted a steep increase in the number of studies from the 2000s while, surprisingly, the proportion of studies quantifying the impact of conservation interventions has steadily and significantly decreased in recent years. The effectiveness of 31% of conservation interventions has been tested statistically. We further highlight that 64% of the reported research occurred in the Palearctic and Nearctic biogeographic regions. Assessments of the effectiveness of conservation interventions were heavily biased towards indirect measures (monitoring and risk assessment), a limited sample of organisms (mostly arthropods and bats), and more accessible systems (terrestrial caves). Our results indicate that most conservation science in the field of subterranean biology does not apply a rigorous quantitative approach, resulting in sparse evidence for the effectiveness of interventions. This raises the important question of how to make conservation efforts more feasible to implement, cost-effective, and long-lasting. Although there is no single remedy, we propose a suite of potential solutions to focus our efforts better towards increasing statistical testing and stress the importance of standardising study reporting to facilitate meta-analytical exercises. We also provide a database summarising the available literature, which will help to build quantitative knowledge about interventions likely to yield the greatest impacts depending upon the subterranean species and habitats of interest. We view this as a starting point to shift away from the widespread tendency of recommending conservation interventions based on anecdotal and expert-based information rather than scientific evidence, without quantitatively testing their effectiveness.
Keywords: biospeleology; cave; climate change; conservation biology; ecosystem management; extinction risk; groundwater; legislation; pollution; subterranean biology.
© 2022 The Authors. Biological Reviews published by John Wiley & Sons Ltd on behalf of Cambridge Philosophical Society.
Figures


References
-
- * Aalbu, R. L. & Andrews, F. G. (1992). Revision of the spider beetle genus Niptus in North America, including new cave and phloeophile species (Coleoptera: Ptinidae). Pan‐Pacific Entomologist 68, 73–96.
-
- Abellán, P. , Sánchez‐Fernández, D. , Velasco, J. & Millán, A. (2005). Conservation of freshwater biodiversity: a comparison of different area selection methods. Biodiversity and Conservation 14, 3457–3474.
-
- * Achurra, A. & Rodriguez, P. (2008). Biodiversity of groundwater oligochaetes from a karst unit in northern Iberian Peninsula: ranking subterranean sites for conservation management. Hydrobiologia 605, 159–171.
-
- Adamo, M. , Chialva, M. , Calevo, J. , Bertoni, F. , Dixon, K. & Mammola, S. (2021). Plant scientists' research attention is skewed towards colourful, conspicuous and broadly distributed flowers. Nature Plants 7, 574–578. - PubMed

