. 2022 Sep;18(36):e2201115.
doi: 10.1002/smll.202201115. Epub 2022 Mar 22.

Sticking Together: Injectable Granular Hydrogels with Increased Functionality via Dynamic Covalent Inter-Particle Crosslinking

Affiliations

Sticking Together: Injectable Granular Hydrogels with Increased Functionality via Dynamic Covalent Inter-Particle Crosslinking

Victoria G Muir et al. Small. 2022 Sep.

Abstract

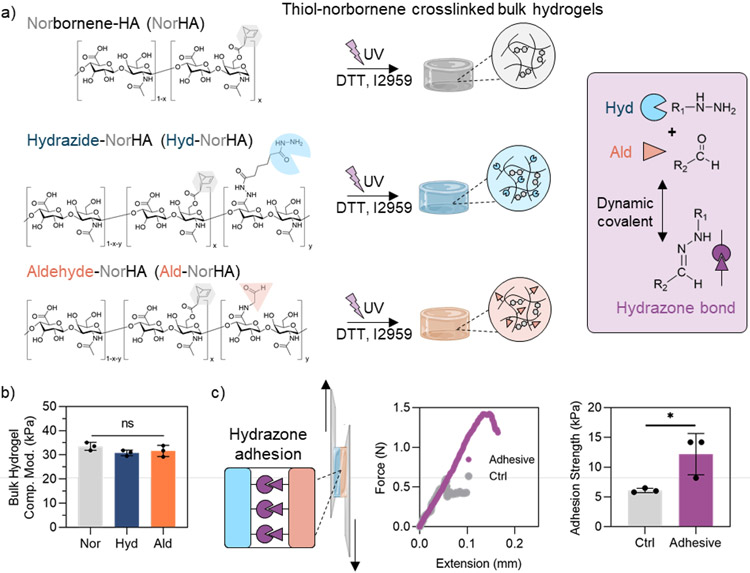
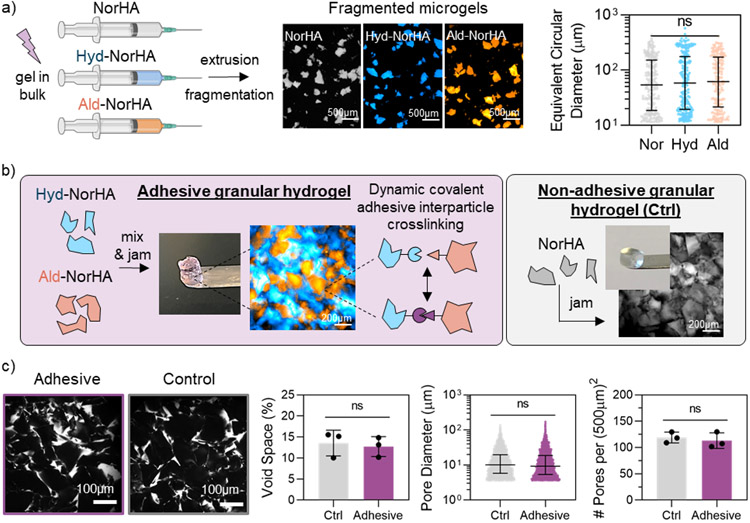
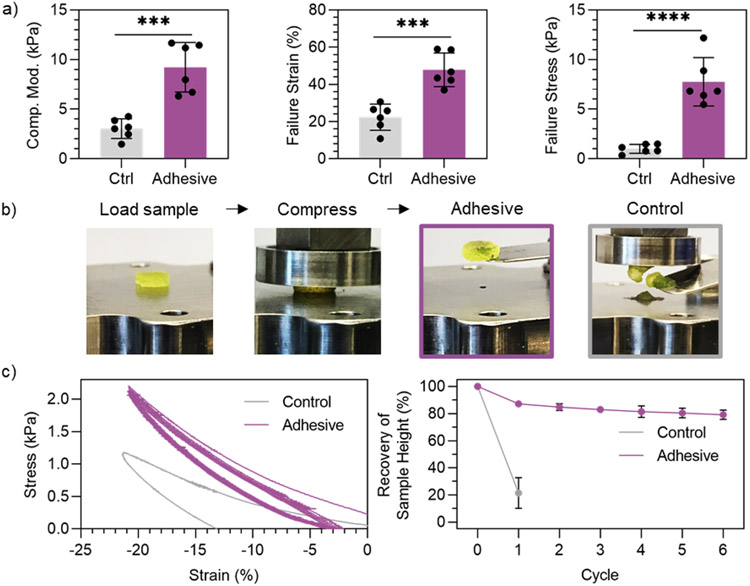
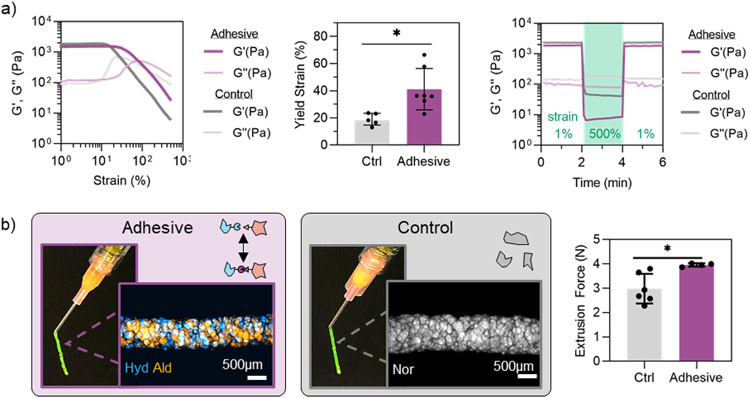
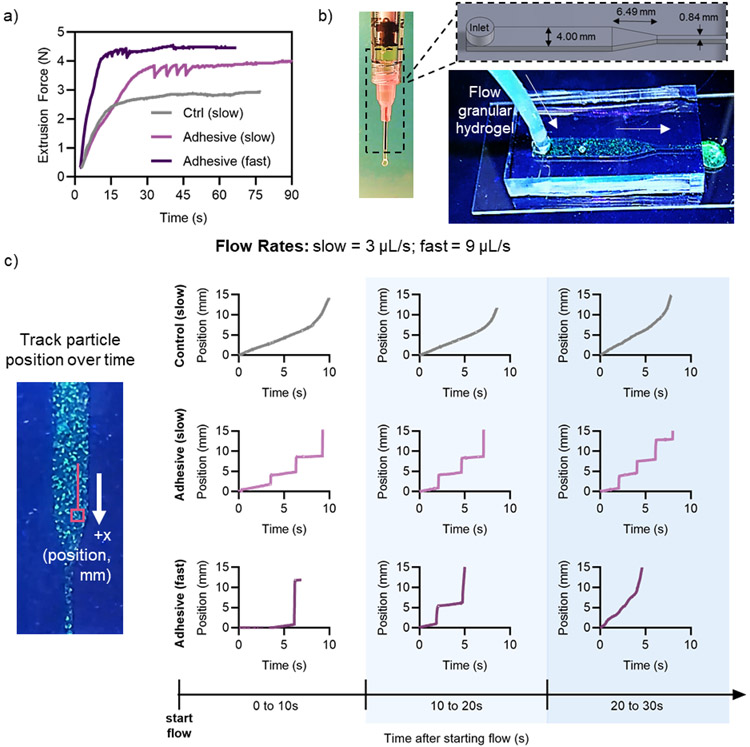
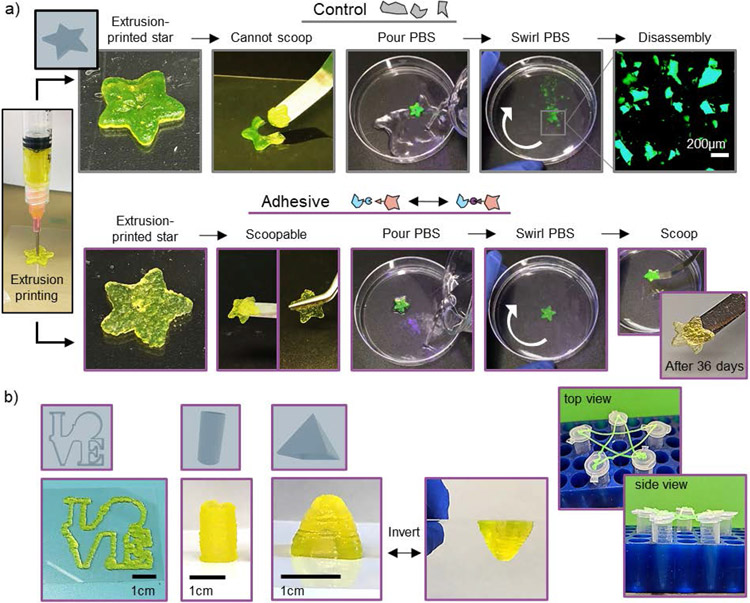
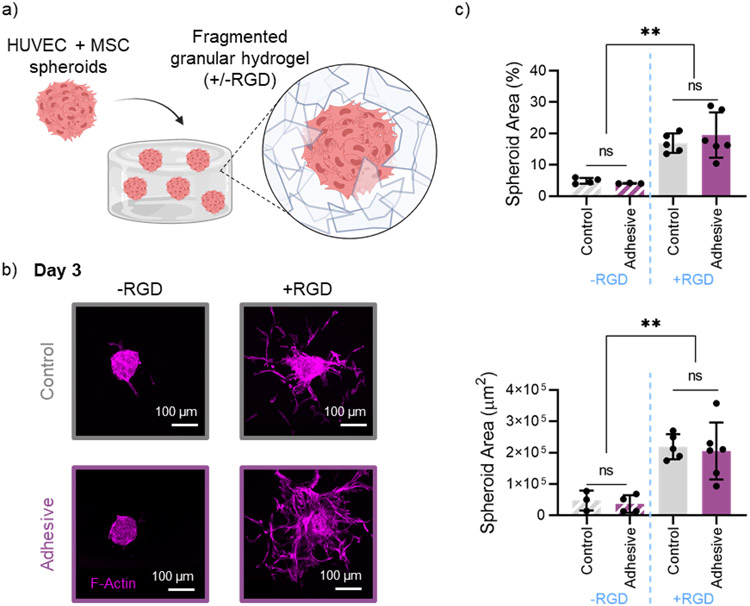
Granular hydrogels are an exciting class of microporous and injectable biomaterials that are being explored for many biomedical applications, including regenerative medicine, 3D printing, and drug delivery. Granular hydrogels often possess low mechanical moduli and lack structural integrity due to weak physical interactions between microgels. This has been addressed through covalent inter-particle crosslinking; however, covalent crosslinking often occurs through temporal enzymatic methods or photoinitiated reactions, which may limit injectability and material processing. To address this, a hyaluronic acid (HA) granular hydrogel is developed with dynamic covalent (hydrazone) inter-particle crosslinks. Extrusion fragmentation is used to fabricate microgels from photocrosslinkable norbornene-modified HA, additionally modified with either aldehyde or hydrazide groups. Aldehyde and hydrazide-containing microgels are mixed and jammed to form adhesive granular hydrogels. These granular hydrogels possess enhanced mechanical integrity and shape stability over controls due to the covalent inter-particle bonds, while maintaining injectability due to the dynamic hydrazone bonds. The adhesive granular hydrogels are applied to 3D printing, which allows the printing of structures that are stable without any further post-processing. Additionally, the authors demonstrate that adhesive granular hydrogels allow for cell invasion in vitro. Overall, this work demonstrates the use of dynamic covalent inter-particle crosslinking to enhance injectable granular hydrogels.

Keywords: dynamic covalent; extrusion fragmentation; extrusion printing; granular hydrogels; injectable hydrogels; inter-particle crosslinking.


Conflict of interest statement

Conflict of Interest

The authors declare no conflict of interest.

Figures

Figure 1.
Figure 1.
Bulk hydrogel characterization. a) Overview of modified-hyaluronic acid (HA) chemical structures (left), which photocrosslink upon the addition of crosslinker (dithiothreitol, DTT) and photoinitiator (Irgacure D-2959, I2959) and exposure to UV light to form bulk hydrogels (center). Dynamic covalent hydrazone interactions form between hydrazide and aldehyde groups (right, purple box). b) Compressive moduli of bulk hydrogels. c) Schematic of the adhesion testing of bulk hydrogels (left), representative plots of tensile force v. extension (center), and quantified adhesion strengths of controls (NorHA hydrogels alone) and adhesive (Hyd-NorHA and Ald-NorHA hydrogels) hydrogels (right). Data presented as mean ± standard deviation, with a sample size of n = 3. Statistical analysis performed using a one-way ANOVA. ns = no significance, *p<0.05.
Figure 2.
Figure 2.
Microgel and granular hydrogel formation. a) Overview of extrusion fragmentation microgel fabrication method (left), representative fluorescent microscopy images of fragmented microgels in suspension (center), and size characterization of fragmented microgels (right). b) Overview of adhesive granular hydrogel formation (left, purple box), and formation of non-adhesive control granular hydrogels (right, grey box). Includes fluorescent microscopy images of (left) adhesive granular hydrogels (Hyd-NorHA microgels labelled with FITC-dextran [blue], Ald-NorHA microgels labelled with Rhodamine-BSA [orange]) in purple box, and (right) control granular hydrogels (NorHA microgels labelled with FITC-dextran [grey]) in grey box. c) Confocal microscopy images of fluorescently-labelled pores (white) within granular hydrogels (left) and characterization of porosity, including void space %, pore diameter, and number of pores per (500μm)2 (right). For void space (%) and number of pores per (500μm)2, data is presented as mean ± standard deviation, with a sample size of n ≥ 3. Statistical analysis performed using a one-way ANOVA. For microgel and pore diameters, data is presented as mean ± inner quartile range. ns = no significance.
Figure 3.
Figure 3.
Compression testing of granular hydrogels. a) Quantified compressive moduli (5% to 10% strain, left), failure strain (center), and failure stress (right) of adhesive granular hydrogels and controls at 1 h post-jamming. b) Macroscopic images of loading and compressing granular hydrogel samples (left) and the condition of the samples after loading to 20% strain (right). c) Representative behavior of granular hydrogels upon cyclic loading to 20% compressive strain followed by return to 0 N (left), and quantified recovery of sample height after cyclic compressive loading (right). Data is presented as mean ± standard deviation, with a sample size of n = 6. Statistical analysis performed using a one-way ANOVA. ***p<0.001, ****p<0.0001.
Figure 4.
Figure 4.
Granular hydrogel flow properties. a) Rheological characterization of adhesive granular hydrogels and controls showing strain sweeps from 1-500% strain at 1 Hz (left), quantified yield strain (G’ < 0.9G’initial) (center), and a rapid reduction and recovery of G′ with low (unshaded, 1% strain, 1 Hz) and high (green, 500% strain, 1 Hz) strain cycles (right). b) Macroscopic images of granular hydrogels extruded from an 18G needle and fluorescent microscopy images of extruded filaments, showing adhesive (left) and control (center) granular hydrogels, and extrusion force measurements through an 18G needle at a flow rate of 3 μL/s (right). Data is presented as mean ± standard deviation, with a sample size of n ≥ 4. Statistical analysis performed using a one-way ANOVA. *p<0.05.
Figure 5.
Figure 5.
Contraction flow of granular hydrogels. a) Extrusion force measurements over time for the control and adhesive granular hydrogel samples at slow (3 μL/s) and fast (9 μL/s) flow rates. b) Overview of contraction flow device, showing device dimensions (top) and fluorescently labelled granular hydrogel flowing through device (bottom). c) Representative trajectories of tracked particle position in the contraction flow device as a function of time, including representative trajectories at multiple time intervals after starting flow in the device (0 to 10 s, 10 to 20 s, and 20 to 30 s).
Figure 6.
Figure 6.
Extrusion printing with granular hydrogels. a) Macroscopic images depicting the stability of extrusion printed stars using control (top) or adhesive (bottom) granular hydrogels, showing printed star, manipulation, shape stability in upon agitation in phosphate-buffered saline (PBS), and long-term stability of adhesive granular hydrogel constructs (36 days). b) Macroscopic images of extrusion structures fabricated with adhesive granular hydrogels, including an outline of the LOVE statue found in Philadelphia (left), a 2 cm-tall hollow cylinder (center), a 1 cm-tall pyramid that can be inverted and maintain its shape (center), and a suspended star outline supported by the tops of five microcentrifuge tubes (right).
Figure 7.
Figure 7.
In vitro cell invasion in granular hydrogels. a) Schematic overview of embedding multicellular spheroids (HUVECs + hMSCs) in a fragmented granular hydrogel, with or without the addition RGD. b) Representative confocal microscopy images of F-Actin staining, showing spheroid outgrowth into granular hydrogels (top: control, bottom: adhesive), without RGD (left) and with RGD (right) after 3 days. c) Quantification of spheroid coverage area by percent (top) and absolute area in μm2 (bottom). Data is presented as mean ± standard deviation, with a sample size of n ≥ 3. Statistical analysis performed using a one-way ANOVA. ns = no significance, **p<0.01.

References

    1. Mandal A, Clegg JR, Anselmo AC, Mitragotri S, Bioeng. Transl. Med 2020, 5, 1. - PMC - PubMed
    1. Lee SC, Gillispie G, Prim P, Lee SJ, Chem. Rev 2020, 120, 10834. - PMC - PubMed
    1. Uman S, Dhand A, Burdick JA, J. Appl. Polym. Sci 2019, 48668.
    1. Qu J, Zhao X, Ma PX, Guo B, Acta Biomater. 2017, 58, 168. - PubMed
    1. Sun Y, Huang Y, J. Mater. Chem. B 2016, 4, 2768. - PubMed

Publication types

LinkOut - more resources