. 2022 Aug;74(8):1440-1450.
doi: 10.1002/art.42122. Epub 2022 Jun 27.

Complement C4 Copy Number Variation is Linked to SSA/Ro and SSB/La Autoantibodies in Systemic Inflammatory Autoimmune Diseases

Collaborators, Affiliations

Complement C4 Copy Number Variation is Linked to SSA/Ro and SSB/La Autoantibodies in Systemic Inflammatory Autoimmune Diseases

Christian Lundtoft et al. Arthritis Rheumatol. 2022 Aug.

Abstract

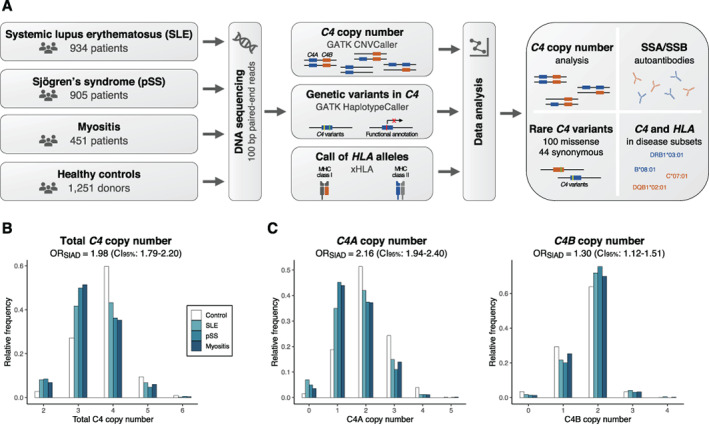
Objective: Copy number variation of the C4 complement components, C4A and C4B, has been associated with systemic inflammatory autoimmune diseases. This study was undertaken to investigate whether C4 copy number variation is connected to the autoimmune repertoire in systemic lupus erythematosus (SLE), primary Sjögren's syndrome (SS), or myositis.

Methods: Using targeted DNA sequencing, we determined the copy number and genetic variants of C4 in 2,290 well-characterized Scandinavian patients with SLE, primary SS, or myositis and 1,251 healthy controls.

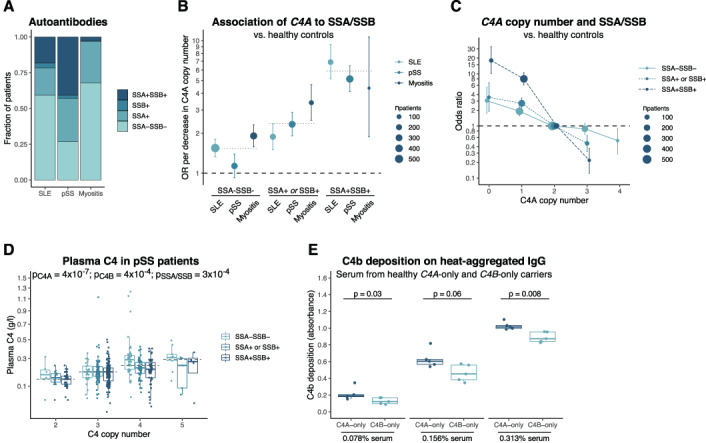
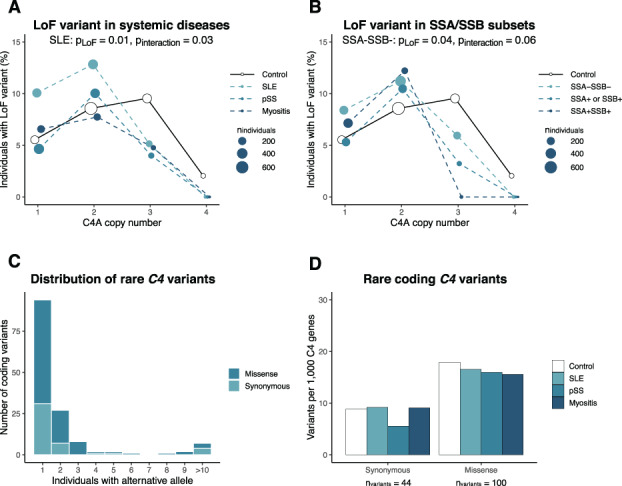
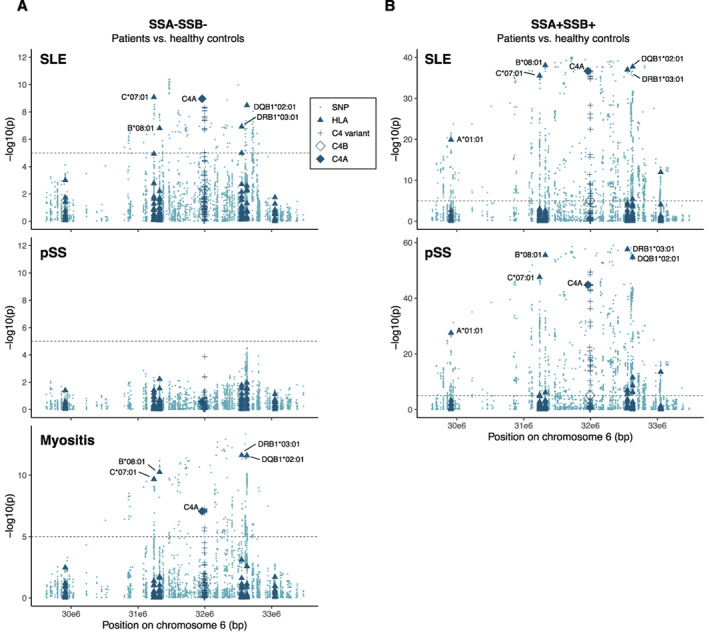
Results: A prominent relationship was observed between C4A copy number and the presence of SSA/SSB autoantibodies, which was shared between the 3 diseases. The strongest association was detected in patients with autoantibodies against both SSA and SSB and 0 C4A copies when compared to healthy controls (odds ratio [OR] 18.0 [95% confidence interval (95% CI) 10.2-33.3]), whereas a weaker association was seen in patients without SSA/SSB autoantibodies (OR 3.1 [95% CI 1.7-5.5]). The copy number of C4 correlated positively with C4 plasma levels. Further, a common loss-of-function variant in C4A leading to reduced plasma C4 was more prevalent in SLE patients with a low copy number of C4A. Functionally, we showed that absence of C4A reduced the individuals' capacity to deposit C4b on immune complexes.

Conclusion: We show that a low C4A copy number is more strongly associated with the autoantibody repertoire than with the clinically defined disease entities. These findings may have implications for understanding the etiopathogenetic mechanisms of systemic inflammatory autoimmune diseases and for patient stratification when taking the genetic profile into account.


Figures

Figure 1
Figure 1
Association between complement C4 copy number and 3 systemic inflammatory autoimmune diseases (SIADs). A Workflow for analysis. Three patient groups with systemic inflammatory autoimmune diseases and 1 reference cohort were analyzed for HLA alleles and copy number of the paralogous C4 genes C4A and C4B, using targeted sequencing data. Association analysis of C4 was performed for clinical subsets of the diseases. Additionally, common and rare variants in the C4 genes were analyzed from the sequencing data. B, Total C4 copy number in healthy controls and patients with systemic lupus erythematous (SLE), primary Sjögren's syndrome (SS), or myositis (n = 3,541). Logistic regression was performed to analyze associations in the combined patient group compared to healthy controls, with adjustment for sex and principal components 1–4 (PC1–PC4). Odds ratios (ORs) represent disease risk in association with each decrease in C4 copy number. C, Copy number of C4A and C4B in each patient group and healthy controls (n = 3,520). Analysis is based on logistic regression with both C4A and C4B included as additive variables and with adjustment for sex and PC1–PC4. ORs represent disease risk in association with each decrease in C4A or C4B copy number. MHC = major histocompatibility complex; CI95% = 95% confidence interval.
Figure 2
Figure 2
Association between C4 copy number and anti‐SSA/SSB autoantibodies. A, Prevalence of anti‐SSA/anti‐SSB autoantibodies in patients with SLE (n = 919), primary SS (n = 902), or myositis (n = 364). B, Logistic regression analysis of association between each decrease in C4A copy number and anti‐SSA/anti‐SSB autoantibody status among each patient group compared to healthy controls. Dotted lines indicate ORs for association in the combined group of 3 diseases. C, Logistic regression analysis of association between C4A copy number and anti‐SAA/anti‐SSB autoantibody status in the combined patient group compared to healthy controls. In B and C, bars represent 95% confidence intervals, and models have been adjusted for presence of C4B, sex, and PC1–PC4. D, Plasma C4 levels in patients with primary SS. Groups were compared by analysis of variance with square root–transformed values for the C4 concentration, adjusted for sex and cohort (n = 470). C4A and C4B copy number was included in the model; the x‐axis shows total C4 copy number for simplicity. E, Deposition of the complement activation product C4b on heat‐aggregated human IgG, analyzed with varying concentrations of serum from healthy individuals carrying C4A genes only (n = 5) or C4B genes only (n = 5). The samples were analyzed ≥3 times, and the mean absorbance for each sample was evaluated using the Mann‐Whitney U test. In D and E, Data are shown as box plots. Each box represents the 25th to 75th percentiles. Lines inside the boxes represent the median, and whiskers extend to 1.5 times the interquartile range. See Figure 1 for other definitions. Color figure can be viewed in the online issue, which is available at http://onlinelibrary.wiley.com/doi/10.1002/art.42122/abstract.
Figure 3
Figure 3
Loss‐of‐function (LoF) variant in C4A and rare variants in C4 genes. A, Proportion of patients and healthy controls carrying the C4A LoF variant rs760602547. B, Proportion of the LoF variant rs760602547 among SSA/SSB autoantibody subgroups combined across the 3 systemic inflammatory autoimmune diseases and healthy controls. Patients (or SSA/SSB subgroups) and controls were grouped based on C4A copy number, and the size of points indicate the total number of individuals in each group with the specific C4A copy number. P values are based on logistic regression with interaction between C4A copy number and rs760602547. The LoF variant was only present among individuals with 1–4 C4A genes. C, Number of individuals carrying rare (present among <0.5% of all individuals) coding variants in ≥1 C4 gene (synonymous, n = 44; missense, n = 100). Variants present among 10–17 individuals have been combined. D, Number of C4 genes carrying a rare coding variant in each disease cohort. The number of variants in each disease group has been adjusted for total C4 copy number in order to account for lower copy number of C4 among patients with systemic inflammatory autoimmune diseases. See Figure 1 for other definitions. Color figure can be viewed in the online issue, which is available at http://onlinelibrary.wiley.com/doi/10.1002/art.42122/abstract.
Figure 4
Figure 4
Association of variants in the HLA region with anti‐SSA/SSB–negative and anti‐SSA/SSB–positive patients. A, Association of variants in HLA region in patients with SLE (n = 544), primary SS (n = 241), or myositis (n = 247) who were negative for autoantibodies against SSA/SSB, as compared to healthy controls (n = 1,251). B, Regional association plot of HLA variants in patients with SLE (n = 168) or primary SS (n = 368) who were positive for autoantibodies against both SSA and SSB, as compared to healthy controls (n = 1,251). Few myositis patients (n = 11) had autoantibodies to both SSA and SSB, and therefore the data for these patients were not plotted. HLA alleles for 6 genes (HLA–A, HLA–C, HLA–B, HLA–DRB1, HLA–DQB1, and HLA–DPB1) and variants in C4 present in >1% of individuals were included in the analysis. Groups were analyzed for associations using logistic regression with adjustment for sex and PC1–PC4. Dashed lines represent the Bonferroni‐corrected significance threshold (P = 1 × 10−5). Color figure can be viewed in the online issue, which is available at http://onlinelibrary.wiley.com/doi/10.1002/art.42122/abstract.

Comment in

References

    1. Bentham J, Morris DL, Graham DS, Pinder CL, Tombleson P, Behrens TW, et al. Genetic association analyses implicate aberrant regulation of innate and adaptive immunity genes in the pathogenesis of systemic lupus erythematosus. Nat Genet 2015;47:1457. - PMC - PubMed
    1. Langefeld CD, Ainsworth HC, Graham DS, Kelly JA, Comeau ME, Marion MC, et al. Transancestral mapping and genetic load in systemic lupus erythematosus. Nat Commun 2017;8:16021. - PMC - PubMed
    1. Lessard CJ, Li H, Adrianto I, Ice JA, Rasmussen A, Grundahl KM, et al. Variants at multiple loci implicated in both innate and adaptive immune responses are associated with Sjögren's syndrome. Nat Genet 2013;45:1284. - PMC - PubMed
    1. Taylor KE, Wong Q, Levine DM, McHugh C, Laurie C, Doheny K, et al. Genome‐wide association analysis reveals genetic heterogeneity of Sjögren's syndrome according to ancestry. Arthritis Rheumatol 2017;69:1294–305. - PMC - PubMed
    1. Miller FW, Chen W, O'Hanlon TP, Cooper RG, Vencovsky J, Rider LG, et al. Genome‐wide association study identifies HLA 8.1 ancestral haplotype alleles as major genetic risk factors for myositis phenotypes. Genes Immun 2015;16:470–80. - PMC - PubMed

Publication types