. 2022 Mar 22:11:e72460.
doi: 10.7554/eLife.72460.

Phylogenomic analyses of echinoid diversification prompt a re-evaluation of their fossil record

Affiliations

Phylogenomic analyses of echinoid diversification prompt a re-evaluation of their fossil record

Nicolás Mongiardino Koch et al. Elife. .

Abstract

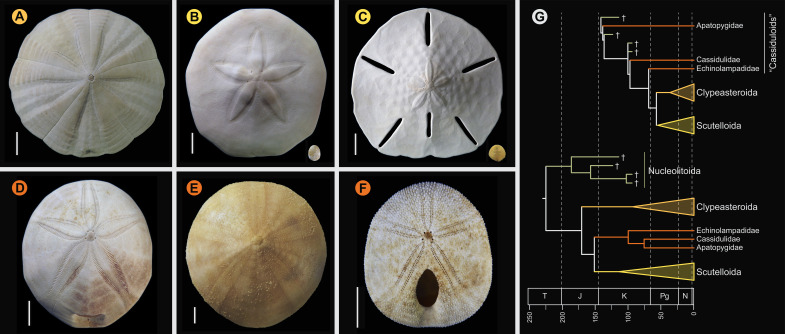
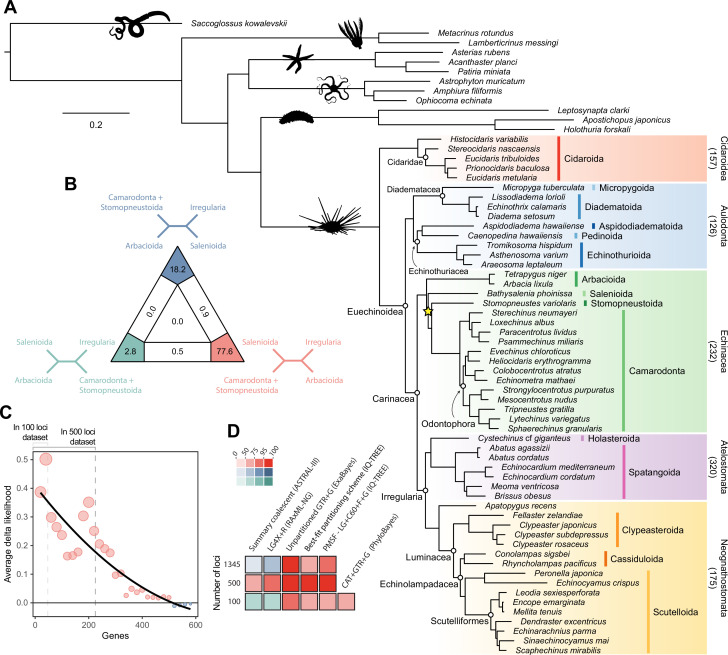
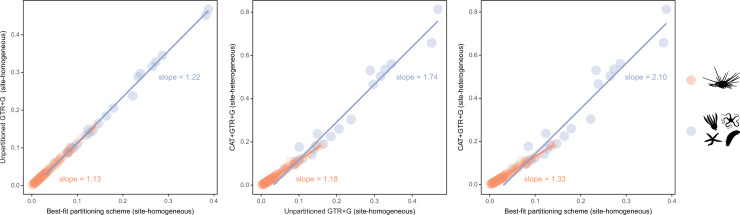
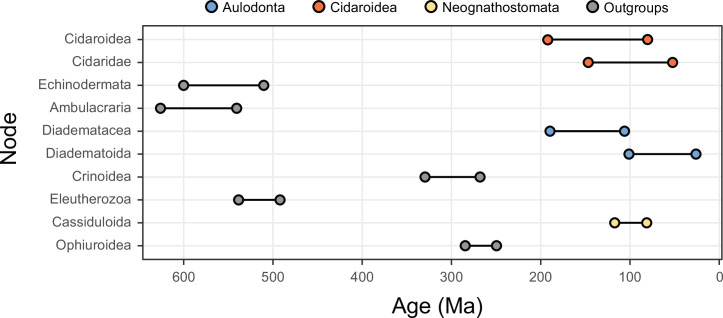
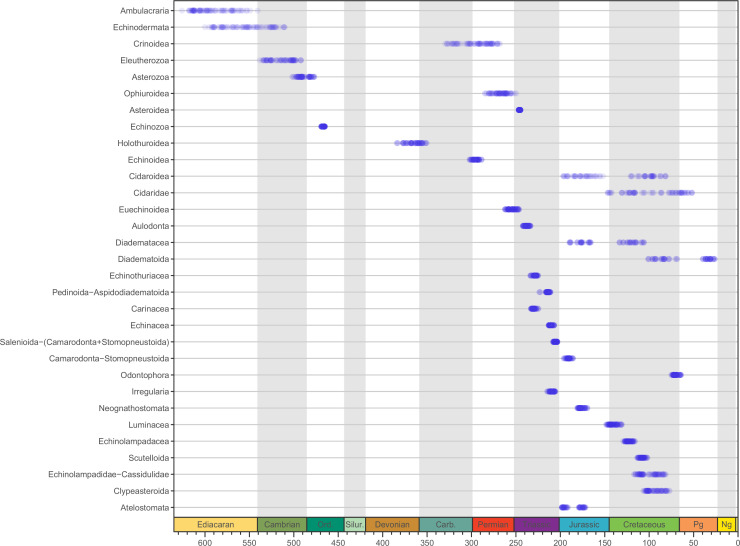
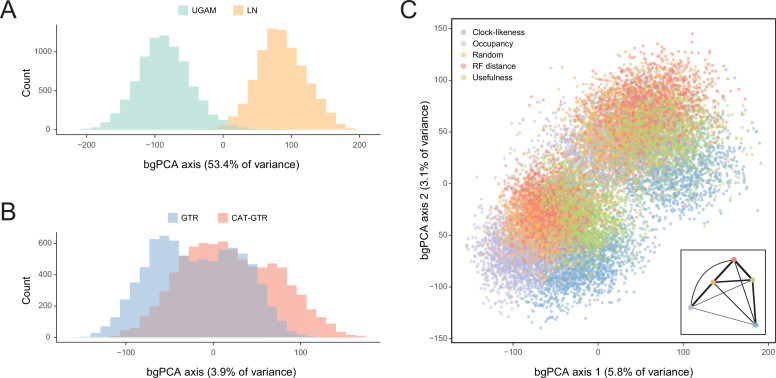
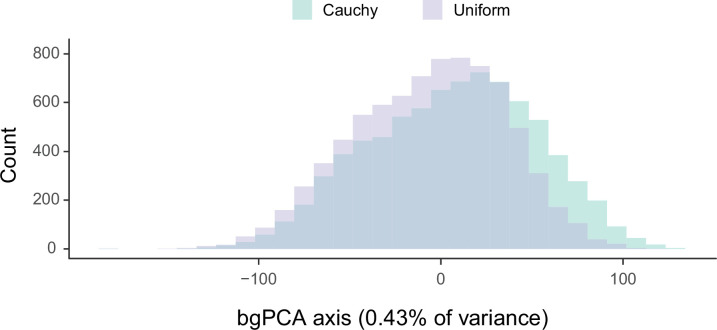
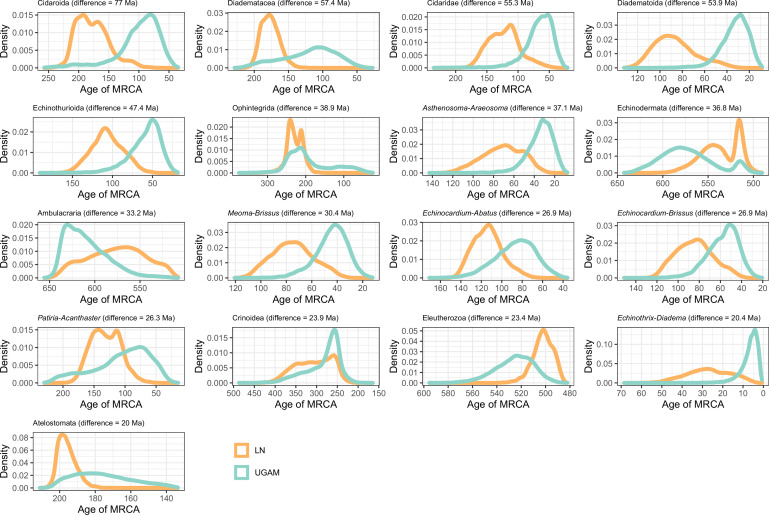
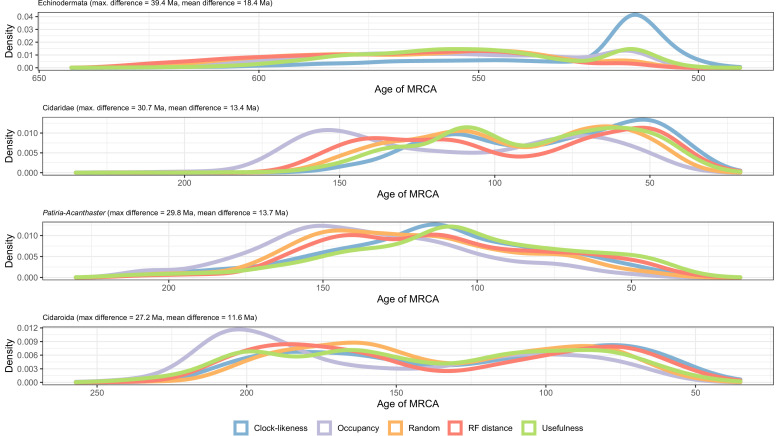
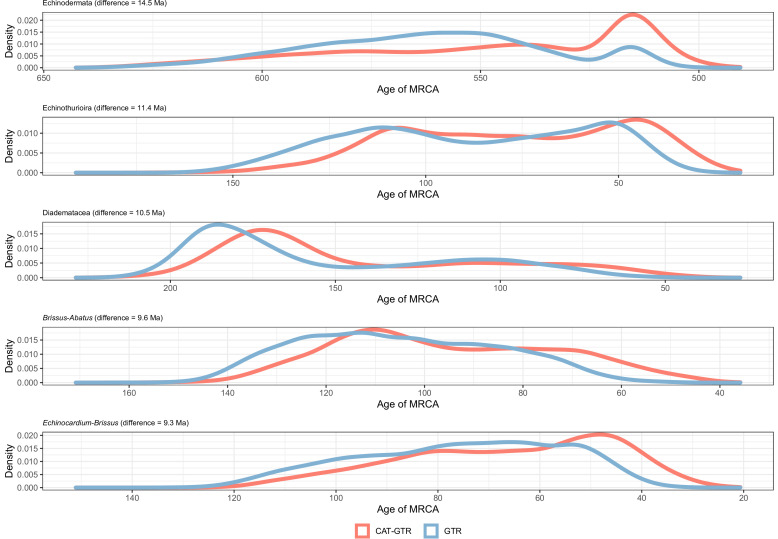
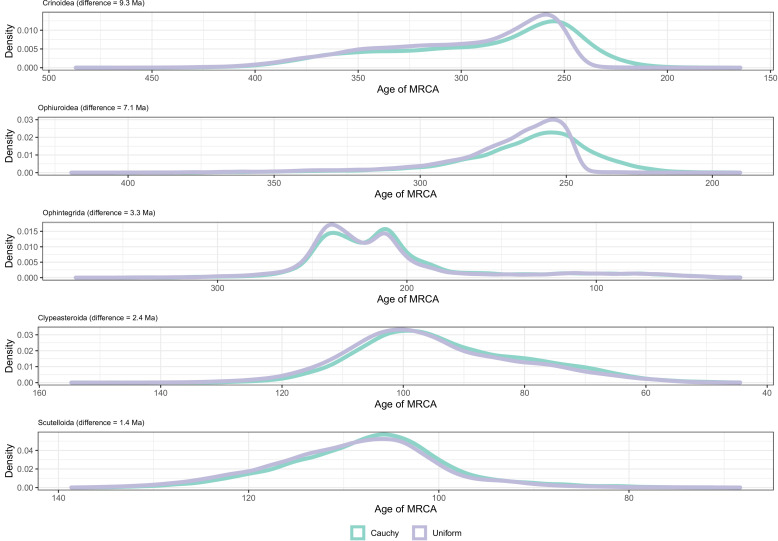
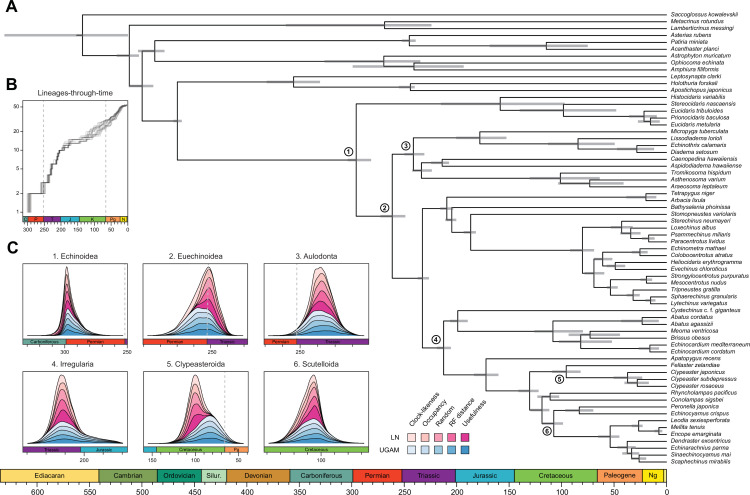
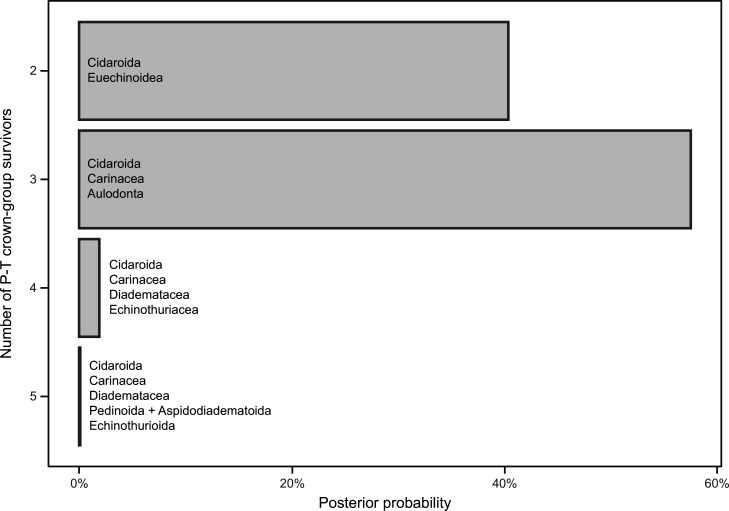
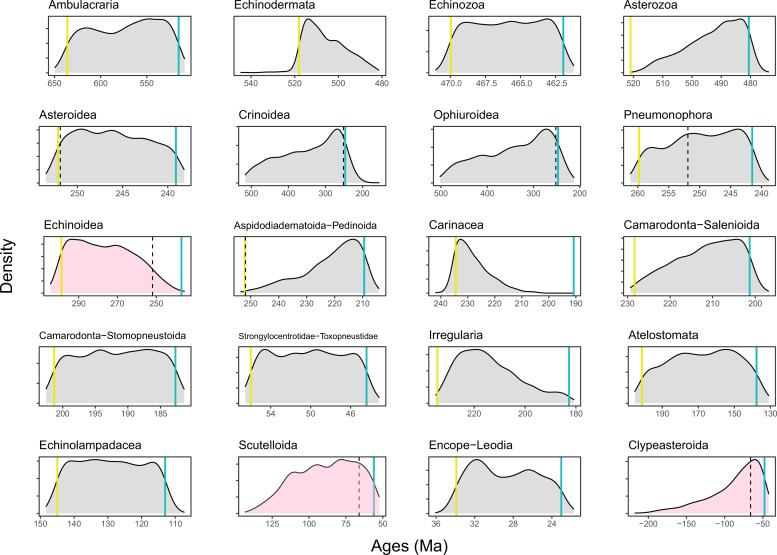
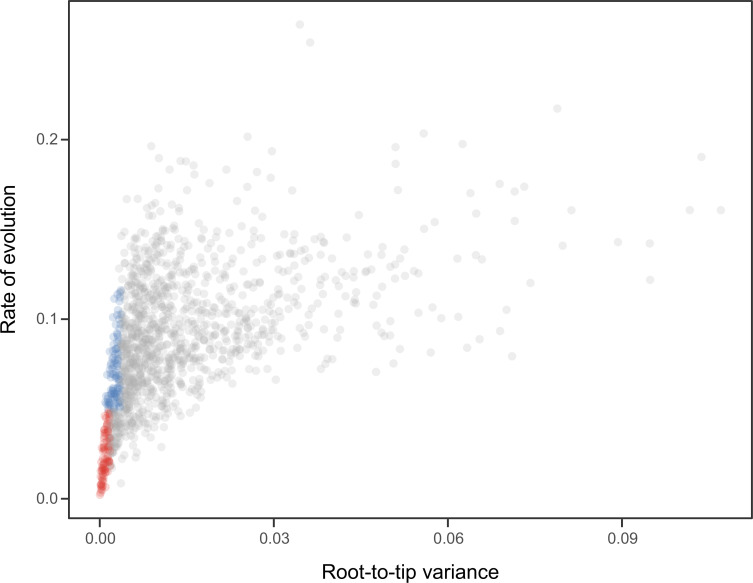
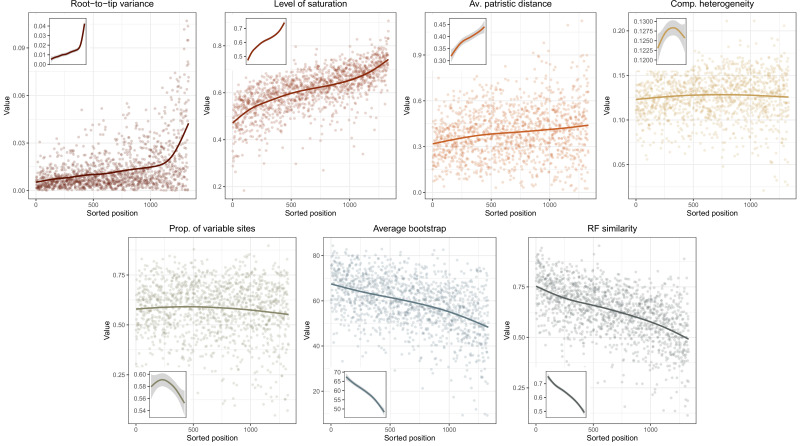
Echinoids are key components of modern marine ecosystems. Despite a remarkable fossil record, the emergence of their crown group is documented by few specimens of unclear affinities, rendering their early history uncertain. The origin of sand dollars, one of its most distinctive clades, is also unclear due to an unstable phylogenetic context. We employ 18 novel genomes and transcriptomes to build a phylogenomic dataset with a near-complete sampling of major lineages. With it, we revise the phylogeny and divergence times of echinoids, and place their history within the broader context of echinoderm evolution. We also introduce the concept of a chronospace - a multidimensional representation of node ages - and use it to explore methodological decisions involved in time calibrating phylogenies. We find the choice of clock model to have the strongest impact on divergence times, while the use of site-heterogeneous models and alternative node prior distributions show minimal effects. The choice of loci has an intermediate impact, affecting mostly deep Paleozoic nodes, for which clock-like genes recover dates more congruent with fossil evidence. Our results reveal that crown group echinoids originated in the Permian and diversified rapidly in the Triassic, despite the relative lack of fossil evidence for this early diversification. We also clarify the relationships between sand dollars and their close relatives and confidently date their origins to the Cretaceous, implying ghost ranges spanning approximately 50 million years, a remarkable discrepancy with their rich fossil record.

Keywords: divergence time estimation; echinoidea; evolutionary biology; phylogenomics; sand dollars; sea urchins; site-heterogeneous models; time calibration.


Conflict of interest statement

NM, JT, AH, MM, AA, SC, FA, OB, AK, RM, GR No competing interests declared

Figures

Figure 1.
Figure 1.. Neognathostomate diversity and phylogenetic relationships.
(A) Fellaster zelandiae, North Island, New Zealand (Clypeasteroida). (B) Large specimen: Peronella japonica, Ryukyu Islands, Japan; Small specimen: Echinocyamus crispus, Maricaban Island, Philippines (Laganina: Scutelloida). (C) Large specimen: Leodia sexiesperforata, Long Key, Florida; Small specimen: Sinaechinocyamus mai, Taiwan (Scutellina: Scutelloida). (D) Rhyncholampas pacificus, Isla Isabela, Galápagos Islands (Cassidulidae). (E) Conolampas sigsbei, Bimini, Bahamas (Echinolampadidae). (F)Apatopygus recens, Australia (Apatopygidae). (G) Hypotheses of relationships among neognathostomates. Top: Morphology supports a clade of Clypeasteroida + Scutelloida originating after the Cretaceous-Paleogene (K-Pg) boundary, subtended by a paraphyletic assemblage of extant (red) and extinct (green) ‘cassiduloids’ (Kroh and Smith, 2010). Bottom: A recent total-evidence study split cassiduloid diversity into a clade of extant lineages closely related to scutelloids, and an unrelated clade of extinct forms (Nucleolitoida; Mongiardino Koch and Thompson, 2021d). Divergence times are much older and conflict with fossil evidence. Cassidulids and apatopygids lacked molecular data in this analysis. Scale bars = 10 mm.
Figure 2.
Figure 2.. Phylogenetic relationships among major clades of Echinoidea.
(A) Favored topology, as obtained using the full supermatrix and a best-fit partitioning scheme in IQ-TREE (Nguyen et al., 2015). With the exception of a single contentious node within Echinacea (marked with a yellow star), all methods supported the same pattern of relationships, and assigned maximum support values to all nodes. Numbers below major clades correspond to the current numbers of described living species (obtained from Kroh and Mooi, 2020). (B) Likelihood-mapping analysis showing the proportion of quartets supporting different resolutions within Echinacea. While the majority of quartets support the topology depicted in A (shown in red), a relatively large number support an alternative resolution that has been recovered in morphological analyses (shown in blue; Kroh and Smith, 2010). (C) Difference in likelihood score (delta likelihood) for the two resolutions of Echinacea most strongly supported in the likelihood-mapping analysis. Genes were sorted based on their inferred phylogenetic usefulness (Mongiardino Koch, 2021b), and gene-wise delta scores were averaged for datasets composed of multiples of 20 loci. Support for a clade of Salenioida + (Camarodonta + Stomopneustoida), as depicted in A, is seen as positive delta scores and is predominantly concentrated among the most phylogenetically useful loci. This signal is attenuated in larger datasets that contain less reliable genes, eventually favoring an alternative resolution (as seen by negative scores for the largest datasets). Only the 584 loci containing data for the three main lineages of Echinacea were considered. The line corresponds to a second-degree polynomial regression. (D) Resolution and bootstrap scores (see color scale) of the topology within Echinacea found using datasets of different sizes and alternative methods of inference.
Figure 3.
Figure 3.. Estimated branch lengths across different models of molecular evolution.
Different site-homogeneous models (left) infer similar levels of divergence, and the choice between them induces little distortion in the general tree structure. Site-heterogeneous models on the other hand not only infer a larger degree of divergence between terminals relative to site-homogeneous ones (center and right), but they also distort the tree (i.e., impose a non-isometric stretching), with branch lengths connecting outgroup taxa expanding much more than those within the ingroup clade.
Figure 4.
Figure 4.. The 10 most sensitive node dates are found within Cidaroidea, Aulodonta, Neognathostomata, and among outgroup nodes.
For each, the range shown spans the interval between the minimum and maximum ages found among the consensus topologies of the 80 time-calibrated runs performed.
Figure 4—figure supplement 1.
Figure 4—figure supplement 1.. Median ages for selected clades across the consensus trees of the 80 time-calibrated experiments performed.
Figure 5.
Figure 5.. Sensitivity of divergence time estimation to methodological decisions.
Between-group principal component analysis (bgPCA) was used to retrieve axes that separate chronograms based on the clock model (A), model of molecular evolution (B), and gene sampling strategy (C) employed. In the latter case, only the first two out of four bgPCA dimensions are shown. The inset shows the centroid for each loci sampling strategy, and the width of the lines connecting them are scaled to the inverse of the Euclidean distances that separates them (as a visual summary of overall similarity). The proportions of total variance explained are shown on the axis labels. The impact of the clock model is such that a bimodal distribution of chronograms can be seen even when bgPCA are built to discriminate based on other factors (as in C).
Figure 5—figure supplement 1.
Figure 5—figure supplement 1.. Sensitivity of divergence time estimation to the use of alternate prior distributions on calibrated nodes.
Between-group principal component analysis (bgPCA) was used to retrieve the axes of maximum discrimination between chronograms estimated by enforcing either uniform or Cauchy prior distributions. The proportion of total variance explained by this axis is shown on the label.
Figure 5—figure supplement 2.
Figure 5—figure supplement 2.. Distribution of posterior probabilities for node ages that show an average difference larger than 20 Myr depending on the choice of clock prior.
Figure 5—figure supplement 3.
Figure 5—figure supplement 3.. Distribution of posterior probabilities for node ages that show a maximum difference larger than 20 Myr depending on the gene sampling strategy.
The largest differences can be seen in the relatively younger ages of Ambulacraria and Echinodermata when using clock-like genes, and in the relatively older ages for some nodes within cidaroids and asteroids when using loci with high occupancy. Other sampling criteria largely agree on inferred node ages, as can also be seen in Figure 5C as short distances between their centroids in the chronospace.
Figure 5—figure supplement 4.
Figure 5—figure supplement 4.. Distribution of posterior probabilities for node ages that are the most affected by the choice of model of molecular evolution.
No node showed average differences larger than 20 Myr, so those suffering the biggest changes are shown instead.
Figure 5—figure supplement 5.
Figure 5—figure supplement 5.. Distribution of posterior probabilities for node ages that are the most affected by the choice of prior distributions on calibrated nodes.
No node showed average differences larger than 20 Myr, so those suffering the biggest changes are shown instead.
Figure 6.
Figure 6.. Divergence times among major clades of Echinoidea and other echinoderms.
(A) Consensus chronogram of the two PhyloBayes (Lartillot et al., 2013) runs using clock-like genes under a CAT + GTR + G model of evolution, an autocorrelated log-normal (LN) clock, and Cauchy prior distributions. Node ages correspond to median values, and bars show the 95% highest posterior density intervals. (B) Lineage-through-time plot, showing the rapid divergence of higher-level clades following the P-T mass extinction (shown with dashed lines, along with the Cretaceous-Paleogene [K-Pg] boundary). Each line corresponds to an individual consensus topology from among the 80 time-calibrated runs performed. (C) Posterior distributions of the ages of selected nodes (identified in A with numbers). The effects introduced by the use of different models of molecular evolution and node age prior distributions are not shown, as they represent the least important factors (see Figure 5); the posterior distributions obtained under different settings of these were merged for every combination of targeted loci and clock prior. Tick marks = 10 Myr.
Figure 6—figure supplement 1.
Figure 6—figure supplement 1.. Number of lineages inferred to have crossed the Permian-Triassic (P-T) boundary.
The probabilities of each scenario are estimated from the inferred divergence times of the 16,000 chronograms sampled across all of the analyses performed (200 for the two runs of each combination of sampled loci, model of molecular evolution, and clock model and prior distribution on node ages). The probability of three or more crown group lineages surviving the P-T extinction is 59.58%. Names show the combination of clades crossing the P-T boundary for each scenario of number of survivors.
Figure 6—figure supplement 2.
Figure 6—figure supplement 2.. Prior distributions of all constrained nodes.
Five-hundred replicates were sampled from the joint prior, showing appropriately broad distributions of node ages. Blue lines show minima and yellow ones maxima (when enforced); dotted lines show the age of the Permian-Triassic (251.9 Ma) and Cretaceous-Paleogene (66 Ma) mass extinction events. Nodes whose ages are of special interest (Echinoidea, Scutelloida, and Clypeasteroida) are shown in pink, revealing large prior probabilities of the divergence occurring at either side of mass extinction events.
Figure 7.
Figure 7.. Relationship between the root-to-tip variance (a proxy for the clock-likeness of loci) and the rate of evolution.
The most clock-like loci (shown in red), which are often favored for the inference of divergence times (e.g., Smith et al., 2018; Carruthers et al., 2020), are among the most highly conserved and can provide little information for constraining node ages (see also Mongiardino Koch, 2021b). Clock-like genes with a higher information content were used instead by choosing the loci with the lowest root-to-tip variance from among those that were within one standard deviation from the mean evolutionary rate (shown in blue).
Appendix 3—figure 1.
Appendix 3—figure 1.. Ordering of loci enforced using genesortR (Mongiardino Koch, 2021b) and its relationship to the seven gene properties employed.
High ranking loci (i.e., the most phylogenetically useful) show low root-to-tip variances (or high clock-likeness), low saturation, and low compositional heterogeneity, as well as high average bootstrap and Robinson-Foulds similarity to a target topology (in this case, with the contentious relationship among major lineages of Echinacea collapsed).
Appendix 3—figure 2.
Appendix 3—figure 2.. Trace plots of the log-likelihood of different time calibration runs.
All runs show evidence of reaching convergence and stationarity before our imposed burn-in fraction of 10,000 generations (dashed lines). For simplicity, only runs under the CAT + GTR + G model and Cauchy priors are plotted. Those run under uniform node age priors behaved identically, while those run under GTR + G converged much faster.

Similar articles

Cited by

References

    1. Aberer AJ, Kobert K, Stamatakis A. ExaBayes: massively parallel bayesian tree inference for the whole-genome era. Molecular Biology and Evolution. 2014;31:2553–2556. doi: 10.1093/molbev/msu236. - DOI - PMC - PubMed
    1. Ali MSM. The paleogeographic distribution of Clypeaster (Echinoidea) during the Cenozoic Era. Neues Jahrb. Für Geol. Und Paläontologie Monatshefte. 1983;8:449–464.
    1. Barras CG. Morphological innovation associated with the expansion of atelostomate irregular echinoids into fine-grained sediments during the Jurassic. Palaeogeography, Palaeoclimatology, Palaeoecology. 2008;263:44–57. doi: 10.1016/j.palaeo.2008.01.026. - DOI
    1. Benton M, Donoghue P, Vinther J, Asher R, Friedman M, Near T. Constraints on the timescale of animal evolutionary history. Palaeontologia Electronica. 2015;18:1–106. doi: 10.26879/424. - DOI
    1. Bolger AM, Lohse M, Usadel B. Trimmomatic: a flexible trimmer for Illumina sequence data. Bioinformatics (Oxford, England) 2014;30:2114–2120. doi: 10.1093/bioinformatics/btu170. - DOI - PMC - PubMed

Publication types