. 2022 May;63(5):100199.
doi: 10.1016/j.jlr.2022.100199. Epub 2022 Mar 18.

Consequences of excessive glucosylsphingosine in glucocerebrosidase-deficient zebrafish

Affiliations

Consequences of excessive glucosylsphingosine in glucocerebrosidase-deficient zebrafish

Lindsey T Lelieveld et al. J Lipid Res. 2022 May.

Abstract

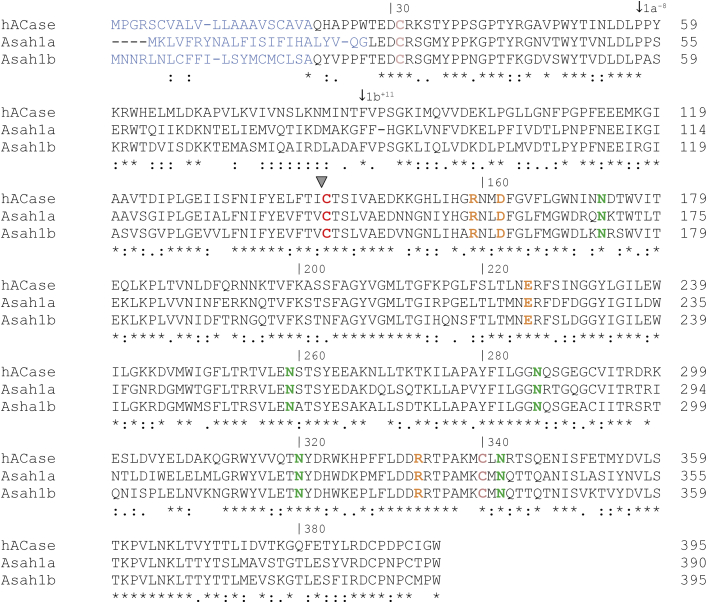
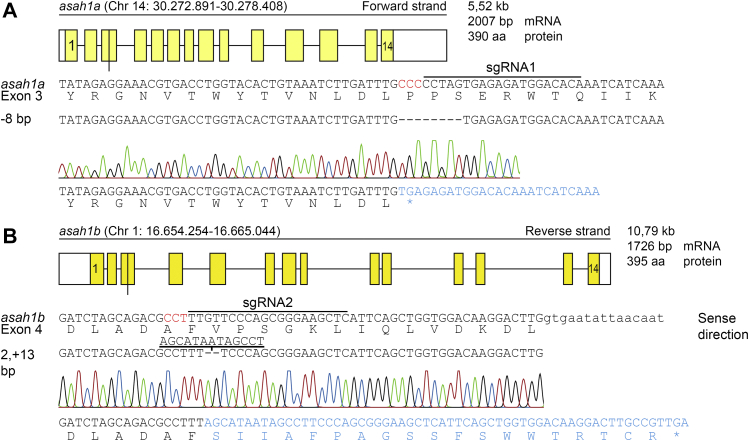
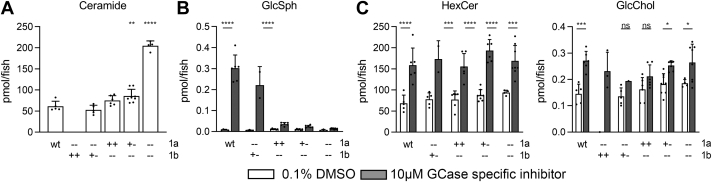
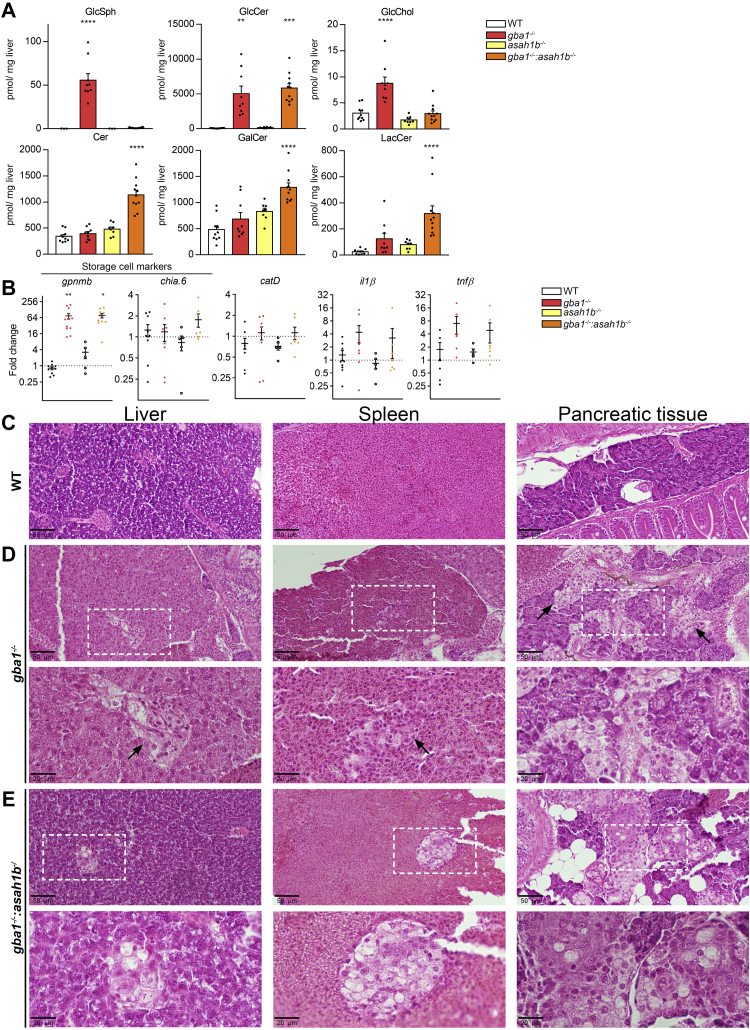
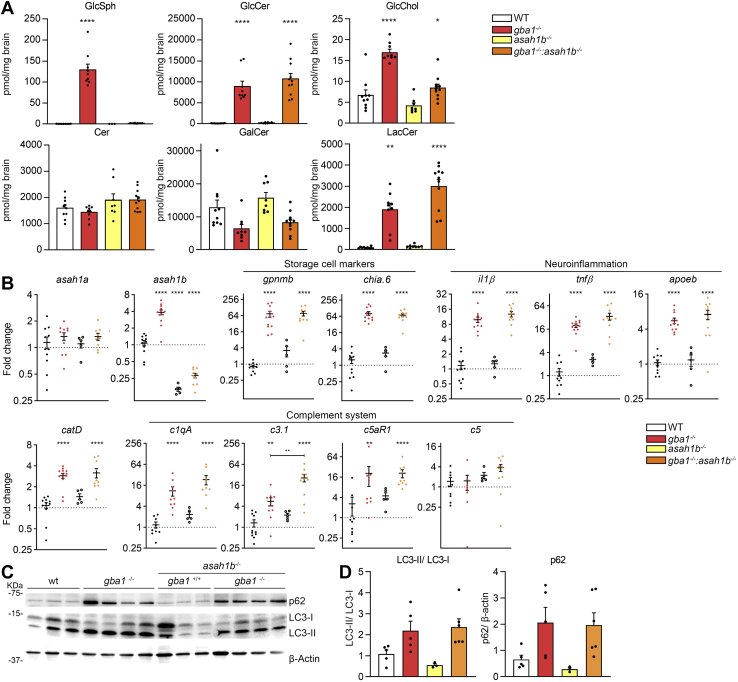
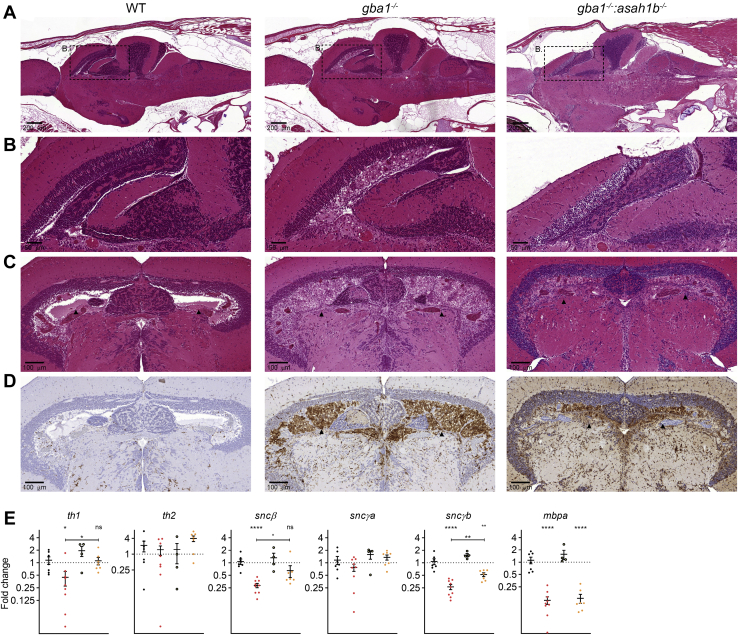
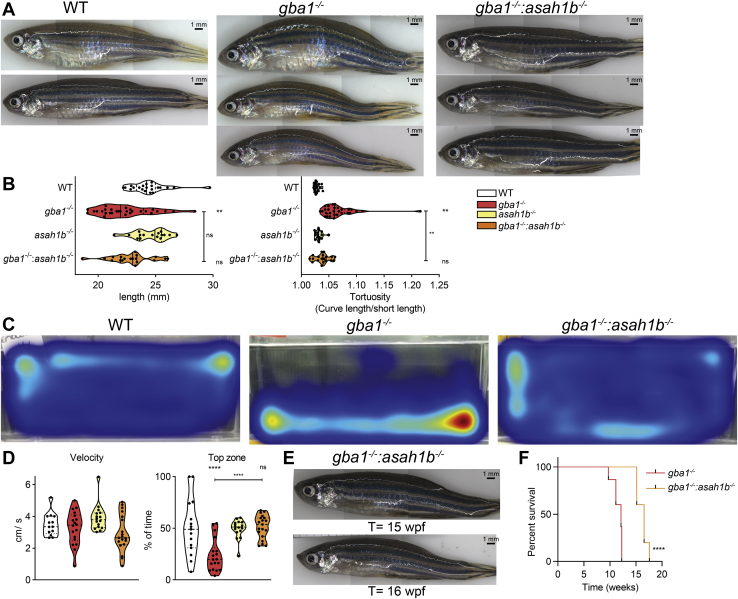
In Gaucher disease (GD), the deficiency of glucocerebrosidase causes lysosomal accumulation of glucosylceramide (GlcCer), which is partly converted by acid ceramidase to glucosylsphingosine (GlcSph) in the lysosome. Chronically elevated blood and tissue GlcSph is thought to contribute to symptoms in GD patients as well as to increased risk for Parkinson's disease. On the other hand, formation of GlcSph may be beneficial since the water soluble sphingoid base is excreted via urine and bile. To study the role of excessive GlcSph formation during glucocerebrosidase deficiency, we studied zebrafish that have two orthologs of acid ceramidase, Asah1a and Asah1b. Only the latter is involved in the formation of GlcSph in glucocerebrosidase-deficient zebrafish as revealed by knockouts of Asah1a or Asah1b with glucocerebrosidase deficiency (either pharmacologically induced or genetic). Comparison of zebrafish with excessive GlcSph (gba1-/- fish) and without GlcSph (gba1-/-:asah1b-/- fish) allowed us to study the consequences of chronic high levels of GlcSph. Prevention of excessive GlcSph in gba1-/-:asah1b-/- fish did not restrict storage cells, GlcCer accumulation, or neuroinflammation. However, GD fish lacking excessive GlcSph show an ameliorated course of disease reflected by significantly increased lifespan, delayed locomotor abnormality, and delayed development of an abnormal curved back posture. The loss of tyrosine hydroxylase 1 (th1) mRNA, a marker of dopaminergic neurons, is slowed down in brain of GD fish lacking excessive GlcSph. In conclusion, in the zebrafish GD model, excess GlcSph has little impact on (neuro)inflammation or the presence of GlcCer-laden macrophages but rather seems harmful to th1-positive dopaminergic neurons.

Keywords: Gaucher disease; acid ceramidase; dopaminergic neurons; glucosylceramide; lipid metabolism; lysosphingolipids; sphingolipids; zebrafish.


Conflict of interest statement

Conflict of interest The authors declare that they have no conflicts of interest with the contents of this article.

Figures

Fig. 1
Fig. 1
Alignment of the amino acid sequence of human ACase, zebrafish Asah1a, and Asah1b. The amino acid sequences of the precursor (prior to autocleavage) human ACase (Uniprot code Q13510), zebrafish Asah1a (Uniprot code Q5XJR7), and Asah1b (Uniprot code Q6PH71) are aligned using ClustalO(1.2.4) (45). (∗) indicates a conserved residue between the three sequences, (:) indicates a strongly similar residue, and (.) indicates a more weak similar residue. The signal peptide is predicted using SignalP-5.0 and depicted in blue (44). Important residues in human ACase are colored: the catalytic Cys143 is depicted in red, Cys31-Cys340 forming a disulfide bridge in pink, residues important for substrate hydrolysis and autocleavage in orange (Arg159 and Asp162, Glu225, Asn320, and Arg332), and the four assigned glycosylation sites in green (31). ACase, acid ceramidase.
Fig. 2
Fig. 2
CRISPR/Cas9-mediated disruption of asah1a and asah1b in zebrafish. A: Top panel: Schematic representation of the asah1a gene on chromosome 14, encoding the predicted 390 amino acid Asah1a enzyme. Middle panel: DNA sequence of exon 3 of asah1a with sgRNA target 1 lined, the PAM site in red, and the protein sequence shown below. Lower panel: The 8 base pair deletion, as obtained from the sequence trace, would lead to a premature stopcodon (∗). B: Top panel: Schematic representation of the asah1b gene on chromosome 4, encoding the predicted 395 amino acid Asah1b enzyme, with the exon in upper case and intron in lower case. Middle panel: DNA sequence of exon 4 of asah1b with sgRNA target 2 lined, the PAM site in red, and the protein sequence shown below. Lower panel: The sequence trace showed an insertion of 11 base pairs, which would lead to a change of amino acid sequence and a premature stopcodon (∗).
Fig. 3
Fig. 3
(Glyco)sphingolipid abnormalities in Asah1a- and/or Asah1b-deficient zebrafish larvae. A: Total ceramide levels (pmol/fish) were determined of individual zebrafish larvae (5 dpf) of off-spring of Asah1a+/-:asah1b+/- crossings. Data is depicted as mean ± SD and analyzed using a One-Way Anova with Dunnett’s multiple comparisons Test and WT as control group. B: Asah1a+/-:asah1b+/- adult zebrafish were crossed and off-spring was treated with vehicle (0.1% (v/v) DMSO) or 10 μm GCase specific inhibitor (ME656) for 5 days. Relevant lipid levels were determined of individual larvae in pmol/fish. WT (n = 5–6), asah1a-/-:asah1b+/- (n = 1–5), asah1a+/+:asah1b-/- (n = 6), asah1+/-:asah1b-/- (n = 7–8), and asah1a-/-:asah1b-/- (n = 4–8). Data is depicted as mean ± SD and analyzed using a Two-Way Anova with Sidak’s multiple comparisons test. Ns = not significant, ∗p < 0.05,∗∗p < 0.01, ∗∗∗p < 0.001, and ∗∗∗∗p < 0.0001.
Fig. 4
Fig. 4
Abnormalities in adult zebrafish visceral organs. A: Lipid levels were determined in pmol/mg liver tissue. GlcSph, GalCer, and GlcChol were separated from their respective galactosylated lipid by HILIC chromatography. Data is depicted as mean ± SEM; WT (n = 10), gba1-/- (n = 9), asah1b-/- (n = 8), and gba1-/-:asah1b-/- (n = 11). Data is analyzed by One-Way Anova with Tukey’s multiple comparison test. B: Expression of gpnmb, chia.6, il-1β, tnfβ, apoEb, or catD mRNA levels were determined using RT-qPCR analysis; WT (n = 6–9), gba1-/- (n = 6–8), asah1b-/- (n = 5), and gba1-/-:asah1b-/- (n = 7). Data is normalized using two housekeeping genes (ef1α and rpl13) and analyzed by One-Way Anova with Tukey’s multiple comparison test. Statistical analysis is depicted of WT versus gba1-/-, asah1b-/-, or asah1b-/-:gba1-/-, only when a significant difference is apparent or of gba1-/- versus asah1b:gba1-/- when significant difference is of interest. Ns = not significant, ∗p < 0.05,∗∗p < 0.01, ∗∗∗p < 0.001, and ∗∗∗∗p < 0.0001. C–E, Zebrafish were serially sectioned along the sagittal plane and stained using H&E. Images of liver, spleen, and pancreatic tissue of WT (C), gba1-/- (D), and gba1-/-:asah1b-/- (E) zebrafish. Areas of interest are marked by dotted boxes, and higher magnifications of these areas are shown below the respective overview images. Scale bars: 50 μm and 20 μm for low and higher magnifications, respectively. GlcSph, glucosylsphingosine; GalCer, galactosylceramide; GlcChol, glucosylated cholesterol.
Fig. 5
Fig. 5
Biochemical abnormalities in adult zebrafish brain. A: Lipid levels were determined of dissected brains in pmol/mg tissue. GlcSph, GalCer, and GlcChol were separated from their respective galactosylated lipid by HILIC chromatography. Data is depicted as mean ± SEM; WT (n = 9–10), gba1-/- (n = 9), asah1b-/- (n = 8), and gba1-/-:asah1b-/- (n = 11). Data is analyzed by One-Way Anova with Tukey’s multiple comparison test. B: mRNA levels of asah1a, asah1b, gpnmb, chia.6, il-1β, tnfβ, apoEb, catD, c1qA, c3.1, c5aR, and c5 was determined using RT-qPCR analysis; WT (n = 9–11), gba1-/- (n = 8–11), asah1b-/- (n = 5), and gba1-/-:asah1b-/- (n = 9–10). Data is analyzed by One-way Anova with Tukey’s multiple comparison test. C: Representative Western blot of p62, LC3-I, LC3-II, β-catenin protein levels in WT, gba1-/-, asah1b-/-, and gba1-/-:asah1b-/- zebrafish brains, with β-actin as protein loading control. D: Quantitative analysis of LC3-II/LC-I levels and p62 protein levels. WT (n = 5), gba1-/- (n = 5), asah1b-/- (n = 3), and gba1-/-:asah1b-/- (n = 6). Statistical analysis is depicted of WT versus gba1-/-, asah1b-/-, or asah1b-/-:gba1-/-, only when a significant difference is apparent or of gba1-/- versus asah1b:gba1-/- when significant difference is of interest. ∗p < 0.05, ∗∗p < 0.01, and ∗∗∗∗ p < 0.0001. GalCer, galactosylceramide; GlcSph, glucosylsphingosine; GlcChol, glucosylated cholesterol.
Fig. 6
Fig. 6
Gaucher-like cells accumulate in gba1-/- and gba1-/-:asah1b-/- brains. A and B: WT, gba1-/-, and gba1-/-:asah1b-/ - brains were serially sectioned in the sagittal plane and H&E stained. Gaucher-like cells occupy the periventricular zone of the optic tectum in both gba1-/-I and gba1-/-:asah1b-/- brain, with higher magnifications of the boxed areas in (A) and (B). Scale bars: 200 μm and 50 μm for the low and higher magnifications, respectively. C: Transverse view of WT, gba1-/-, and gba1-/-:asah1b-/ - brains showing severe bilateral and diffuse accumulation of Gaucher-like cells in the periventricular gray zone of the optic tectum (HE). D: Immunohistochemistry for the zebrafish monocyte/macrophage lineage cells marker L-plastin. Immunoreactive macrophages were abundantly present in the ventricle and periventricular regions of gba1-/- and gba1-/-:asah1b-/- brains but not in the WT brain; counterstaining was performed using hematoxylin. Scale bars: 100 μm in C and D. E: mRNA expression of th1, th2, sncβ, sncγa, sncγb, and mbpa was determined using RT-qPCR analysis; WT (n = 7), gba1-/- (n = 9), asah1b-/- (n = 4), and gba1-/-:asah1b-/- (n = 7). Data of RT-qPCR is normalized using two housekeeping genes (ef1α and rpl13), analyzed by One-Way Anova with Tukey’s multiple comparisons test or a Brown-Forsythe and Welch Anova with Dunnett’s multiple comparisons test for gpnmb and chia.6 and depicted as scattered dot plot ± SEM. Statistical analysis is depicted of WT versus gba1-/-, asah1b-/-, or asah1b-/-:gba1-/-, only when a significant difference is apparent or of gba1-/- versus asah1b:gba1-/- when significant difference is of interest. Ns = not significant, ∗p < 0.05, ∗∗p < 0.01, and ∗∗∗∗p < 0.0001.
Fig. 7
Fig. 7
Phenotypic improvements of adult Asah1b:Gba1 double deficient zebrafish. A: Representative photographs of WT, gba1-/-, and gba1-/-:asah1b-/- zebrafish. B: The length of individual zebrafish is determined (head to tail base) as well as the tortuosity, calculated as ratio of the length along the back divided by the length of the fish, as indication for the curved back. Data of individual zebrafish is depicted in a violin plot; WT (n = 21), gba1-/- (n = 29), asah1b-/- (n = 16), and gba1-/-:asah1b-/- (n = 19) and analyzed using a nonparametric Kruskal–Wallis test with Dunn’s multiple comparison test. C: Representative movement traces of WT, gba1-/,- and gba1-/-:asah1b-/- zebrafish, all at t = 12 wpf. D: Quantification of individual zebrafish average velocity (in cm/s) when in motion and time spend in the top half of the tank. Data of individual zebrafish is depicted in a violin plot; WT (n = 13), gba1-/- (n = 16), asah1b-/- (n = 16), and gba1-/-:asah1b-/- (n = 19) and analyzed using a One-Way Anova with Tukey’s multiple comparison test. E: Photograph of individual gba1-/-:asah1b-/- zebrafish at t = 15 and 16 wpf. F: Kaplan-Meier plot indicating the onset of predetermined symptoms, such as the curved back and abnormal swimming resulting in impaired feeding behavior, of gba1-/- and gba1-/-:asah1b-/- zebrafish; gba1-/- (n = 30), and gba1-/-:asah1b-/- (n = 5). The curves are analyzed using a Log-rank (Mantel-Cos) test. Statistical analysis is depicted of WT versus gba1-/-, asah1b-/- or asah1b-/-:gba1-/-, only when a significant difference is apparent or of gba1-/- versus asah1b:gba1-/- when significant difference is of interest. Ns = not significant, ∗∗p < 0.01 and ∗∗∗∗p < 0.0001. wpf, week postfertilization.

References

    1. Ferraz M.J., Kallemeijn W.W., Mirzaian M., Herrera Moro D., Marques A., Wisse P., Boot R.G., Willems L.I., Overkleeft H.S., Aerts J.M. Gaucher disease and Fabry disease: new markers and insights in pathophysiology for two distinct glycosphingolipidoses. Biochim. Biophys. Acta. 2014;1841:811–825. - PubMed
    1. Bodamer O.A., Hung C. Laboratory and genetic evaluation of Gaucher disease. Wien Med. Wochenschr. 2010;160:600–604. - PubMed
    1. Mechtler T.P., Stary S., Metz T.F., De Jesus V.R., Greber-Platzer S., Pollak A., Herkner K.R., Streubel B., Kasper D.C. Neonatal screening for lysosomal storage disorders: feasibility and incidence from a nationwide study in Austria. Lancet. 2012;379:335–341. - PubMed
    1. Pollak A., Kasper D.C. Austrian newborn screening program: a perspective of five decades. J. Perinat. Med. 2014;42:151–158. - PubMed
    1. Platt F.M., d'Azzo A., Davidson B.L., Neufeld E.F., Tifft C.J. Lysosomal storage diseases. Nat. Rev. Dis. Primers. 2018;4:27. - PubMed

Publication types