. 2022 Mar 22;7(6):e152186.
doi: 10.1172/jci.insight.152186.

CFTR-mediated monocyte/macrophage dysfunction revealed by cystic fibrosis proband-parent comparisons

Affiliations

CFTR-mediated monocyte/macrophage dysfunction revealed by cystic fibrosis proband-parent comparisons

Xi Zhang et al. JCI Insight. .

Abstract

Cystic fibrosis (CF) is an inherited disorder caused by biallelic mutations of the CF transmembrane conductance regulator (CFTR) gene. Converging evidence suggests that CF carriers with only 1 defective CFTR copy are at increased risk for CF-related conditions and pulmonary infections, but the molecular mechanisms underpinning this effect remain unknown. We performed transcriptomic profiling of peripheral blood mononuclear cells (PBMCs) of CF child-parent trios (proband, father, and mother) and healthy control (HC) PBMCs or THP-1 cells incubated with the plasma of these participants. Transcriptomic analyses revealed suppression of cytokine-enriched immune-related genes (IL-1β, CXCL8, CREM), implicating lipopolysaccharide tolerance in innate immune cells (monocytes) of CF probands and their parents. These data suggest that a homozygous as well as a heterozygous CFTR mutation can modulate the immune/inflammatory system. This conclusion is further supported by the finding of lower numbers of circulating monocytes in CF probands and their parents, compared with HCs, and the abundance of mononuclear phagocyte subsets, which correlated with Pseudomonas aeruginosa infection, lung disease severity, and CF progression in the probands. This study provides insight into demonstrated CFTR-related innate immune dysfunction in individuals with CF and carriers of a CFTR mutation that may serve as a target for personalized therapy.

Keywords: Epigenetics; Macrophages; Monocytes; Pulmonology.


Conflict of interest statement

Conflict of interest: The authors have declared that no conflict of interest exists.

Figures

Figure 1
Figure 1. Schematic of main study procedures.
DEGs, differentially expressed genes; FEV1, forced expiratory volume in 1 second.
Figure 2
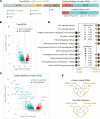
Figure 2. Immune-associated genes and pathways are significantly downregulated in CF PBMCs compared with HCs.
(A) Transcripts differentially expressed between CF probands (n = 14) and HCs (n = 8) in the PBMC model, divided into categories according to locus type. We identified differentially expressed transcripts that displayed a more than 2-fold change in expression level and an FDR-adjusted P < 0.05. (B and C) Volcano plots of differentially expressed transcripts. (D) Bubble plot of the top 10 significant pathways in WikiPathways, ranked by the number of genes in the pathway. For the plasma model: CF probands (n = 24), HCs (n = 20). (E) Venn diagrams showing the numbers and overlap of unique genes (upper) and top 20 pathways (lower) for CF probands versus HCs in the PBMC and plasma models.
Figure 3
Figure 3. CF carriers and probands share highly similar transcriptomic profiles in PBMCs.
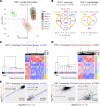
(A) Principal component analysis (PCA) of data from the PBMC (left; n = 36) and plasma models (right; probands, n = 92). (B) Venn diagrams of the numbers and overlap of DEGs from the PBMC and plasma models; comparisons are as indicated. Trio-shared and proband-unique genes are highlighted in blue and red, respectively. (C and D) Top, hierarchical clustering of study participants; bottom, heatmap of the expression of trio-shared and proband-unique genes in the PBMC model. (E) Correlation scatterplots of the fold change (log2) of the 2 indicated comparisons of the expression of trio-shared (left) and proband-unique genes (right) from the PBMC model. The P value and R2 (square of the correlation coefficient) were produced by a Pearson’s correlation analysis. The linear regression line and its equation were generated from a simple linear regression analysis. P, proband; F, father; M, mother; FC, fold change.
Figure 4
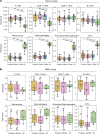
Figure 4. Immune cell composition differs between CF parent-child trios and HCs.
Dot and box plots of the cell composition scores of 8 cell subsets in the (A) plasma model (probands, n = 24; parents/carriers, n = 48; HCs, n = 20) and (B) PBMC model (probands, n = 14; parents/carriers, n = 14; HCs, n = 8). Estimates of cell numbers in each cell subset were calculated for CF trios and HCs. The means were compared by paired and unpaired independent t test, as appropriate; and P values were adjusted using Holm-Šidák method to control the family-wise error rate; *P < 0.05, **P < 0.01.
Figure 5
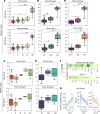
Figure 5. Compositions of monocytes and macrophages in the plasma and PBMC models are correlated with CF disease severity and progression.
(AE) Dot and box plots of cell composition scores (see Methods) of monocytes and macrophages in patients with CF grouped based on their (A and C) CFTR class, (B and D) pancreatic function, and (E) P. aeruginosa infection status. Estimations of cell numbers in each cell subset were compared between subgroups of patients with CF (F and G). Correlation analysis of cell abundance with sweat chloride and percent predicted FEV1. Plasma model (A, B, and E); PBMC model (C, D, F, and G). The means were compared by paired and unpaired independent t test, as appropriate; and P values were adjusted using Holm-Šidák method to control the family-wise error rate. The P value and R (correlation coefficient) were produced by a Pearson’s correlation analysis (normal distribution assumed). *P < 0.05, **P < 0.01. Mono, monocytes; Macro, macrophages; Macro_ac, activated macrophages; DC_ac, activated dendritic cells; PI, pancreatic insufficient; PS, pancreatic sufficient.
Figure 6
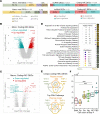
Figure 6. Plasma-cultured monocytes, but not macrophages, show dramatic changes in gene expression.
(A) Breakdown of differentially expressed transcripts (fold change <–2 or >2, FDR P < 0.05, CF probands versus HCs in the THP-1 monocyte and macrophage models) in main categories according to locus type. (B and C) Volcano plots of (B) all differentially expressed transcripts and the (C) differentially expressed transcripts in “coding” and “multiple complex” (MC) categories. (D) Bubble plot of top 10 significant pathways in WikiPathways ranked by number of regulated genes. (E) Venn diagrams showing the numbers and overlap of unique genes (upper) and top 20 pathways (lower) for CF probands versus HCs in the indicated models. (F) Bar plot of THP-1 cell numbers after 4 days of culture with CF plasma. Dunn’s multiple comparison for nonparametric post hoc testing was performed following the Kruskal-Wallis test to compare the differences between HC and other groups. ***P < 0.001. Pa, P. aeruginosa; Sa, Staphylococcus aureus; Ng, negative; FBS, fetal bovine serum; DEGs, differentially expressed genes.
Figure 7
Figure 7. Transcriptomic profiles of CF carriers and probands are less correlated in the THP-1 monocyte model than the PBMC model.
(A) PCA of THP-1 monocytes and macrophages incubated with study participant plasma based on similarities in transcriptomic profiling. (B) Venn diagrams showing the numbers and overlap of DEGs from THP-1 models. (C and D) Trio-shared and proband-unique genes are highlighted in blue and red, respectively. Hierarchical clustering by trio subgroups and heatmap of gene expression of (C) trio-shared genes and (D) proband-unique genes from the THP-1 monocyte model. (E) Correlation scatterplots of fold changes (log2) of the indicated comparison of the fold change (log2) of expression of trio-shared (left) and proband-unique genes (right) in the THP-1 model. The P value and R2 (square of the correlation coefficient) were produced by a Pearson’s correlation analysis. The linear regression line and its equation were generated from a simple linear regression analysis. Mono, monocyte; Macro, macrophage; P, proband; F, father; M, mother; FC, fold change.
Figure 8
Figure 8. Integrated pathway enrichment analysis suggests an LPS-tolerant state in CF trios.
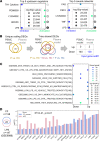
(A) Bubble plot of the top 5 significant upstream regulators and causal networks, ranked by P value, from Ingenuity Pathway Analysis (IPA) using genetic profiles from the PBMC model (see Methods). (B) Flow of identification and selection to identify input gene set 1 for gene set enrichment analysis (GSEA). First, the overlapping coding genes (n = 157) from the PBMC and plasma models (CF proband versus HC) were identified. Then, the overlapping genes (n = 140) from these genes with DEGs from comparison of CF participants versus HCs were identified; the final input gene set (n = 138) were identified as the genes regulated in same directions in both PBMC and plasma models. P, proband; F, father; M, mother. (C) Bubble plot of gene sets from GSEA matched with input gene set 1. The top 10 matched gene sets were ranked by q value (FDR). (D) Left, Venn diagram of the 22 overlapping genes from input gene set 1 and the annotated LPS-inducible gene set (GSE9988). Right, bar plot of fold change (log2) of the expression levels of genes in both input gene set 1 and the annotated LPS-inducible gene set (CF or LPS versus HC). Fold change values from input gene set 1 were reversed from negative to positive for ease of visualization. The P value and R2 (square of the correlation coefficient) were produced by a Pearson’s correlation analysis.

References

    1. Sanders DB, et al. Risk factors for the progression of cystic fibrosis lung disease throughout childhood. Ann Am Thorac Soc. 2014;11(1):63–72. doi: 10.1513/AnnalsATS.201309-303OC. - DOI - PMC - PubMed
    1. Khoury O, et al. Immunomodulatory cell therapy to target cystic fibrosis inflammation. Am J Respir Cell Mol Biol. 2018;58(1):12–20. doi: 10.1165/rcmb.2017-0160TR. - DOI - PubMed
    1. Rieber N, et al. Current concepts of immune dysregulation in cystic fibrosis. Int J Biochem Cell Biol. 2014;52:108–112. doi: 10.1016/j.biocel.2014.01.017. - DOI - PubMed
    1. Cohen TS, Prince A. Cystic fibrosis: a mucosal immunodeficiency syndrome. Nat Med. 2012;18(4):509–519. doi: 10.1038/nm.2715. - DOI - PMC - PubMed
    1. Ratner D, Mueller C. Immune responses in cystic fibrosis: are they intrinsically defective? Am J Respir Cell Mol Biol. 2012;46(6):715–722. doi: 10.1165/rcmb.2011-0399RT. - DOI - PubMed

Substances